

INTRODUCTION
Angiomyolipoma (AML) is the most common benign tumor of kidneys. The tumor is characterized by the presence of fat [1], and the detection of the macroscopic fat within the lesion represents an important approach for the diagnosis of AML [2, 3]. Some of the AML cases, however, contains low amount of fat and are hardly be detected using conventional computed tomography (CT). The lipid-poor AMLs are often wrongly diagnosed as renal cell carcinoma (RCC) that leads to unnecessary surgeries performed.
In recent years, the analysis of CT images using Hounsfield unit (HU) thresholds has been proposed for the AML diagnosis. Although there are several studies evaluating the HU thresholds, a definite HU threshold with optimal sensitivity and specificity remains to be established [4–8]. The use of magnetic resonance imaging (MRI) has been shown to improve the differentiation of AML from RCC [8], however, CT is still the first-line imaging modality for evaluating renal diseases in most clinical practice worldwide [9]. Matthew et al. recommended the combined use of an attenuation threshold of -10 HU and a region-of-interest (ROI) size of 19–24 mm2 with a modern multi-detector CT scanners at 5-mm collimation for the diagnosis of renal AML [10]. This method has greatly improved the AML diagnosis; however, it cannot be generalized to small size renal masses, in which the lowest-attenuation areas are small. In addition, it remains a challenge to differentiate AML from clear cell RCC with intratumoral fat [11–17].
Given the potential problems associated with the detection of macroscopic fat in AML using CT, especially for the lipid-poor AML, an improvement of the diagnostic method is urgently needed. In single-source dual-energy CT, water and iodine are often selected as the basis pair for material-decomposition image presentation [18, 19]. The content of iodine in iodine-based material-decomposition images can be accurately quantified. Comparing to conventional qualitative CT image analysis, the use of iodine content could increase the sensitivity and specificity for differentiating histological-like tissues, for example, between small hepatic hemangiomas and small hepatocellular carcinomas [20]; between benign and malignant nodules in thyroid and adrenal glands [21, 22]. In view of these encouraging results, the present work evaluated the use of iodine content in single-source dual-energy CT imaging of the non-fat renal mass, investigating its usefulness as a tool to differentiate AML from RCC.
RESULTS
CT imaging findings
The typical iodine-based material deposition images of the CT of RCC and AML were shown in Figure 1 and Figure 2, respectively. The iodine level at the unenhanced and all three enhanced phases were quantitatively determined from ROIs (red circles). The mean mass size of AML was 2381.78 ± 1450.38 mm2, while that of RCC was 1130.50 ± 1366.93 mm2. Although the mean mass size of RCC was smaller than that of AML, no significant difference was found (P = 0.089).
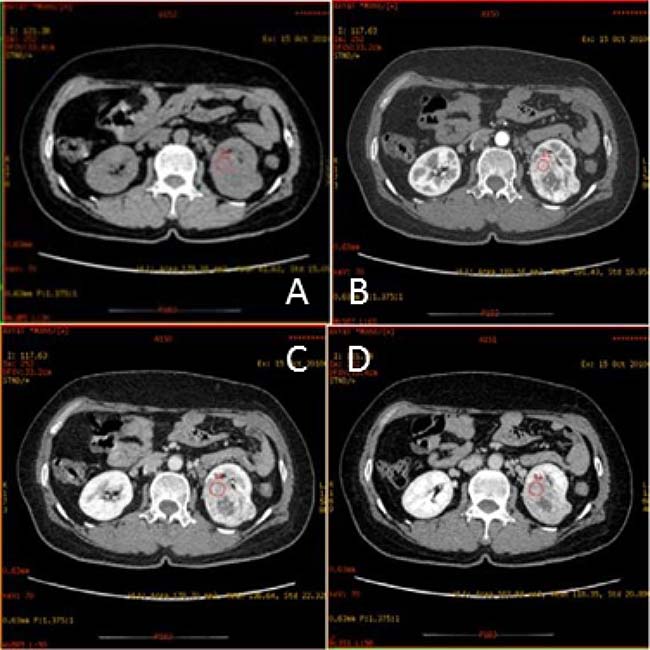
Figure 1: Transverse CT scans of a 51-year old woman with clear cell RCC in left kidney. Shown are (A) unenhanced scan; (B) corticomedullary phase scan showing mass with heterogeneous attenuation and containing no area with attenuation as low as that of perinephric fat; (C) nephrographic phase scan; and (D) excretory phase scan. The red circles are the region of interest (ROI).
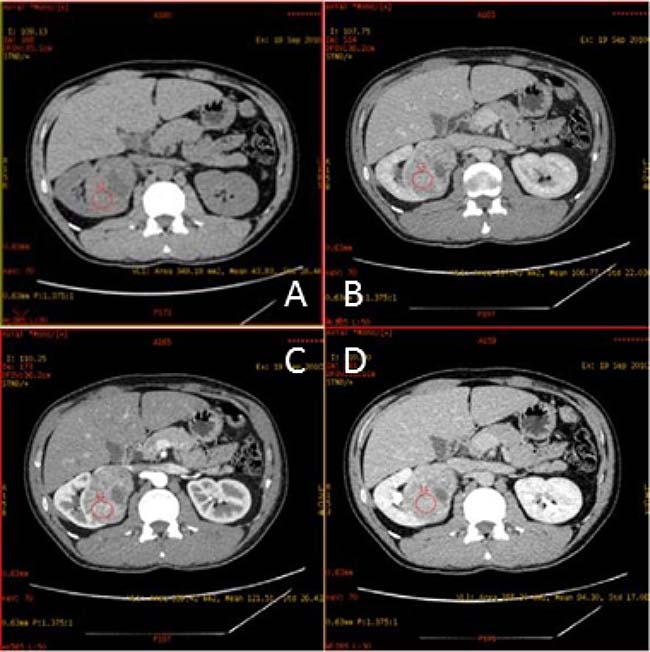
Figure 2: Transverse CT scans of a 34-year old man with AML in right kidney. Shown are (A) unenhanced scan; (B) corticomedullary phase scan showing mass with heterogeneous attenuation and containing no area with attenuation as low as that of perinephric fat; (C) nephrographic phase scan; and (D) excretory phase scan. The red circles are the region of interest (ROI).
Iodine concentration in the lipid-poor portion of renal mass and abdominal aorta of AML and RCC
The iodine concentrations in the lipid-poor portion of renal mass and abdominal aorta of AML and RCC were determined (Table 1, left). For the renal mass of AML, the iodine concentration at the unenhanced phase was 0.31 ± 0.22 mg/cm3, with the level at the corticomedullary, nephrographic and excretory phases be 3.20 ± 1.82 mg/cm3, 2.29 ± 1.10 mg/cm3 and 2.02 ± 0.44 mg/cm3, respectively. For the renal mass of RCC, the iodine level at the unenhanced phase (0.41 ± 0.13 mg/cm3) was not significantly different from that of AML (P = 0.298). Notably, the iodine contents at all the enhanced phases of RCC were significantly higher than those of AML, with the most significant be seen at the corticomedullary phase (P = 0.007). The overall iodine concentration in the lipid-poor portion renal mass of RCC was also significantly elevated comparing to that of AML (P = 0.009). The iodine levels in the abdominal aorta of patients with AML and RCC were also studied. Analysis indicated no significant differences between AML and RCC at unenhanced and enhanced phases (Table 1, right) (Figure 3).
Table 1: Comparison of iodine concentrations of the renal mass (RM) and abdominal aorta (AO) between AML and RCC at three enhanced phases
Enhanced phases |
Group |
Iodine at RM (mg/cm3) |
P value |
Iodine at AO (mg/cm3) |
P value |
|---|---|---|---|---|---|
Corticomedullary |
RCC |
7.16 ± 3.08 |
0.007 |
11.67 ± 2.15 |
0.418 |
AML |
3.20 ± 1.82 |
10.31 ± 3.23 |
|||
Nephrographic |
RCC |
4.86 ± 2.43 |
0.016 |
5.17 ± 1.61 |
0.420 |
AML |
2.29 ± 1.10 |
5.73 ± 1.58 |
|||
Excretory |
RCC |
3.80 ± 1.90 |
0.022 |
3.87 ± 1.52 |
0.674 |
AML |
2.02 ± 0.44 |
3.65 ± 0.66 |
Remark: 1) Data were presented as mean ± standard derivation; 2) P values represented comparisons between RCC and AML.
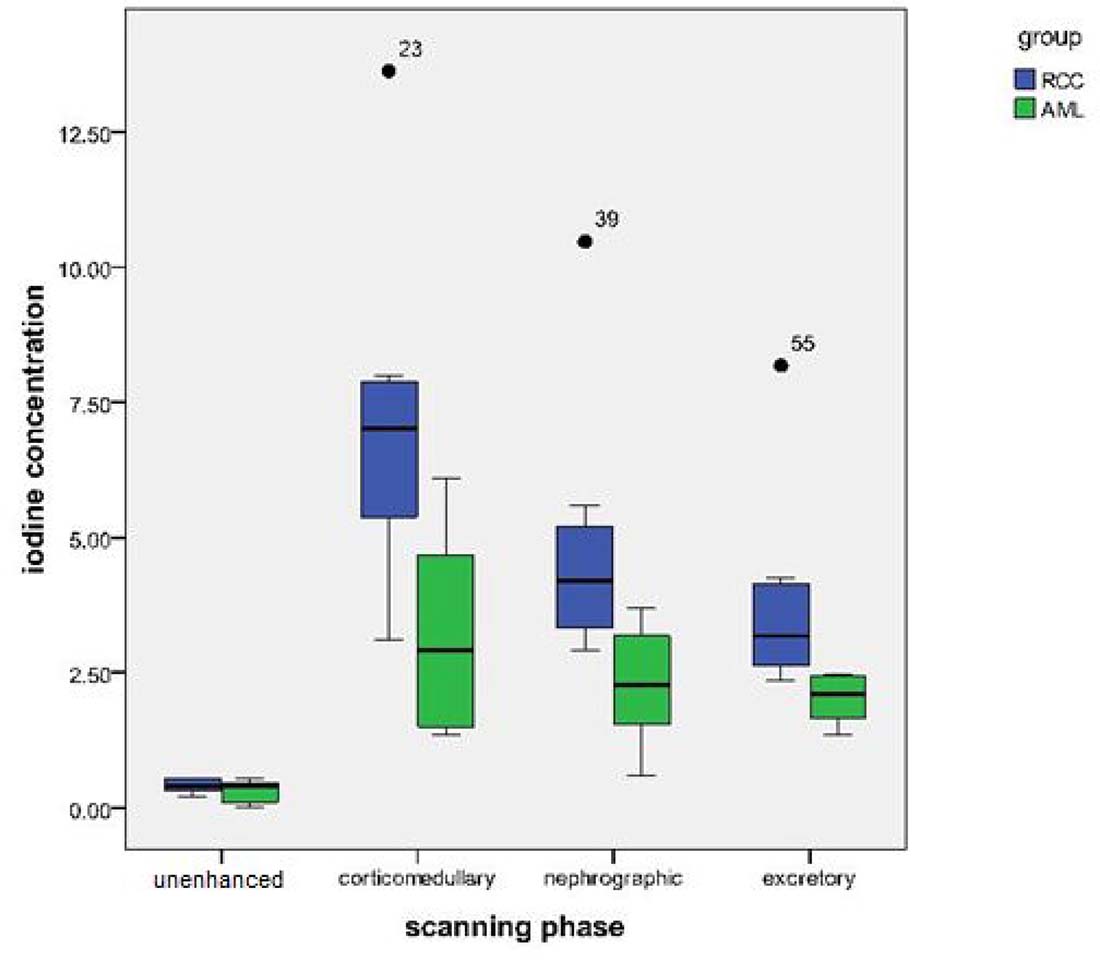
Figure 3: Box-and-whisker plot comparing the iodine concentrations of renal masses between AML and RCC. The most significant difference was seen at the corticomedullary phase.
Dynamic changes in iodine concentration across three enhanced phases of AML and RCC
The dynamic patterns of iodine were demonstrated by the enhanced corticomedullary phase (polyline C1–0), and the difference in iodine concentrations between the corticomedullary and delayed phases (polyline C3–0). Between AML and RCC, significant differences were noted at polyline C1–0 (P = 0.008) and polyline C3–0 (P = 0.023). For RCC, the average iodine concentration in the corticomedullary phase was significantly higher than that in the delayed phase (P = 0.002). The average iodine concentration of the nephrographic phase was also significantly higher than that of delayed phase (P = 0.032), with a significant negative trend between average iodine concentration and enhanced scanning phase (P < 0.001) (Figure 4A). For AML, however, no significant correlations between iodine content and CT scanning phase were established (P = 0.098) (Figure 4B).
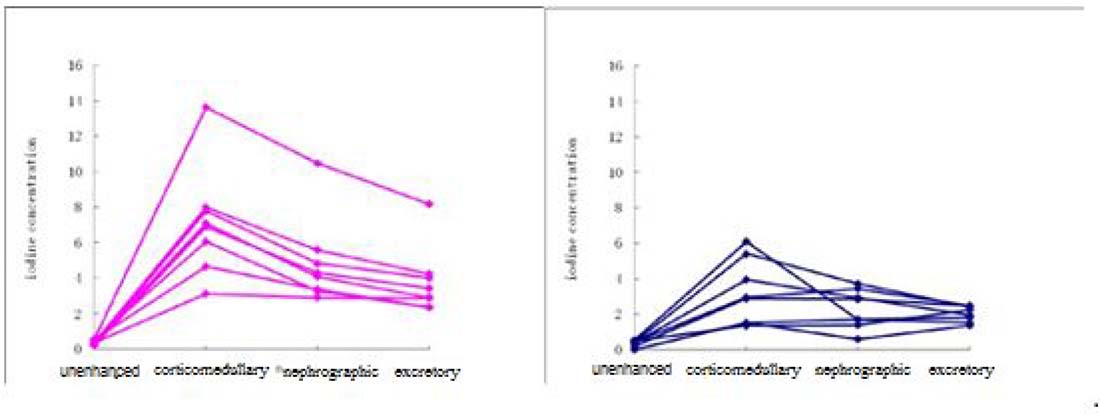
Figure 4: Dynamic change of iodine concentration in the renal masses of (A) RCC and (B) AML at the unenhanced and three enhanced phases. Each line represents the iodine concentration of each patient.
CT value in the lipid-poor portion of renal mass and abdominal aorta in AML and RCC
The CT values of the lipid-poor portions of the renal masses of AML and RCC were studied. At the unenhanced phase, the difference between two groups was not significant (AML, 20.42 ± 40.74 HU; RCC, 36.20 ± 10.09 HU; P = 0.306). However, of note, at each of the three enhanced phases, the CT value of RCC was elevated by ~2 folds compared to AML, with the most significant elevation be seen at the corticomedullary phase (corticomedullary, P = 0.001; nephrographic, P = 0.011; excretory, P = 0.014) (Table 2, left). The CT values in the abdominal aorta of patients with AML and RCC were studied in a similar way. No substantial differences in the CT values (P = 0.931) between AMLM and RCC were observed at the unenhanced phase, and at each of the enhanced phases, the difference was also insignificant (corticomedullary, P = 0.418; nephrographic, P = 0.420; excretory, P = 0.674) (Table 2, right).
Table 2: Comparison of CT values of the renal mass (RM) and abdominal aorta (AO) between AML and RCC at three enhanced phases
Enhanced phases |
Group |
CT at RM (HU) |
P value |
CT at AO (HU) |
P value |
|---|---|---|---|---|---|
Corticomedullary |
RCC |
199.11 ± 68.02 |
0.001 |
315.86 ± 71.18 |
0.418 |
AML |
72.86 ± 58.90 |
281.02 ± 70.37 |
|||
Nephrographic |
RCC |
144.09 ± 53.15 |
0.011 |
154.06 ± 38.96 |
0.420 |
AML |
67.48 ± 51.98 |
169.54 ± 39.96 |
|||
Excretory |
RCC |
117.67 ± 41.18 |
0.014 |
120.70 ± 37.26 |
0.674 |
AML |
60.07 ± 37.68 |
118.28 ± 16.99 |
Remark: 1) Data were presented as mean ± standard derivation; 2) P values represented comparisons between RCC and AML.
Dynamic changes in CT value across three enhanced phases of AML and RCC
The overall difference between AML and RCC in CT values at enhanced phases was significant (P = 0.005). The patterns of CT value changes between the two were also significantly different (P = 0.002). The CT value for corticomedullary phase imaging in the lipid-poor portion of RCC was substantially higher than that in AML (162.91 ± 73.31 HU vs 52.44 ± 41.08 HU; t = 3.718; P = 0.002). There was a significant negative trend in CT values from the corticomedullary to the excretory phase in the lipid-poor portion of RCC (P < 0.001). For AML, there were no significant differences in CT values in the non-fat tissues from the corticomedullary to the excretory phases (P = 0.498) (Figure 5). Of note, correlation analysis indicated a strong Pearson’s correlation (r = 0.919; P < 0.001) between iodine concentration and CT value in the lipid-poor portion of the renal masses.
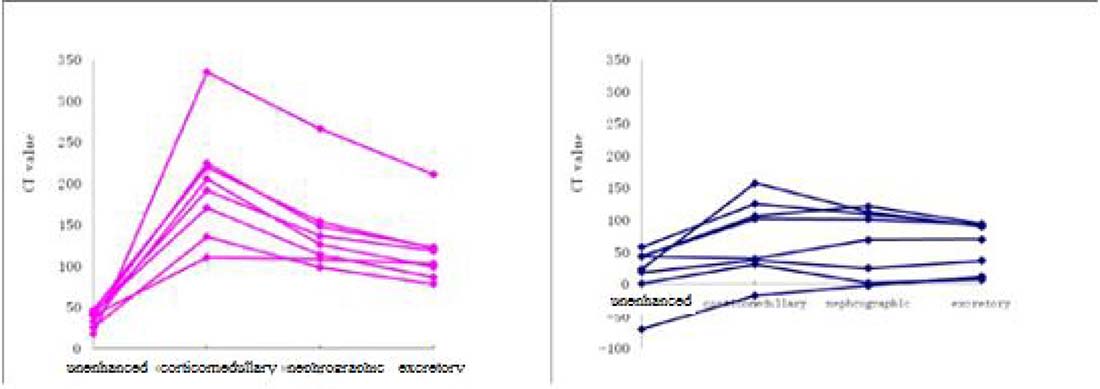
Figure 5: Dynamic change of CT values in the renal masses of (A) RCC and (B) AML at the unenhanced and three enhanced phases. Each line represents the CT value of each patient.
DISCUSSION
The present study assessed the iodine concentration in the non-fat mass of AML and RCC using CT, and found that at all the three enhanced phases the iodine concentrations in the renal mass of RCC were significantly higher than those of AML. Notably in the non-fat mass of RCC the iodine concentration correlated well with the CT value. The iodine concentration in the non-fat renal mass could be a promising tool for the differential diagnosis of AML and RCC. The finding is of clinical importance because currently the differential diagnosis of AML and RCC relies on the detection of intratumoral fat in the renal mass, which can potentially be problematic. Some AMLs have low amount of fat that is not readily detected [4]; while some forms of RCC are rich in intratumoral fat. The misdiagnosis of AML as RCC can lead to the performance of unnecessary surgery in patients. Effective methods that allow radiologists to accurately differentiate AML with minimal fat within from RCC are urgently needed. Studies have been conducted to refine the CT scan for AML by adjusting HU thresholds. Biphasic helical CT may be useful in differentiating AML with minimal fat from RCC. Another study suggested that CT images with non-round shape without capsule and prolonged enhancements would be used to differentiate lipid-poor AML from RCC [23]. In addition, texture analysis was shown to be a reliable quantitative method for the discrimination of minimal fat AML, clear cell RCC, and papillary RCC [24]. However, a definite guideline for differentiation of AML from RCC using all these approaches has yet to be established.
Our study clearly demonstrated that in all enhanced phases, the iodine concentrations of the renal masses of RCC were significantly higher than those of AML. The iodine measured in the study was derived from the renal tissues uptake of the contrast medium through hemoperfusion. In our cohort, most RCCs were classified as clear cell carcinoma. The observed high iodine level in the renal mass of RCC was likely attributed to the fact that the perfusion index was reported to be higher in clear cell RCC compared to AML [25]. Indeed, high perfusion index was associated with high microvessel density [26–28].
In addition to the iodine level in the renal mass, the dynamic changes of iodine content along the three enhanced phases of RCC and AML were also significantly different from each other. For RCC, there was a significant negative trend between average iodine concentration and scanning phases (from corticomedullary to delayed phase). Tissue iodine concentration is dependent of the level of tissue perfusion, which is positively correlated with tissue enhancement [29]. Of interest, the change pattern in iodine concentrations in RCC was in agreement with the results from Hong et al. [30]. No significant trend between iodine concentration and scanning phase was found in AML, this may due to the various amounts of vessels and muscles presence in different AML masses.
The CT values obtained in this study correlated significantly with iodine concentrations, further suggesting that iodine concentration could reflect tissue enhancement. The positive correlation determined in this study might be resulted from the rich blood supply of kidney. It is important to determine whether the correlation would also be seen in organs with less blood supply, for example breast, pancreas, and bone. Although iodine and barium are two different contrast materials showing similar enhancements and comparable CT values in conventional CT, the use of single-source dual energy CT can still be able to distinguish between them [31, 32]. Of importance, measuring iodine concentration would eliminate the beam-hardening artifacts and averaging attenuation effects of polychromatic x-rays.
In summary, the present study provided evidences supporting the use of iodine concentration as an alternative diagnostic method to the detection of intratumoral macroscopic fat. Lipid-poor AMLs are often misdiagnosed as RCC with the use of macroscopic fat, therefore, the findings of this work are of great importance. Nevertheless, the diagnostic usefulness of iodine in AML remains to be further validated in an independent cohort of larger size. In this study, the contrast medium was administered as a fixed dose with a single injection rate. Effects of varying the doses and injection rate of contrast medium will need to be evaluated.
PATIENTS AND METHODS
Study population
A total of sixteen patients, admitted to our hospital between July 2010 and April 2011, was enrolled in the present study. Among them, six were males and 10 were females. The mean age of the patients was 47.8 years old (range from 33 to 74 years old). RCC was diagnosed in eight patients by standard pathologic and histologic studies for malignancy, while AML was confirmed in the remaining eight patients. Most RCC cases were classified as clear cell carcinoma. All patients with AML were given ultrasound examination to exclude the possibility of malignancy at the initial diagnosis, and all of them were followed up at least 6 months with neither clinical nor radiologic findings suggesting the presence of other diseases. Patients received treatment before the initial CT were excluded from the study. The study was approved by the institutional ethics committee. The collection of informed consent from patients was waived because of the nature of the study.
CT examination
All patients underwent scanning in a supine position with spectral CT imaging mode using a GE Discovery CT750 HD CT scanner (GE Healthcare, Milwaukee, WI, USA) per manufacturer’s instruction. Each patient received a non-enhance scanning, followed by a three-phase contrast-enhanced CT. To conduct the contrast-enhanced CT, patients were given a nonionic contrast material Omnipaque (i.e. 300 mgl/mL iohexol, GE Healthcare) at a dosage of 1.5 mL/kg body weight by injection through the antecubital venous at a rate of 3 to 4 mL/second. The scanning delay for the corticomedullary, nephrographic, and excretory phase imaging was 30 seconds, 60 seconds, and 120 seconds, respectively. The scanning was performed with the fast tube voltage switching between 80 and 140 kVp on adjacent views during a single rotation, and with the following settings: a collimation of 5 mm, a reconstructed thickness of 0.625 mm, an automatic tube current modulation, a rotation speed of 0.8 second, and a helical pitch of 1.375.
Image processing and iodine determination
All images captured from the single-source dual-energy CT scanning were transferred to a GE AW4.4 workstation for reconstruction using projection-based material-decomposition software and standard reconstruction kernel. Water and iodine-based material decomposition images were reconstructed for analysis. Monochromatic images obtained at energy ranging from 40 to 140 keV were also retrieved. Iodine concentration in the non-fat areas of renal mass and the abdominal aorta was calculated from the regions-of-interest (ROIs) placed on the designated areas using GSI Viewer software. For the same slice, iodine was determined at unenhanced, corticomedullary, nephrographic, and excretory phases. Each ROI had at least 100 pixels, and no ROIs were placed on the areas of intratumoral fat, necrosis, calcification, surrounding renal parenchyma, and peri-renal fat.
Statistical analysis
All statistical analyses were performed using SPSS software for Windows version 15.0 (SPSS Inc., Chicago, IL, USA). The differences in mass size between AML and RCC was assessed using unpaired Student’s t test, while the differences in iodine concentration and CT values between two groups were examined using repeated measures analysis. Correlation between CT value and iodine concentration was calculated using Pearson’s correlation. Statistical significance was identified by a two-tailed P value < 0.05.
Impact
Angiomyolipoma (AML) is the most commonly seen benign tumor in kidneys, but many lipid-poor AMLs are wrongly diagnosed as renal cell carcinoma (RCC), leading to unnecessary surgery. The misdiagnosis is attributed to the fact that the low amount of fat can hardly be detected using conventional computed tomography (CT). the present study demonstrated that between AML and RCC there was significant difference in iodine concentrations in the lipid-poor portion of renal masses. The iodine concentration may be diagnostic alternative to the intratumoral macroscopic fat.
Author contributions
Jia Sun have made substantial contributions to conception and design of the study; Xiao-Yan Zhang searched literature; Xiao-Ting Li extracted data from the collected literature; Yan-Ling Li and Zhi-Long Wang contributed to the analysis of data; Jia Sun wrote and revised the manuscript; All authors approved the final version of the manuscript.
CONFLICTS OF INTEREST
The authors declare that they have no conflicts of interests.
REFERENCES
1. Boll DT, Merkle EM, Paulson EK, Fleiter TR. Coronary stent patency: dual-energy multidetector CT assessment in a pilot study with anthropomorphic phantom. Radiology. 2008; 247:687–95. https://doi.org/10.1148/radiol.2473070849.
2. Kim JK, Park SY, Shon JH, Cho KS. Angiomyolipoma with minimal fat: differentiation from renal cell carcinoma at biphasic helical CT. Radiology. 2004; 230:677–84. https://doi.org/10.1148/radiol.2303030003.
3. Mazziotti S, Cicero G, D’Angelo T, Marino MA, Visalli C, Salamone I, Ascenti G, Blandino A. Imaging and Management of Incidental Renal Lesions. Biomed Res Int. 2017; 2017:1854027. https://doi.org/10.1155/2017/1854027.
4. Kim JY, Kim JK, Kim N, Cho KS. CT histogram analysis: differentiation of angiomyolipoma without visible fat from renal cell carcinoma at CT imaging. Radiology. 2008; 246:472–79. https://doi.org/10.1148/radiol.2462061312.
5. Simpson E, Patel U. Diagnosis of angiomyolipoma using computed tomography-region of interest < or =–10 HU or 4 adjacent pixels < or =–10 HU are recommended as the diagnostic thresholds. Clin Radiol. 2006; 61:410–16. https://doi.org/10.1016/j.crad.2005.12.013.
6. Simpfendorfer C, Herts BR, Motta-Ramirez GA, Lockwood DS, Zhou M, Leiber M, Remer EM. Angiomyolipoma with minimal fat on MDCT: can counts of negative-attenuation pixels aid diagnosis? AJR Am J Roentgenol. 2009; 192:438–43. https://doi.org/10.2214/AJR.08.1180.
7. Takahashi K, Honda M, Okubo RS, Hyodo H, Takakusaki H, Yokoyama H, Ohsawa T. CT pixel mapping in the diagnosis of small angiomyolipomas of the kidneys. J Comput Assist Tomogr. 1993; 17:98–101. https://doi.org/10.1097/00004728-199301000-00018.
8. Catalano OA, Samir AE, Sahani DV, Hahn PF. Pixel distribution analysis: can it be used to distinguish clear cell carcinomas from angiomyolipomas with minimal fat? Radiology. 2008; 247:738–46. https://doi.org/10.1148/radiol.2473070785.
9. Kim JK, Kim SH, Jang YJ, Ahn H, Kim CS, Park H, Lee JW, Kim S, Cho KS. Renal angiomyolipoma with minimal fat: differentiation from other neoplasms at double-echo chemical shift FLASH MR imaging. Radiology. 2006; 239:174–80. https://doi.org/10.1148/radiol.2391050102.
10. Davenport MS, Neville AM, Ellis JH, Cohan RH, Chaudhry HS, Leder RA. Diagnosis of renal angiomyolipoma with hounsfield unit thresholds: effect of size of region of interest and nephrographic phase imaging. Radiology. 2011; 260:158–65. https://doi.org/10.1148/radiol.11102476.
11. Helenon O, Merran S, Paraf F, Melki P, Correas JM, Chretien Y, Moreau JF. Unusual fat-containing tumors of the kidney: a diagnostic dilemma. Radiographics. 1997; 17:129–44.
12. Hélénon O, Chrétien Y, Paraf F, Melki P, Denys A, Moreau JF. Renal cell carcinoma containing fat: demonstration with CT. Radiology. 1993; 188:429–30. https://doi.org/10.1148/radiology.188.2.8327691.
13. Schuster TG, Ferguson MR, Baker DE, Schaldenbrand JD, Solomon MH. Papillary renal cell carcinoma containing fat without calcification mimicking angiomyolipoma on CT. AJR Am J Roentgenol. 2004; 183:1402–04. https://doi.org/10.2214/ajr.183.5.1831402.
14. Lesavre A, Correas JM, Merran S, Grenier N, Vieillefond A, Hélénon O. CT of papillary renal cell carcinomas with cholesterol necrosis mimicking angiomyolipomas. AJR Am J Roentgenol. 2003; 181:143–45. https://doi.org/10.2214/ajr.181.1.1810143.
15. Strotzer M, Lehner KB, Becker K. Detection of fat in a renal cell carcinoma mimicking angiomyolipoma. Radiology. 1993; 188:427–28. https://doi.org/10.1148/radiology.188.2.8327690.
16. Hammadeh MY, Thomas K, Philp T, Singh M. Renal cell carcinoma containing fat mimicking angiomyolipoma: demonstration with CT scan and histopathology. Eur Radiol. 1998; 8:228–29. https://doi.org/10.1007/s003300050367.
17. D’Angelo PC, Gash JR, Horn AW, Klein FA. Fat in renal cell carcinoma that lacks associated calcifications. AJR Am J Roentgenol. 2002; 178:931–32. https://doi.org/10.2214/ajr.178.4.1780931.
18. Chowdhury PR, Tsuda N, Anami M, Hayashi T, Iseki M, Kishikawa M, Matsuya F, Kanetake H, Saito Y. A histopathologic and immunohistochemical study of small nodules of renal angiomyolipoma: a comparison of small nodules with angiomyolipoma. Mod Pathol. 1996; 9:1081–88.
19. Birnbaum BA, Jacobs JE, Ramchandani P. Multiphasic renal CT: comparison of renal mass enhancement during the corticomedullary and nephrographic phases. Radiology. 1996; 200:753–58. https://doi.org/10.1148/radiology.200.3.8756927.
20. Lv P, Lin XZ, Li J, Li W, Chen K. Differentiation of small hepatic hemangioma from small hepatocellular carcinoma: recently introduced spectral CT method. Radiology. 2011; 259:720–29. https://doi.org/10.1148/radiol.11101425.
21. Li M, Zheng X, Li J, Yang Y, Lu C, Xu H, Yu B, Xiao L, Zhang G, Hua Y. Dual-energy computed tomography imaging of thyroid nodule specimens: comparison with pathologic findings. Invest Radiol. 2012; 47:58–64. https://doi.org/10.1097/RLI.0b013e318229fef3.
22. Gupta RT, Ho LM, Marin D, Boll DT, Barnhart HX, Nelson RC. Dual-energy CT for characterization of adrenal nodules: initial experience. AJR Am J Roentgenol. 2010; 194:1479–83. https://doi.org/10.2214/AJR.09.3476.
23. Sung CK, Kim SH, Woo S, Moon MH, Kim SY, Kim SH, Cho JY. Angiomyolipoma with minimal fat: differentiation of morphological and enhancement features from renal cell carcinoma at CT imaging. Acta Radiol. 2016; 57:1114–22. https://doi.org/10.1177/0284185115618547.
24. Yan L, Liu Z, Wang G, Huang Y, Liu Y, Yu Y, Liang C. Angiomyolipoma with minimal fat: differentiation from clear cell renal cell carcinoma and papillary renal cell carcinoma by texture analysis on CT images. Acad Radiol. 2015; 22:1115–21. https://doi.org/10.1016/j.acra.2015.04.004.
25. Sun H, Xue HD, Liu W, Wang Y, Zhao WM, Jin ZY. [Perfusion characteristics of renal mass with 64-slice spiral computed tomography]. [Article in Chinese]. Zhongguo Yi Xue Ke Xue Yuan Xue Bao. 2008; 30:680–5.
26. Chen Y, Zhang J, Dai J, Feng X, Lu H, Zhou C. Angiogenesis of renal cell carcinoma: perfusion CT findings. Abdom Imaging. 2010; 35:622–28. https://doi.org/10.1007/s00261-009-9565-0.
27. Gigli F, Zattoni F, Zamboni G, Valotto C, Bernardin L, Mucelli RP, Zattoni F. [Correlation between pathologic features and perfusion CT of renal cancer: a feasibility study]. [Article in Italian]. Urologia. 2010; 77:223–31.
28. MacLennan GT, Bostwick DG. Microvessel density in renal cell carcinoma: lack of prognostic significance. Urology. 1995; 46:27–30. https://doi.org/10.1016/S0090-4295(99)80153-8.
29. Miles KA. Tumour angiogenesis and its relation to contrast enhancement on computed tomography: a review. Eur J Radiol. 1999; 30:198–205. https://doi.org/10.1016/S0720-048X(99)00012-1.
30. Hung SW, Kinouchi T. Is higher contrast-enhancement on post-contrast CT image enough to make the differential diagnosis between AML and RCC? Int J Clin Oncol. 2004; 9:139–41. https://doi.org/10.1007/s10147-003-0367-z.
31. Anderson NG, Butler AP, Scott NJ, Cook NJ, Butzer JS, Schleich N, Firsching M, Grasset R, de Ruiter N, Campbell M, Butler PH. Spectroscopic (multi-energy) CT distinguishes iodine and barium contrast material in MICE. Eur Radiol. 2010; 20:2126–34. https://doi.org/10.1007/s00330-010-1768-9.
32. Johnson TR, Krauss B, Sedlmair M, Grasruck M, Bruder H, Morhard D, Fink C, Weckbach S, Lenhard M, Schmidt B, Flohr T, Reiser MF, Becker CR. Material differentiation by dual energy CT: initial experience. Eur Radiol. 2007; 17:1510–17. https://doi.org/10.1007/s00330-006-0517-6.