

INTRODUCTION
Colorectal cancer (CRC) is the most common gastrointestinal tumor. In United States, there are almost 130,000 new cases and about 56,000 CRC patients died each year. CRC is the second cause of cancer death. In China, there are more than 1 million new cases of CRC each year [1, 2]. It is the third most common malignant tumors of in males and the second most common malignant tumors in females [3]. 25% of the patients at the time of diagnosis had surgery; and 5-year survival rate was around 63.4%. 50% of the patients died with recurrence and metastasis after radical surgery in studies performed on 2009 and 2010 [4–5]. In recent years the emergence of molecular targeted therapy has been employed for the treatment of a wide variety of tumor including CRC. The mutated BRAF gene has become increasingly popular for targeted therapy. Even though surgery is still with the main treatment option, but in 2009, NCCN has approved the BRAF targeted therapy with cetuximab and panitumumab monoclonal antibody for CRC personalized therapy. BRAF mutated patients with metastatic colorectal cancer (mCRC) herald poor prognoses. In cases of BRAF mutation, even if KRAS is not mutated, the patients are still resistant to anti EGFR therapies and, the overall survival (OS) is lower than the patients with wild type BRAF. Therefore, it is necessary to evaluate the status of BRAF in CRC patients.
Recently, many studies had shown that there was cancer stem cells (CSC) are present in the tumor and CD133 was recognized as the best CRC stem cell markers [6]. CSCs were thought to be associated with the prognosis and metastasis of the tumors. Currently popular hypothesis is that CSC markers such as CD133 was associated with the number of CSCs in tumors, and also related to the prognosis of the patients. In order to get a better postoperative adjuvant chemotherapy scheme, reliable predictor had been widely investigated [7, 8]. The signaling pathways mutation and the protein expression levels of CSC markers were believed as the good candidates to predict the prognosis [9]. CD133, because of its high mRNA expression and detection by immunohistochemistry had been used as the separate prognostic marker of CRC [10]. Recent studies suggested that high expression level of CD133 is associated with KRAS and BRAF mutation [11]. The large number of CRC samples combined with CD133 and mutated BRAF protein expression in the tissue chip is less reported in both at China and abroad. This study collected 376 cases with complete pathologic and clinical data from Fuzhou General Hospital at Nanjing Military Region of Chinese People's Liberation Army (PLA) from 2004 to 2010. We used tissue microarray technique and immunohistochemical staining method to detect the expression of CD133 and mutated BRAF protein. We also selected 126 positive cases and 20 negative samples of BRAF using direct sequencing method to verify BRAF mutation. The purpose of the study is to explore the relationship between BRAF protein expression, gene mutation and clinicopathological parameters and prognosis of CRC patients; as well as the relationship between BRAF mutation and CD133 expression. The aims are to provide the scientific basis for judging the prognosis and personalized therapy of CRC.
RESULTS
Tissue microarray
We made 36 array blocks, each contained 7X7 cores. There was mostly no cracking phenomenon; no shift of orderly core and integrity of the entire array block. (Figure 1). We only found two slightly different cores (about 3%) which visible dot is missing under the conventional H&E staining which was much less than 15-30% reported in the literature [12].
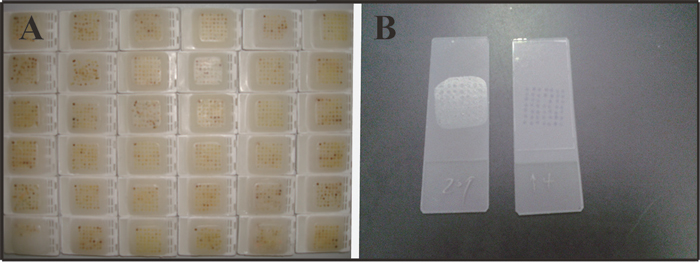
Figure 1: We made 36 array blocks, each contained 7X7 cores (A), sections were complete, no cracking, and no shift (B).
There were no invalid tissues with microscopic examination. CD133 and mutated BRAF positive signal positioned at cell membrane and cytoplasm respectively. Compared with the conventional section with tissue microarray, the coincidence rate was as high as 93%; the two Kappa coefficients were0.714, and 0.700 (Table 1). The results showed that there was a high coincidence rate in both CD133 and BRAF immunohistochemistry (Table 1).
Table 1: CD133 and BRAF conventional slice and tissue chip results in immunohistochemistry
TMA |
paraffin section |
consistency |
inconsistent |
Coincidence |
Kappa |
|
|---|---|---|---|---|---|---|
Positive |
Negative |
|||||
CD133 |
||||||
Positive |
17 |
1 |
28 |
2 |
93% |
0.714 |
Negative |
3 |
9 |
||||
BRAF |
||||||
Positive |
18 |
2 |
28 |
2 |
93% |
0.700 |
Negative |
2 |
8 |
||||
CD133 expression and tumor biological behavior
Expression of CD133 in tissue microarray showed in Figure 2. CD133 positive staining was mainly located in cell membrane (Figure 2); and in part of the the basement membrane. The localization of CD133 was in chips (A1 and A2), high expression (B1 and B2), and low expression (B3). There was no CD133 protein expression in the adjacent intestinal mucosa, (C). Our experiment found that there was not uniform distribution of CD133 in the tumor nests, but the positive staining gathered around the nests or among multiple nests (B1 and B2). Some glandular cavity structure around the cancer cells was showed a lower expression of CD133 (B1-B3). There was no CD133 protein expression in the adjacent intestinal mucosa, (C).
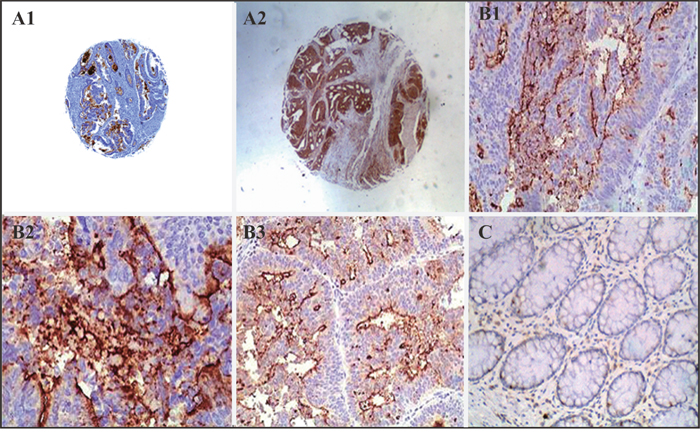
Figure 2: CD133 immunohistochemistry. The localization of CD133 was in chips (A1 and A2), high expression (B1 and B2), low expression (B3). There was no CD133 protein expression in the adjacent intestinal mucosa (C).
CD133 and clinically relevant index analysis showed that high expression of CD133 was associated to the tumor differentiation and lymph node metastasis (P < 0.05). There was no correlation with the patient's gender, age, tumor size and infiltration depth (P > 0.05) (Table 2).
Table 2: Correlation between CD133 expression and clinicopathological factors in colorectal cancer
Variable |
n |
High |
Low |
High positive rate |
P value |
|---|---|---|---|---|---|
Gender |
|||||
Male |
158 |
45 |
113 |
28.4% |
0.313 |
Female |
218 |
73 |
145 |
33.4% |
|
Age |
|||||
<60 year old |
170 |
50 |
120 |
29.4% |
0.503 |
≥60 year old |
206 |
68 |
138 |
33.0% |
|
Tumor location |
|||||
Colon |
275 |
80 |
195 |
29.0% |
0.132 |
Rectal |
101 |
38 |
63 |
37.6% |
|
Tumor size |
|||||
<5 |
206 |
62 |
144 |
30.0% |
|
≥5 |
170 |
56 |
114 |
32.9% |
0.578 |
T category |
|||||
T1+T2 |
135 |
35 |
100 |
25.9% |
0.105 |
T3+T4 |
241 |
83 |
158 |
34.4% |
|
Tumor grade |
|||||
Well moderate |
271 |
70 |
201 |
25.8% |
<0.01* |
Poor |
105 |
48 |
57 |
45.7% |
|
UICC stage |
|||||
0+I+II |
212 |
58 |
154 |
27.3% |
0.057 |
III, IV |
164 |
60 |
104 |
36.1% |
|
N category |
|||||
N0 |
223 |
56 |
165 |
25.7% |
|
N1 |
98 |
40 |
58 |
40.8% |
0.014* |
N2 |
55 |
20 |
35 |
36.3% |
In this study, we totally followed 146 patients, 92 cases with high level CD133 expression, and 54 cases with low level CD133 expression. The median follow-up time was 44 months (3 ~ 95 months), of which 92 cases (63.0%) had more than 3 years follow-up. The average survival time was 60.5 months, and the overall median survival time was 56.0 months. The average survival time in the patients with high level CD133 expression was 47.4 months, but average survival time in the patients with low levels of CD133 expression was 62.7 months, the median survival time was 56.0 months. 3 year survival rate of the low level CD133 expression group was higher than the high level CD133 expression group (93.6% vs 76.8%), (Figure 3A).
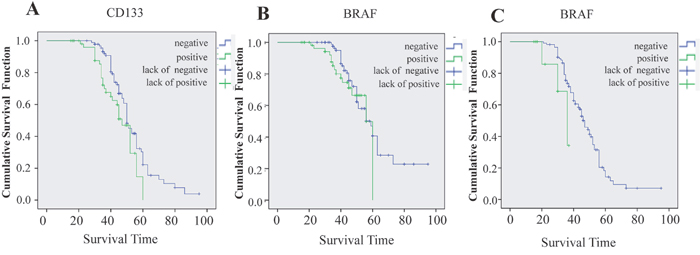
Figure 3: The survival curve is significantly different between high expression and low expression of CD133 (A, P=0. 041); but the survival curve is not significantly different between high and low expression of BRAF (B, P=0.349); the BRAF mutation is significant affected the survival curve (C, P = 0.044).
BRAF expression and tumor biological behavior
BRAF is a cytoplasmic stain. There were obvious differences among the different tumors with various degrees of differentiation (Table 3). The positive expression rate in the well differentiated tumors was 62.5% (Table 3, Figure 4A1-A2); in the moderately differentiated carcinoma was 73.5% (Table 3, Figure 4B1-B3), and in the poorly differentiated carcinoma was 81.9%, (Table 3). BRAF high expression in colon cancer and lower expression were shown in the Figure 4D and 4E, respectively, there was no BRAF protein expression in the adjacent intestinal mucosa, (Figure 4C).
Table 3: Correlation between BRAF protein expression and clinicopathological factors in colorectal cancer
Variable |
n |
expression grade |
Positive rate |
High positive rate |
P value |
|||
|---|---|---|---|---|---|---|---|---|
- |
+ |
++ |
+++ |
|||||
Gender |
||||||||
Male |
158 |
70 |
30 |
30 |
28 |
55.6% |
36.7% |
0.177 |
Female |
218 |
80 |
50 |
40 |
48 |
63.3% |
40.3% |
|
Age |
||||||||
<60 year old |
170 |
80 |
18 |
25 |
47 |
52.9 % |
42.3% |
0.976 |
≥60 year old |
206 |
70 |
62 |
45 |
29 |
66.0 % |
35.9% |
|
Tumor size |
||||||||
≥5cm |
170 |
88 |
31 |
25 |
26 |
48.2% |
30.0% |
0.634 |
<5cm |
206 |
62 |
49 |
45 |
50 |
69.9% |
46.1% |
|
T category |
||||||||
T1~T2 |
135 |
61 |
20 |
28 |
26 |
54.8% |
40.0% |
0.409 |
T3~T4 |
241 |
89 |
60 |
42 |
50 |
63.0% |
38.1% |
|
Tumor grade |
||||||||
Well |
120 |
45 |
25 |
35 |
15 |
62.5% |
41.6% |
|
moderate |
151 |
80 |
19 |
20 |
32 |
47.0% |
34.4% |
<0.001* |
Poor |
105 |
25 |
36 |
15 |
29 |
76.1% |
41.9% |
|
UICC stage |
||||||||
0+I+II |
212 |
95 |
20 |
38 |
59 |
55.1% |
45.7% |
0.283 |
III, IV |
164 |
55 |
60 |
32 |
17 |
66.4% |
29.8% |
|
N category |
||||||||
N0 |
200 |
112 |
28 |
25 |
35 |
44.0% |
30.0% |
|
N1 |
108 |
32 |
16 |
26 |
34 |
70.3% |
55.6% |
<0.001* |
N2 |
68 |
6 |
36 |
19 |
7 |
91.1% |
38.2% |
|
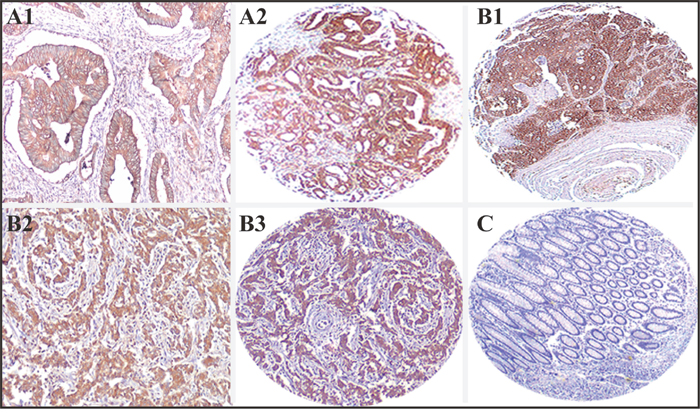
Figure 4: BRAF immunohistochemistry. The localization of BRAF was in high expression at high differentiation CRC (A1 and A2), in high expression at mediated differentiation CRC (B1), in high expression (2+) at low differentiation CRC (B2 and B3). There was no BRAF protein expression in the adjacent intestinal mucosa, (C).
The high BRAF expression rate was 38.8%. There was correlation with differentiation, and lymph node metastasis correlation (P < 0.001); but no correlation with age, sex, tumor location, size and infiltration depth (P > 0.05). The relationship between BRAF expression level and clinicopathological parameters was shown in Table 3.
In this part, we also followed 146 patients, 88 cases with low level BRAF expression, and 58 cases with high level BRAF expression. The median follow-up time was 44 months (3 ~ 95), of which 73 cases (50%) had more than 3 years follow-up. The average survival was 60.5 months, and the median overall survival time was 59.0 months. The average survival in the high BRAF expressors was 51.5 months, but average survival time in low BRAF expressers was 61.9 months, the median survival time was 59.0 months (Figure 3B). Three years of survival rate in the patients with low level BRAF expression was higher than in the patients with low levels of BRAF expression (82.6% vs 96.2%), but there the difference was not statistically significant (P > 0.05).
Relationship between CD133 and BRAF
The correlation between expression level of CD133 and BRAF had been studied with Sperman analysis. The results showed that CD133 positively was related to the BRAF protein expression (r = 0.505, P < 0. 01) (Table 4).
Table 4: CD133 and BRAF
CD133 protein |
total |
Spearman |
||
|---|---|---|---|---|
High expression |
low expression |
|||
BRAF protein |
||||
Positive |
149 |
45 |
194 |
0.505 |
Negative |
48 |
134 |
182 |
|
BRAF mutation and tumor biological behavior
146 cases of BRAF positive (by IHC) and 20 cases of BRAF negative samples were used to identify BRAF gene mutations. The PCR primers (Data not show, exon11 (1000bp, data not show), and exon15 (1500bp, data not show) PCR products, mutated gene sequencing results (Figure 5) were showed respectively.
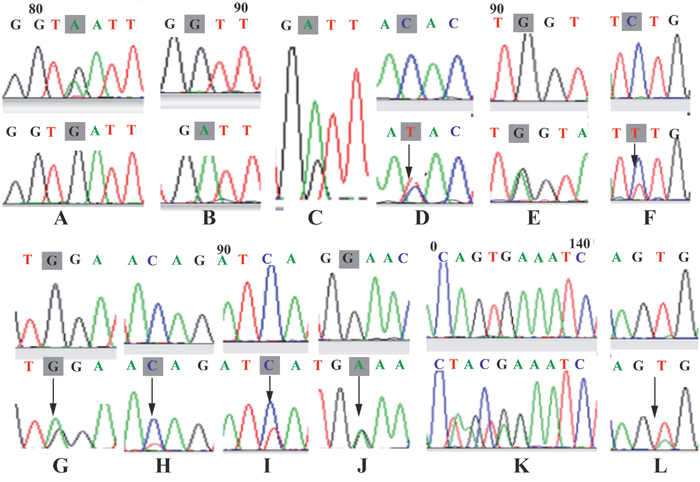
Figure 5: The missense mutation in exon15 in 39th base from G to A (1780 G > A); (A) in exon15 in 40th base from A to G (1781 A > G); (B and C) in exon15 in 115th base from G to A (1856 G > A); (D) in exon15 in 58-60 base of TGA deletion (1799-1801 del TGA); (E) in exon15 in 58th base from T to A (1799 T > A); (F) in exon11 in 5th base from C to T (1319 C > T); (G) in exon11 in 10th base from G to A (1324 G > A); (H) in exon11 in 80th base from C to T (1394 C > T); (I) in exon11 in 59th base from C to T (1373 C > T); (J) in exon11 in 86th base from C to T (1400 C > T); (K) in exon11 in 92th base from G to A (1406 C > T) (L).
We totally tested 146 cases (101 cases of high level BRAF expression, 45 cases of low level BRAF expression of CRC patients for BRAF gene mutation (Figure 6). Total mutation rate was 7.5% (11/146). Mutation rate in women was 8.8% (3/34), and was higher than that of male patients 7.1% (8/112), but the difference was not statistically significant difference (P > 0.718). There was not obvious correlation (P > 0.05) between BRAF gene mutation and age. In the total of 146 samples, 142 cases of the tumors were colon cancer and; 4 cases were rectal cancer. The BRAF gene mutation rate was 7.7% (11/142) in colon cancer. The BRAF gene mutation rate was 3.8% (2/52) in the right colon cancer which was significantly lower than 10% (9/90) the left colon cancer, but the difference was not statistically significant difference (P > 0.05). No BRAF mutation was detected in the rectal cancers (Table 5).
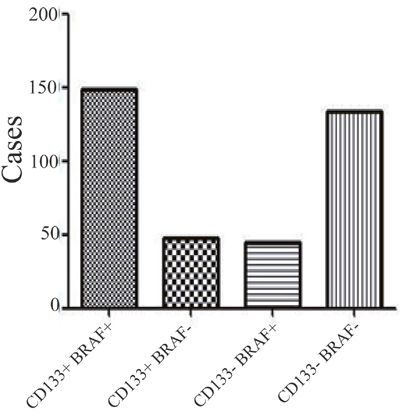
Figure 6: CD133 mutated BRAF high expression and low expression group of related control chart.
Table 5: Correlation between BRAF gene mutations and clinicopathological factors in colorectal cancer
Variable |
n |
mutation cases |
mutation rate |
P value |
|---|---|---|---|---|
Gender |
||||
Male |
112 |
8 |
7.1% |
0.718 |
Female |
34 |
3 |
8.8% |
|
Age |
||||
<60 year old |
67 |
3 |
4.4% |
0.227 |
≥60 year old |
79 |
8 |
10.1% |
|
Tumor location |
||||
Right hemicolon |
52 |
2 |
3.8% |
0.328 |
Left hemicolon |
75 |
9 |
10% |
|
Rectal |
19 |
0 |
0 |
|
UICC stages |
||||
0+I+II |
96 |
4 |
4.1% |
0.046* |
III, IV |
50 |
7 |
14% |
|
N category |
||||
N0 |
95 |
4 |
4.2% |
|
N1 |
33 |
5 |
15.1% |
0.08 |
N2 |
18 |
2 |
11.15 |
|
Distant metastasis |
||||
M0 |
122 |
9 |
7.3% |
0.661 |
M1 |
24 |
2 |
8.3% |
We followed 146 patients. The median follow-up time 44 months (3 to 95 months), of which 73 cases were followed up for more than 3 years, the average survival time was 48.6 months, the overall median survival time was 46.0 months. Patients with BRAF mutation had the average survival of 33.0 months and the median survival of 36.0 months. The average survival was 49 months in patients with wild type BRAF and the median survival was 47.0 months (Figure 3C). Three years survival rate in the BRAF mutated group was much lower than the BRAF wild type group (34.3% vs 73.6%, P < 0.05).
The relationship between BRAF expression level and BRAF gene mutation on CRC survival was analyzed. We found that survival time in the patients with high level of BRAF protein expression and gene mutations were significantly lower than the BRAF negative and wild type patients. Using statistical consistency analysis found that for both Kappa value was 0.177 (Table 6).
Table 6: BRAF protein and BRAF gene mutations
BRAF protein |
total |
Kappa |
||
|---|---|---|---|---|
Positive |
Negative |
|||
BRAF protein |
||||
Positive |
10 |
1 |
11 |
0.177 |
Negative |
85 |
50 |
135 |
|
DISCUSSION
Tissue Array is a method of relocating multiple tissues from conventional histologic paraffin blocks so that tissues from multiple patients can be seen on a same slide which is a kind of high flux of variety of analysis tools. We made 36 array blocks, each contained 7X7 cores. Because it can simultaneously detect multiple samples in same slide, it would be much easier to perform large-scale retrospective studies. Although its accuracy and feasibility are still concerning, in here we found no cracking phenomenon; no shift of orderly core and no invalid tissues under the microscopic observation. The exception in two slightly different cores (about 3%). Our results are much less than 15-30% reported in the literature.
The number of cancer stem cells was different in the different tumor with different grads. CSC can drive tumor growth and metastasis. A transmembrane protein CD133 can be used to identify the CSC. CD133 is a glycoprotein that is also known in humans and rodents as Prominin 1 (PROM1) [13]. It is a member of pentaspan transmembrane glycoproteins (5-transmembrane, 5-TM), which specifically localize to cellular protrusions. CD133 is expressed in hematopoietic stem cells [14], endothelial progenitor cell [15], glioblastoma, neuronal and glialstem cells [16], various pediatric brain tumors [17], as well as adult kidney, mammary glands, trachea, salivary glands, placenta, digestive tract, testes, and some other cell types [18, 19]. Recent studies in brain tumors have identified a CD133+ cell population which is believed to be a cancer stem cell population. These cells can undergo self-renewal and differentiation, and can propagate tumors when injected into immune-compromised mice [20, 21]. However, subsequent studies showed difficulty in isolating pure CSC populations [22].
CD133 is the only CSC molecule that is associated with prognosis. N- glycosylation of CD133 can affect the identification of cell surface CD133 [23]. Kemper et al [24] found the samples with low, medium and high CD133 expression by gene chip have strongly CD133 immunofluorescence in most tumor cells in patients. So the expression of CD133 level has nothing to do with the number of CSC. CD133, moreover, because of its high mRNA expression and detection by IHC could indicate relapse-free/total number of survival index, and could serve as the prognosis biomarkers. Because CD133 molecules can tag CSC, so the expression of CD133 positive is thought to be associated with more CSC, more carcinogenicity and/or metastasis [24, 25]. However, differentiated cells can also expressCD133 mRNA and protein.
About the relationship between the expression of CD133 and tumor biological behavior, studies have shown that higher level of CD133 expression indicated lower level of tumor cell differentiation. The expression of CD133 is inversely proportional with the degree of tumor differentiation; it may also illustrate that the higher level CD133 expression associates with poorer prognosis. Some studies showed that CD133 is an independent factor which plays important role in the prognosis. The survival of patients with higher level CD133 expression was significantly lower than those with lower level of CD133 expression. There are other researchers that showed there was no correlation between the expression of CD133 levels and survival. Shmelkov et al [26] showed that CD133 expression is not necessarily limited to the surface of stem cells, and either CD133 positive expression or negative cells in colorectal cancer liver metastases can cause tumorigenesis.
Our study further analyzed the characteristics and clinical pathological index of CRC patients. We found that there was no correlation between the expression levels of CD133 and patient's age, sex, tumor size, invasion depth, TNM stage. But the levels were associated with the degree of differentiation and lymph node metastasis which may relate to aggressiveness and metastasis abilities of the tumors. In addition, we followed 146 patients’ survival situation, and found that there was significant correlation (P < 0.01) between the level of CD133 expression and the prognosis. 3 years survival rate (72.6%) in high level CD133 expression group was significantly worse than then low level CD133 expression group (86.6%). This result showed the patients with high level of CD133 expression had poor prognoses. These results are consistent with the reported literature [26].
Kemper et al [27] reported 90 cases of AMC-AJCC stage II CRC patients and found that there was significant correlation between the high level CD133 expression and tumor metastasis (P = 0.026) and local recurrence (P = 0.017), but not with the gender, age, differentiation grade, the location of the tumor which were consistent with our results.
CD133 as a CSC marker has become a CRC prognosis indicators. The level of CD133 expression may correlates with CSC number and can be used to predict the disease progression. Our survival analysis data showed that survival in the patients with high level CD133 expression was lower than that in patients with lower expression. However, recent studies suggested that CD133 mRNA and protein in the tumor differentiation process of CSC is not reduced in colorectal cancers. More important is that high level CD133 expression is associated with KRAS and BRAF mutations. Inhibition of KRAS mutations or its downstream MEK signaling pathway can reduce CD133 expression. In RAS - RAF - MEK - ERK signaling pathways, the activation is associated with CD133 expression level in colorectal tumors. Based on the fact that the KRAS or BRAF mutations were associated with poor prognosis, we may conclude that CD133 does not represent the CSC number but is correlated with RAS-RAF mutations [24].
Our data showed that BRAF was associated with CD133 positive by Spearman correlation analysis (r = 0.505). On the other hand, different immunohistochemical staining methods may lead to completely different CD133 results. The folding nuances of CD133 molecular in the surface of CSC are affected by the impact of glycosylation and the surface of AC133 epitope accessibility [28]. It may also explain the reason that CD133 positivity in our tumor cells were not evenly dispersed in nests.
BRAF is activated by the upstream of the RAS protein kinase such as MAPK pathway of serine/threonine protein kinase. This kinase is an important transduction factor of RAS - RAF - MEK - ERK MAPK signaling pathways conducts from RAS signal transduction to MEK1/2. BRAF is the key of MEK/ERK activation factor in human solid tumors. BRAF gene mutation rate is about 8%, originally found in malignant melanoma, followed by papillary thyroid cancer, colorectal cancer [24, 29].
The purpose of this research was to combine immunohistochemical and genetic testing method to know BRAF expression and mutation in Chinese CRC patients. Through analysis of 376 cases of CRC result showed that the BRAF positive expression rate was 60.1%. The expression level of BRAF protein related to tumor differentiation and lymph node metastasis (P < 0. 05). This result may be related to BRAF can increase the ERK activity. ERK phosphorylation can activate p90RsK, inactivating the apoptosis, or activating cAMP, and CREB which affect the cell apoptosis and promote the proliferation and invasion of CRC. It can also increase VEGF and epidermal growth factor receptor (ErbBs) expression, promote angiogenesis and the process of invasion and metastasis of tumor tissue [24, 30–32]. There was no relationship between BRAF expression and the patient's gender, age, tumor size and infiltration depth; likely that BRAF is mainly associated with the differentiation and metastasis of CRC but not the infiltration.
Davies et al [29] reported about 15% of the BRAF gene mutation in the colon cancer. There are two main mutation types, one (about 11%) is located in exon11 of the glycine loop, and the common types are G465, G468 point mutations. Another (about 89%) is located in the exon15 activation region, 1799 nucleotides T mutation (namely V600E mutation), glutamic acid to valine. This mutation affects the activity of phosphate kinase of the MAPK signaling pathways. There were 60-70% P53 mutations or loss of p563, 40% K-Ras mutation and 5-10% B-Raf mutation in CRC patients [33, 34]. B-Raf is directly located at the downstream of the Ras, V600 mutation can lead to the Ras-Raf-MEK-ERK pathway abnormal activation.
Matthew et al [33] reported 56 cases BRAF mutation in their 475 cases of CRC (12%). The results showed that there was statistically significant difference between mutation and wild type, such as age (66 VS 75, P < 0.004); Gender (44% VS 71%, P < 0.001); the proximal tumor (44% VS 95%, P < 0.001) and microsatellite instability gene frequency (16% VS 76%, P < 0.001). In terms of tumor grade, there was no significant difference between BRAF mutation and wild type. Phipps et al [35] investigated 1980 CRC patients, they found 247 cases BRAF mutation, and the mutation rate was 12%. Nakanishi et al [36] used direct sequencing method studied 254 CRC patients, they found the KRAS, BRAF mutation rate was 33.5% and 6.7%. In this study, we found there were13 cases of mutations in 146 cases of CRC, the mutation rate was 8.9%, 7 cases had the mutation in exon15 and 6 cases in exon11; the most common exon15 mutation sites was located in 1799 (V600E), consistent with the literature reported.
In terms of prognosis, accumulation literature showed that metastatic CRC have a relatively poor prognosis. BRAF mutations indicated that there were decreased overall survival and progression-free survival. Hutchins et al [37] reported BRAF mutation was not affected the recurrence, and chemotherapy response in patients with stage II patients. Samowitzet al [38] results showed that the BRAF mutation of microsatellite stability was associated with poor prognosis. Roth et al [39] clinical trials found BRAF mutations were associated with patients' overall survival, but due to the small sample size and they didn’t reach a conclusion. Hutchins et al [40] clinical trials met the same problem; the trend of BRAF mutation associated with poor prognosis, but was difficult to reach statistical significance. Ogino et al [41] reported BRAF mutations were associated with tumor specific mortality, and microsatellite stability had a better prognosis. Similar to KRAS mutations, one can consider the use of EGFR treatment in metastatic cancer patients but should also detect BRAF mutation. KRAS mutations were more common than BRAF mutations. If the KRAS is wild-type, one should consider the possibility of BRAF mutation. It is more likely to detect the mutation in metastatic tumor tissue, because metastatic tumor may have different molecular spectra. Our experiment was based on the comprehensive analysis of BRAF protein and BRAF gene mutation respectively. We found that the survival in BRAF protein positive and gene mutation was significantly lower than the survival in BRAF IHC negative patients with wild type BRAF. But the consistency analysis (Kappa) between the positive BRAF by IHC and the presence of gene mutation was r=0.176. This showed that there was no consistency between the BRAF protein expression and gene mutation in CRC. Although survival in the BRAF protein positive and gene mutations was significantly lower than the survival in the BRAF negative and wild type, but BRAF gene mutation showed significant statistical difference (P = 0.044) and there was no significant difference (P > 0.05) between BRAF protein positive and negative (by IHC). Combined with the two methods, we believe that the BRAF gene sequencing is more important in the CRC.
As tumor molecular biology and genetics development, predictor targeted therapy and molecular targeted therapy have been gradually used in the clinical settings. The main targeted drugs are cetuximab and panitumumab. Cetuximab combined with EGFR inhibitors can inhibit the downstream signal transduction, thus inhibiting the growth of tumor cells. Currently cetuximab has been used in early CRCs. Researchers showed in the presence of BRAF mutation, anti-EGFR treatment would be invalid [42, 43]. 2010 NCCN also confirmed this result, so it was recommended to have BRAF tests for the KRAS wild-type patients before using EGFR monoclonal antibody. In clinical trials by Tveit et al [44] cetuximab combined with fluorouracil/leucovorin and oxaliplatin was used for the previously untreated KRAS and BRAF mutated (metastatic colorectal) mCRC patients. The median of progression free survival (PFS) was 7.9, 8.3 and 7.3 months, and the overall survival (OS) was 20.4, 19.7 and 20.3 months respectively. This regimen did not benefit the KRAS wild-type patients. In 2009 the American society of clinical oncology meeting concluded that the BRAF mutation indicated poor prognosis for the mCRC patients. In Mcrc accompanied with BRAF gene mutation, even in the presence wild type KRAS, patients were resistant to anti EGFR therapy. The patients with BRAF mutation have the possibility of a greater risk of tumor progression than patients with normal BRAF, and overall survival (OS) is also lower. Additional reports showed that Panitumumab can effectively prolong the patient's progression-free survival. 2010 U.S. oncology association suggested that in patients with KRAS wild-type, normal BRAF, Panitumumab combined chemotherapy had longer survival time and better tolerability. The BRAF mutation can be considered to be poor prognostic factor, but not a strong predictor of curative effect. In here, our present study did not include other genetics and molecular targets, but the BRAF mutation itself is directly related to poor prognosis, and is a very practical clinical indicator.
MATERIALS AND METHODS
Clinical data collection
A total of 376 cases of CRC surgical specimens were collected from Fuzhou General Hospital of Nanjing Military Region between January 2004 and April 2010 (Clinical data see Table 2 and 3). H&E sections were made from formalin fixed paraffin embedded specimens and were examined by pathologists. In accordance with Broders criteria, CRC histological grade was divided into: well differentiated, moderately differentiated, poorly differentiated) and undifferentiated carcinomas. TNM staging was referenced to the 2006 version WHO colorectal tumor classification and diagnostic criteria.
Making tissue micro array blocks
Under the microscope, 3 cores of tumor rich tissue, interface of tumor and normal colon and normal colon were marked and selected respectively in each CRC specimen. Melted liquid paraffin of about 62 °C was poured down to design template with same size embedding box. Before the wax blocks became completely solid, we removed the embedding boxes, and they were ready to punch. The perforating depth was 6.0 mm. The cores were slowly introduced to the receptor wax block. 376 from 400 cases of tissue core were placed in a blank wax blocks, each of core wax block contained 7X7cores. In order to identify the orientation of the array, a liver or kidney tissue core was implanted in the upper left quadrant. A set of 36 tissue microarrays (TMAs) was constructed at our Department from the 400 CRC cases. The total effective cases were 376. H&E IHC stains were performed on each core.
Patients’ follow-up
We followed-up for all patients till July 2011 for the presence of recurrence and metastasis and demise. We collected the clinical indicators including gender, age, tumor location, size, TNM clinical stage and the pathological indicators including the tumor grade, and the tumor type. This project was approved by the Fuzhou General Hospital Review Board, and informed consent was obtained from all patients undergoing the procedures prescribed by the hospital ethics committee.
Immunohistochemistry (IHC)
Tissue microarray slides were baked at 62°C for 1 hr, deparaffinized in xylene for 5 min for three changes, and rehydrated in 100%, 95% and 70% ethanol for 5 min each. Antigen retrieval was achieved by steaming slides for 10 min in 10 mM citrate buffer, pH 6.0. Slides were washed three times in PBS and blocked for 1 hour in a buffer containing 10% goat serum in PBS, and incubated overnight at 4°C with mouse anti-human BRAF monoclonal antibody (Santa Cruz, Cat# SC-5284, 1:100 dilution, CA, USA) and rabbit anti human CD133 polycolonal antibody (Dako, Cat# 12145, 1:100 dilution, Denmark). Slides were washed three times in PBS and antigen visualized with Eli Vision kit and DAB as substrate color developing (Maxium, Fujian, China). Slides were counterstained with Harris-modified hematoxylin (Maxium, Fujian, China) and mounted. Positive control sections (purchased from manufactures were treated in the same way; the negative slides were treated with non-immunolized serum to replace the primary antibody.
CD133 interpretation
CD133 is a membranous stain. The results followed Maeda et al [11] the method. The results were reported negative if CD133 positive cells were < 5% and were reported positive if there were, 5% or more of the cells showed positive membranous staining. The scoring was performed as follows: 5% ~ 25% were graded (1+), 25% ~ 50% (2+), and > 50% (3+). The specimens with CD133 of <5% (the negative samples) or the (1+) samples were considered as low expression; and the 2+ and the 3+ samples were considered as high expression. Results scored by 2 pathologists in familiar criteria on the basis of independent score.
BRAF interpretation
BRAF is cytoplasmic stain. If there was no positive cell, the slide was scored 0. If the stain highlighted less than 25% of the cells, the score was 1. If there were positivity between 25% and 50% of the cells, the score was 2. If there were between 50% to 75% positivity, the score was 3 and > 75% was scored 4. The intensity of the stain was also scored as follows: The dark brown stain scored 3, tan color scored 2, pale tan scored 1, and no staining scored 0. The total score of 0 was considered negative (-), and 1 to 4 was considered weakly positive (+), 5 to 8 was considered positive (+ +), and 9 to 12 was considered strongly positive (+ + +). The total score above 5 was designated as high expression, and below 5 points was designated as lower expression. The scores were given by 2 pathologists who were familiar with the scoring system.
BRAF gene mutations
In BRAF protein expression of cases randomly selected 146 cases, 112 males, and 34 females; Aged 39-86, with the average age of 70.97 ± 11.38 (Table 5). 29 cases of BRAF protein expression scored 3+, 53 of them were scored 2+, 44 cases were scored 1+ specimens, and 20 cases were negative. For detection the BRAF gene mutation, polymerase chain reaction (PCR) and sequencing were carried out. DNA was isolated from patient samples by proteinase K digestion. Subsequently, DNA was amplified with PCR using different primer sets (data not show). Direct DNA sequencing was performed using the purified PCR products.
Statistical analysis
Data were analyzed with the Chi-Square test, Student’s t test, Whitney-Mann U test and Kruskal-Wallis H test. Data was expressed as mean ± standard deviation (SD) or percentage (%). A p-value of less than 0.05 was considered statistically significant. All statistical analyses were performed with the Statistical Package for Social Sciences (SPSS, version 20.0, Chicago, IL, USA).
CONCLUSIONS
In summary, we used gene sequencing, tissue chips, H&E and immunohistochemical staining methods to detect colorectal cancer stem cells by the surface marker CD133. We explore the BRAF protein expression and mutations in the CRC and its relationship with clinical pathological indicators. Our results showed that CD133 and BRAF overexpression were related to the degree of tumor differentiation and lymph node metastasis. CD133 and BRAF can be as indices of judging the prognosis of patients with CRC. Higher expression level indicated the worse prognosis.
Although there were inconsistency between immunohistochemical BRAF strong positive expression and the sequencing testing results BRAF gene mutation, IHC preliminary screening method can be used as to evaluate the status of BRAF, in CRC patients, Direct sequencing can provide more reliable results patients seeking targeted therapy.
Author contributions
Guo Y, Yu Y, and Qi X designed the research; Guo Y, Qi X, Liu Y, Zeng D, Wang X and Wang Y performed the research; Yu Y, Luo J and Qi X contributed new reagents/analytic tools; Guo Y, Luo J and Yu Y analyzed the data; Guo Y, and Luo J wrote the paper.
ACKNOWLEDGMENTS AND FUNDING
This work was partially supported by Fuzhou General of Nanjing Military Special Fund Key Research Project Grant 2011-011 and partially through Chinese Natural Science and Technology Foundation 81460022 and New Faculty foundation of Qinghai Provincial People's Hospital (J.M. Luo).
CONFLICTS OF INTEREST
The authors declare that no conflicts of interests exists.
REFERENCES
1. Fang JY, Zheng S, Jiang B, Lai MD, Fang DC, Han Y, Sheng QJ, Li JN, Chen YX, Gao QY. Consensus on the prevention, screening, early diagnosis and treatment of colorectal tumors in China: chinese society of gastroenterology, October 14-15, 2011, Shanghai, China. Gastrointest Tumors. 2014; 1:53–75.
2. Moser L, Ritz JP, Hinkelbein W, Höcht S. Adjuvant and neoadjuvant chemoradiation or radiotherapy in rectal cancer—a review focusing on open questions. Int J Colorectal Dis. 2008; 23:227–36.
3. Tenesa A, Dunlop MG. New insights into the aetiology of colorectal cancer from genome-wide association studies. Nat Rev Genet. 2009; 10:353–58.
4. Zhang Y, Tao M. Comprehensive analysis of 627 patients with colorectal cancer. Sichuan medical. 2010; 3:1260-1262.
5. Kindler HL, Shulman KL. Metastatic colorectal cancer. Curr Treat Options Oncol. 2001; 2:459–71.
6. Pitule P, Cedikova M, Daum O, Vojtisek J, Vycital O, Hosek P, Treska V, Hes O, Kralickova M, Liska V. Immunohistochemical detection of cancer stem cell related markers CD44 and CD133 in metastatic colorectal cancer patients. BioMed Res Int. 2014; 2014:432139–46.
7. Yin AH, Miraglia S, Zanjani ED, Almeida-Porada G, Ogawa M, Leary AG, Olweus J, Kearney J, Buck DW. AC133, a novel marker for human hematopoietic stem and progenitor cells. Blood. 1997; 90:5002–12.
8. Singh SK, Hawkins C, Clarke ID, Squire JA, Bayani J, Hide T, Henkelman RM, Cusimano MD, Dirks PB. Identification of human brain tumour initiating cells. Nature. 2004; 432:396–401.
9. Artells R, Moreno I, Díaz T, Martínez F, Gel B, Navarro A, Ibeas R, Moreno J, Monzó M. Tumour CD133 mRNA expression and clinical outcome in surgically resected colorectal cancer patients. Eur J Cancer. 2010; 46:642–49.
10. Kemper K, Versloot M, Cameron K, Colak S, de Sousa e Melo F, de Jong JH, Bleackley J, Vermeulen L, Versteeg R, Koster J, Medema JP. Mutations in the Ras-Raf Axis underlie the prognostic value of CD133 in colorectal cancer. Clin Cancer Res. 2012; 18:3132–41.
11. Maeda S, Shinchi H, Kurahara H, Mataki Y, Maemura K, Sato M, Natsugoe S, Aikou T, Takao S. CD133 expression is correlated with lymph node metastasis and vascular endothelial growth factor-C expression in pancreatic cancer. Br J Cancer. 2008; 98:1389–97.
12. Iwamoto M, Ahnen DJ, Franklin WA, Maltzman TH. Expression of β-catenin and full-length APC protein in normal and neoplastic colonic tissues. Carcinogenesis. 2000; 21:1935–40.
13. Kononen J, Bubendorf L, Kallioniemi A, Bärlund M, Schraml P, Leighton S, Torhorst J, Mihatsch MJ, Sauter G, Kallioniemi OP. Tissue microarrays for high-throughput molecular profiling of tumor specimens. Nat Med. 1998; 4:844–47.
14. Hemmati HD, Nakano I, Lazareff JA, Masterman-Smith M, Geschwind DH, Bronner-Fraser M, Kornblum HI. Cancerous stem cells can arise from pediatric brain tumors. Proc Natl Acad Sci USA. 2003; 100:15178–83.
15. Galli R, Binda E, Orfanelli U, Cipelletti B, Gritti A, De Vitis S, Fiocco R, Foroni C, Dimeco F, Vescovi A. Isolation and characterization of tumorigenic, stem-like neural precursors from human glioblastoma. Cancer Res. 2004; 64:7011–21.
16. Wang J, Sakariassen PØ, Tsinkalovsky O, Immervoll H, Bøe SO, Svendsen A, Prestegarden L, Røsland G, Thorsen F, Stuhr L, Molven A, Bjerkvig R, Enger PØ. CD133 negative glioma cells form tumors in nude rats and give rise to CD133 positive cells. Int J Cancer. 2008; 122:761–68.
17. Sithanandam G, Kolch W, Duh FM, Rapp UR. Complete coding sequence of a human B-raf cDNA and detection of B-raf protein kinase with isozyme specific antibodies. Oncogene. 1990; 5:1775–80.
18. Sithanandam G, Druck T, Cannizzaro LA, Leuzzi G, Huebner K, Rapp UR. B-raf and a B-raf pseudogene are located on 7q in man. Oncogene. 1992; 7:795–99.
19. Mak AB, Blakely KM, Williams RA, Penttilä PA, Shukalyuk AI, Osman KT, Kasimer D, Ketela T, Moffat J. CD133 protein N-glycosylation processing contributes to cell surface recognition of the primitive cell marker AC133 epitope. J Biol Chem. 2011; 286:41046–56.
20. Guarner J. FDA approves zelboraf (vemurafenib) and companion diagnostic for BRAF mutation-positive metastatic melanoma, a deadly form of skin cancer. Genentech. 2011. https://www.roche.com/media/store/ releases/med-cor-2011-08-17.htm
21. Daum G, Eisenmann-Tappe I, Fries HW, Troppmair J, Rapp UR. The ins and outs of Raf kinases. Trends Biochem Sci. 1994; 19:474–80.
22. Cutler RE Jr, Stephens RM, Saracino MR, Morrison DK. Autoregulation of the Raf-1 serine/threonine kinase. Proc Natl Acad Sci USA. 1998; 95:9214–19.
23. Bollag G, Tsai J, Zhang J, Zhang C, Ibrahim P, Nolop K, Hirth P. Vemurafenib: the first drug approved for BRAF-mutant cancer. Nat Rev Drug Discov. 2012; 11:873–86.
24. Kojima M, Ishii G, Atsumi N, Nishizawa Y, Saito N, Ochiai A. CD133 expression in rectal cancer after preoperative chemoradiotherapy. Cancer Sci. 2010; 101:906–12.
25. Ong CW, Kim LG, Kong HH, Low LY, Iacopetta B, Soong R, Salto-Tellez M. CD133 expression predicts for non-response to chemotherapy in colorectal cancer. Mod Pathol. 2010; 23:450–57.
26. Saigusa S, Tanaka K, Toiyama Y, Yokoe T, Okugawa Y, Kawamoto A, Yasuda H, Morimoto Y, Fujikawa H, Inoue Y, Miki C, Kusunoki M. Immunohistochemical features of CD133 expression: association with resistance to chemoradiotherapy in rectal cancer. Oncol Rep. 2010; 24:345–50.
27. Shmelkov SV, Butler JM, Hooper AT, Hormigo A, Kushner J, Milde T, St Clair R, Baljevic M, White I, Jin DK, Chadburn A, Murphy AJ, Valenzuela DM, et al. CD133 expression is not restricted to stem cells, and both CD133+ and CD133- metastatic colon cancer cells initiate tumors. J Clin Invest. 2008; 118:2111–20.
28. Kemper K, Sprick MR, de Bree M, Scopelliti A, Vermeulen L, Hoek M, Zeilstra J, Pals ST, Mehmet H, Stassi G, Medema JP. The AC133 epitope, but not the CD133 protein, is lost upon cancer stem cell differentiation. Cancer Res. 2010; 70:719–29.
29. De Roock W, Claes B, Bernasconi D, De Schutter J, Biesmans B, Fountzilas G, Kalogeras KT, Kotoula V, Papamichael D, Laurent-Puig P, Penault-Llorca F, Rougier P, Vincenzi B, et al. Effects of KRAS, BRAF, NRAS, and PIK3CA mutations on the efficacy of cetuximab plus chemotherapy in chemotherapy-refractory metastatic colorectal cancer: a retrospective consortium analysis. Lancet Oncol. 2010; 11:753–62.
30. Davies H, Bignell GR, Cox C, Stephens P, Edkins S, Clegg S, Teague J, Woffendin H, Garnett MJ, Bottomley W, Davis N, Dicks E, Ewing R, et al. Mutations of the BRAF gene in human cancer. Nature. 2002; 417:949–54.
31. Wang L, Cunningham JM, Winters JL, Guenther JC, French AJ, Boardman LA, Burgart LJ, McDonnell SK, Schaid DJ, Thibodeau SN. BRAF mutations in colon cancer are not likely attributable to defective DNA mismatch repair. Cancer Res. 2003; 63:5209–12.
32. Oliveira C, Pinto M, Duval A, Brennetot C, Domingo E, Espín E, Armengol M, Yamamoto H, Hamelin R, Seruca R, Schwartz S Jr. BRAF mutations characterize colon but not gastric cancer with mismatch repair deficiency. Oncogene. 2003; 22:9192–96.
33. Nagasaka T, Sasamoto H, Notohara K, Cullings HM, Takeda M, Kimura K, Kambara T, MacPhee DG, Young J, Leggett BA, Jass JR, Tanaka N, Matsubara N. Colorectal cancer with mutation in BRAF, KRAS, and wild-type with respect to both oncogenes showing different patterns of DNA methylation. J Clin Oncol. 2004; 22:4584–94.
34. Kalady MF, Dejulius KL, Sanchez JA, Jarrar A, Liu X, Manilich E, Skacel M, Church JM. BRAF mutations in colorectal cancer are associated with distinct clinical characteristics and worse prognosis. Dis Colon Rectum. 2012; 55:128–33.
35. Phipps AI, Buchanan DD, Makar KW, Burnett-Hartman AN, Coghill AE, Passarelli MN, Baron JA, Ahnen DJ, Win AK, Potter JD, Newcomb PA. BRAF mutation status and survival after colorectal cancer diagnosis according to patient and tumor characteristics. Cancer Epidemiol Biomarkers Prev. 2012; 21:1792-98.
36. Nakanishi R, Harada J, Tuul M, Zhao Y, Ando K, Saeki H, Oki E, Ohga T, Kitao H, Kakeji Y, Maehara Y. Prognostic relevance of KRAS and BRAF mutations in Japanese patients with colorectal cancer. Int J Clin Oncol. 2013; 18:1042–48.
37. Hutchins G, Southward K, Handley K, Magill L, Beaumont C, Stahlschmidt J, Richman S, Chambers P, Seymour M, Kerr D, Gray R, Quirke P. Value of mismatch repair, KRAS, and BRAF mutations in predicting recurrence and benefits from chemotherapy in colorectal cancer. J Clin Oncol. 2011; 29:1261–70.
38. Samowitz WS, Sweeney C, Herrick J, Albertsen H, Levin TR, Murtaugh MA, Wolff RK, Slattery ML. Poor survival associated with the BRAF V600E mutation in microsatellite-stable colon cancers. Cancer Res. 2005; 65:6063–69.
39. Roth AD, Tejpar S, Delorenzi M, Yan P, Fiocca R, Klingbiel D, Dietrich D, Biesmans B, Bodoky G, Barone C, Aranda E, Nordlinger B, Cisar L, et al. Prognostic role of KRAS and BRAF in stage II and III resected colon cancer: results of the translational study on the PETACC-3, EORTC 40993, SAKK 60-00 trial. J Clin Oncol. 2010; 28:466–74.
40. Yaeger R, Cercek A, Chou JF, Sylvester BE, Kemeny NE, Hechtman JF, Ladanyi M, Rosen N, Weiser MR, Capanu M, Solit DB, D’Angelica MI, Vakiani E, Saltz LB. BRAF mutation predicts for poor outcomes after metastasectomy in patients with metastatic colorectal cancer. Cancer. 2014; 120:2316–24.
41. Ogino S, Nosho K, Kirkner GJ, Kawasaki T, Meyerhardt JA, Loda M, Giovannucci EL, Fuchs CS. CpG island methylator phenotype, microsatellite instability, BRAF mutation and clinical outcome in colon cancer. Gut. 2009; 58:90–96.
42. Coppin C, Kollmannsberger C, Le L, Porzsolt F, Wilt TJ. Targeted therapy for advanced renal cell cancer (RCC): a Cochrane systematic review of published randomised trials. BJU Int. 2011; 108:1556–63.
43. Demir L, Somali I, Oktay Tarhan M, Erten C, Ellidokuz H, Can A, Dirican A, Vedat Bayoglu I. The toxicity and efficacy of Nordic-FLOX regimen as adjuvant treatment of stage III colon cancer. J BUON. 2011; 16:682-88.
44. Tveit KM, Guren T, Glimelius B, Pfeiffer P, Sorbye H, Pyrhonen S, Sigurdsson F, Kure E, Ikdahl T, Skovlund E, Fokstuen T, Hansen F, Hofsli E, et al. Phase III trial of cetuximab with continuous or intermittent fluorouracil, leucovorin, and oxaliplatin (Nordic FLOX) versus FLOX alone in first-line treatment of metastatic colorectal cancer: the NORDIC-VII study. J Clin Oncol. 2012; 30:1755–62.