
INTRODUCTION
Liver cirrhosis is the irreversible end stage of liver fibrosis. It is characterized by destruction of the lobular and vascular architecture and nodular regeneration of liver tissue. Fibrosis of liver tissue results in extracellular accumulation of collagen fibers, proteoglycans, and other macromolecules [1]. The progression of liver fibrosis and the development of liver cirrhosis are currently viewed as a dynamic process: With adequate treatment of the primary disease, partial remission of liver fibrosis can even be achieved [2–4]. Tests showing restriction of the liver function early, allow for an adjustment of patient treatment, resulting in slowing or regression of the dynamic fibrosis process.
Liver biopsy is currently the gold standard in clinical practice for detecting and staging liver fibrosis/cirrhosis. However, liver biopsy, as an invasive method, has poor patient acceptance, is susceptible to sampling errors, is subject to interobserver variability, and bears a risk of complications, such as infection and bleeding [5]. The absence of characteristic fibrotic septae and nodular configurations can complicate the histological diagnosis of liver fibrosis/cirrhosis [6]. Moreover, sampling errors can underestimate the severity of the disease [7, 8].
With regard to the image-based diagnosis of fibrosis, abdominal ultrasound should be mentioned in particular. Ultrasound elastography (US-RTE) can be used to measure liver stiffness, thus allowing an indirect assessment of the degree of liver fibrosis [9, 10]. However, the diagnostic value of US-RTE is restricted here by the limited reproducibility and the examiner dependence of the method [11].
In addition to ultrasound imaging, MRI of the liver currently represents the gold standard of diagnostic methods. Recently published studies showed that liver fibrosis/cirrhosis can be characterized by liver MRI using a hepatospecific MR contrast agent [12–15].
Individual studies examined the possibility of using diffusion-weighted MRI examination at 1.5T for the classification of fibrosis [16–19]. We are currently not aware of any study examining the correlation of DWI and ADC values on a 3-Tesla MRI unit with histology.
RESULTS
In total, 62 patients were included in this retrospective study. 16 patients did not show any fibrotic remodeling of the liver parenchyma. 46 patients had a liver parenchyma with fibrotic/cirrhotic remodeling. Table 1 shows the distribution of patients according to Ishak score with the corresponding ADC values.
Table 1: ADC values categorized according to Ishak group
Ishak |
|
N |
Description |
Mean ADC ± SD |
|---|---|---|---|---|
0 |
NLF |
16 |
No fibrosis |
1123 ± 95.8 |
1 |
MLF |
12 |
Fibrosis expansion of some portal areas ± short fibrous septa |
1020 ± 77.8 |
2 |
|
7 |
Fibrosis expansion of most portal areas ± short fibrous septa |
1024 ± 52.2 |
3 |
ALF |
4 |
Fibrosis expansion of most portal areas with occasional portal to portal (P-P) bridging |
1085 ± 109.6 |
4 |
|
7 |
Fibrosis expansion of portal areas with marked portal to portal (P-P) bridging as well as portal to central (P-C) |
959 ± 68.7 |
5 |
|
5 |
Marked bridging (P-P and/or P-C) with occasional nodules (incomplete cirrhosis) |
965 ± 76.9 |
6 |
LC |
11 |
Cirrhosis, probable or definite |
1015 ± 60.2 |
Table 1 shows the corresponding ADC values with their standard deviations categorized on the basis of the individual Ishak values and the defined groups. NLF: no fibrosis, MLF: mild liver fibrosis, ALF: advanced liver fibrosis, LC: liver cirrhosis.
There was a significant difference in the mean ADC value between patients without liver fibrosis (ADC = 1123 ± 95.8 mm2/s) and patients with any stage of liver fibrosis/cirrhosis (ADC = 1010 ± 76.13 mm2/s; p < 0.001) (Figure 1).
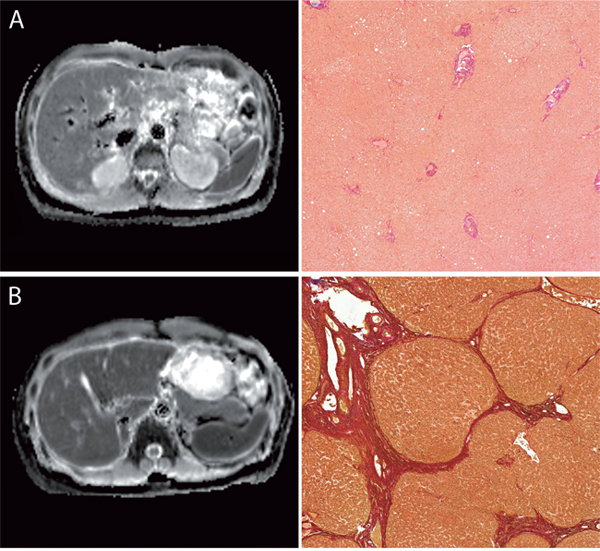
Figure 1: Images comparing the ADC-Maps with corresponding histopathology images with the EVG staining. Figure 1 compares the ADC-Maps with corresponding histopathology from a patient with normal liver parenchyma (A) and from patient with end stage liver fibrosis (B). All images are with the same window level and center. The ADC-value of the liver parenchyma were as follows: (A) no liver fibrosis (Ishak 0), ADC: 859 mm2/s (B) advanced liver fibrosis (Ishak 5), ADC: 1128 mm2/s.
The corresponding ADC values for the individual patient groups were as follows: NLF: 1123 (SD 95.8); MLF: 1032 (SD 77.6); ALF: 962 (SD 68.8); LC: 1015 (SD 60.2) mm2/s (Figure 2). In an adjusted pair-wise comparison (Table 2) a significant difference between patients without liver fibrosis and with mild liver fibrosis (p = 0.036) and between patients with advanced liver fibrosis (p ≤ 0,001) could be observed. No significant difference could be found between the different stages of liver fibrosis/cirrhosis ( p > 0.214) or between patients with without liver fibrosis and patients with liver cirrhosis (p = 0.053).
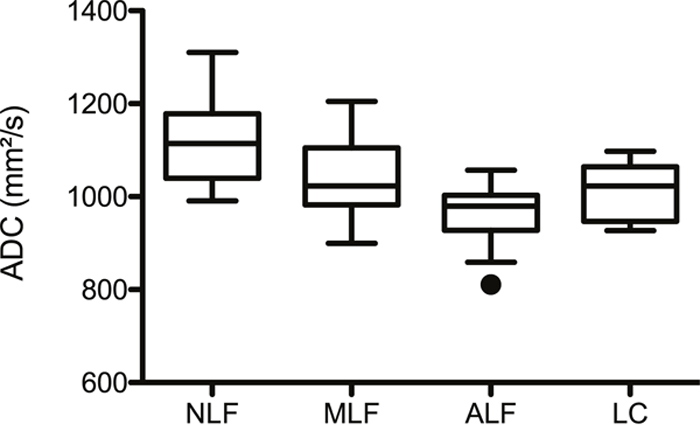
Figure 2: ADC values and liver fibrosis stage. Figure 2 shows box plots of the ADC values distributed according to the different fibrosis/cirrhosis groups. The mean ADC ± Standadart diviation values were as follows: no fibrosis, NLF: 1123 ± 95.8; mild liver fibrosis, MLF: 1032 ± 77.6; advanced liver fibrosis, ALF: 962 ± 68.8; liver cirrhosis, LC: 1015 ± 60.2 mm2/s.
Table 2: Adjusted pair-wise comparison
|
NLF |
MLF |
SLF |
LC |
|---|---|---|---|---|
NLF |
|
≤ 0.001 |
0.036 |
0.053 |
MLF |
≤ 0.001 |
|
0.214 |
0.838 |
SLF |
0.036 |
0.214 |
|
1.000 |
LC |
0.053 |
0.838 |
1.000 |
|
Table 2 shows the corresponding p-values between the defined groups. NLF: no fibrosis, MLF: mild liver fibrosis, ALF: advanced liver fibrosis, LC: liver cirrhosis.
The ROC analysis (Figure 3, Table 3) showed significant cut-off values for the differentiation of Ishak ≥ 1 and Ishak ≥ 3. In the case of an ADC value of 1034, patients without liver fibrosis could be differentiated from patients with liver fibrosis/cirrhosis ≥ Ishak 1 with a sensitivity of 87.5% and a specificity of 69.5%.
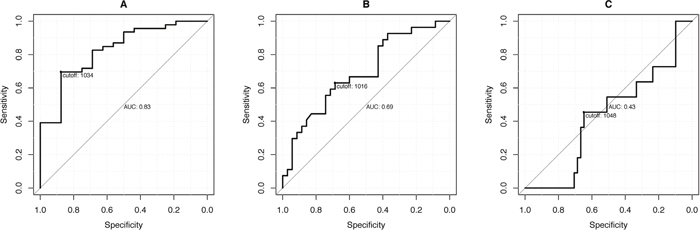
Figure 3: ROC analysis. The graphs show the ROC curves with the corresponding sensitivity and specificity levels of the ADC values for the patient diagnoses (A) (Ishak ≥ 1; cut-off: 1034), (B) (Ishak ≥ 3; cut-off: 1016) and (C) (Ishak ≥ 4; cut-off: 1048).
Table 3: Sensitivity and Specificity of ROC-Analysis
|
Ishak ≥ 1 |
Ishak ≥ 3 |
Ishak = 6 |
|---|---|---|---|
ADC cut-off |
1034 |
1016 |
1048 |
Sensitivity (%) |
87.5 |
68.6 |
64.7 |
Specificity (%) |
69.6 |
63.0 |
45.5 |
AUC (95% CI) |
82.6 (71.0, 94.2) |
69.0 (55.7, 82.4) |
43.1 (25.2, 61.1) |
p-value |
p ≤ 0.001 |
p = 0.002 |
p = 0.478 |
Table 3 show the corresponding sensitivity and specificity levels of the ADC values for the patient diagnoses Ishak ≥ 1 (cut-off: 1034), Ishak ≥ 3 (cut-off: 1016) and Ishak ≥ 4 (cut-off: 1048).
DISCUSSION
The present study was able to show that liver fibrosis affects the mean ADC value of the liver parenchyma. However, it was not possible to differentiate the individual degrees of fibrosis based on the present data.
There is a controversial discussion in the literature regarding the extent to which DWI can be used to differentiate between liver fibrosis and cirrhosis. It has been described that ADC values are significantly lower in patients with liver fibrosis/cirrhosis. Sandrasegaran et al., Taouli et al. and Ayse et al. reported a significant difference in ADC values for different stages of liver fibrosis/cirrhosis [16, 20, 21]. In contrast, studies by Boulanger et al. and Soylu et al. were not able to find a correlation between fibrosis stages and ADC values [17, 22].
As already described, the ADC values of the liver parenchyma were lower in 3T MRI in the case of liver fibrosis/cirrhosis in our study. The individual histological stages of liver fibrosis according to Ishak could not be differentiated from one another on the basis of ADC. However, there was a relevant difference between patients NLF and patients with any stage of liver fibrosis/cirrhosis (MLF + SLF + LC), but this significant difference is mainly effected by the NLF and MLF subgroup, as no significant difference between NLF and LC was observed.
Diffusion-weighted imaging is an MRI method that can also be used for detecting inflammatory/tumoral diseases in the abdomen [23, 24].
Liver fibrosis is characterized by destruction of the lobular and vascular architecture and nodular regeneration of liver tissue. Fibrosis of liver tissue results in extracellular accumulation of collagen fibers, proteoglycans, and other macromolecules [1]. In case of early stage fibrosis, Lee at al. reported that liver parenchyma is often edematous cased by new vessels have leaky interendothelial junctions, resulting in an increased portion of proteins and red blood cells in the extravascular space [25]. This process results in an increased deposition of hepatic water content, hypercellularity and increased ratio of free bound water in the liver parenchyma.
DWI measures the diffusion of water molecules in biological tissues and quantifies the water diffusion processes with the diffusion quotients ADC [26–28]. Theoretically, extracellular collagen fibers, glycosamine, and proteoglycans could inhibit the molecular diffusion of water and thus result in lower diffusion in case of liver fibrosis, especially in early stages [26, 28–30]. In case of liver cirrhosis, these effects might not be as dominant as in case of early-stage liver fibrosis, explaining the lack of significance for patients without liver fibrosis and patients with liver cirrhosis.
The loss of statistical significance regarding the individual degrees of fibrosis based on ADC at 3T is due to the inherent lowering of ADC values at 3T compared to 1.5T. Therefore, the working group of Rosenkrantz et al. described a shortened ADC time for the liver at 3T compared to 1.5T [31]. The influence of the shortened ADC time may explain the fact that the difference between the individual stages of fibrosis in a 3T system is too small for significant differentiation.
Our study has several limitations. First, this study has only a small study population so that the different influencing factors may not have been able to be fully discovered. Second, histological data from both liver biopsies and resections was used. As a result of differences in material quality, there could theoretically be discrepancies in the histological diagnosis. In particular, it can be difficult to differentiate between the individual degrees of liver fibrosis on the basis of liver biopsies.
In conclusion, the degree of liver fibrosis affects DWI particularly in early stage of liver fibrosis, but the corresponding degree of liver fibrosis cannot be determined based on the ADC value.
MATERIALS AND METHODS
Patients
In total, 62 patients were included in this retrospective analysis. All patients underwent MR imaging of the liver, either for the purpose of diagnosing suspicious liver lesions or as part of the monitoring of known liver cirrhosis. None of the recruited patients had a contraindication for MRI examination (e.g. claustrophobia, ferromagnetic foreign material, or pacemaker). Only patients who had undergone histopathological examination of the liver parenchyma in a period of 3 months were included in our study.
Imaging
All examinations were performed on a clinical 3-Tesla system (Magnetom Skyra, Siemens Healthcare). A combination of body and spine coils (18-channel coil, body coil, 24-channel spine coil) was used for signal detection.
To calculate the ADC maps, breath-triggered spin echo EPI sequences for three B-values (50, 400, 800 s/mm2) were used with adaptation to body weight using an S (small) and an L (large) program. (S: TR: 5700ms; TE: 52ms; voxel size reconstructed: 1.98 x 1.98 x 6mm; voxel size measured: 2.38 x 1.98 x 6mm; L: TR: 5900ms; TE: 52ms; voxel size reconstructed: 2.08 x 1.08 x 6mm; voxel size measured: 2.51 x 2.08 x 6mm; parallel imaging with an acceleration factor PAT2; averaging performed twice).
Sequence analysis
To calculate the average ADC time, three circular regions of interest (ROIs) were positioned in the liver. Special attention was paid to prohibit visible vessels, liver lesions, or regions with artifacts. The size of the ROI varied between 1 and 3.5 cm2. The thus measured average ADC was viewed as representative for the entire liver.
Histopathological analyses
Liver biopsies (27), as well as liver resections (35), were included in this study. Liver biopsies were performed as part of active patient monitoring in the case of known liver cirrhosis or an unclear liver tumor. Histological confirmation via surgery was obtained as part of either a liver transplantation or metastasis/liver tumor resection.
All tissue samples were fixed in neutral buffered formalin and embedded in paraffin. Histological slides with a thickness of 4 μm were prepared, deparaffinized with ethanol and xylene, and then stained according to the standard protocols for HE and EVG (Elastica van Gieson). The EVG staining was used to evaluate liver fibrosis. Collagen fibers turn red, while hepatocytes turn yellow.
Needle biopsy was used for the liver biopsy. The length of each biopsy specimen was measured and the number of portal areas was counted. Only liver biopsies with a tissue length of at least 15 mm and 10 portal areas were used. Non-tumorous liver biopsies were exclusively included in the study. Two pathologists specialized in hepatopathology analyzed the liver specimens with respect to the degree of fibrosis. Both examiners were blinded to the radiological data and patient data. Their evaluations were performed independently. In the case of disagreement, scoring was performed again in consensus. The degree of liver fibrosis was determined according to the Ishak scoring system [1].
Statistical analysis
Statistical analysis was performed using IBM SPSS Statistics (Version 23, Chicago, IL). All data are specified as average ± standard deviation if not otherwise specified. A simple linear regression analysis was performed to correlate the degree of fibrosis/cirrhosis with the DWI data. For the pairwise comparison, the patients were divided into groups on the basis of histological data. To compare the DWI data of subgroups, an Analysis of Variance (ANOVA) followed by Bonferroni adjusted pairwise comparisons was calculated. All statistical analyses were two-sided and a p-value < 0.05 indicated a significant result.
Key points
Liver fibrosis/cirrhosis affects DWI at 3T.
With increasing liver fibrosis the ADC-Value is lowered.
ADC-Values can partly determined the degree of fibrosis.
Abbreviations
US-RTE: Ultrasound elastography; MRI: Magnetic resonace imaging; DWI: Diffusion-weighted-imaging; ADC: Apparent diffusion coefficient; ROI: Region of interest; EVG: Elastica van Gieson; NLF: No fibrosis; MLF: Mild liver fibrosis; ALF: Advanced liver fibrosis; LC: Liver cirrhosis.
CONFLICTS OF INTEREST
The authors declare no potential conflicts of interest.
REFERENCES
1. Ishak K, Baptista A, Bianchi L, Callea F, De Groote J, Gudat F, Denk H, Desmet V, Korb G, MacSween RN, Phillips MJ, Portmann BG, Poulsen H, et al. Histological grading and staging of chronic hepatitis. J Hepatol. 1995; 22:696-9.
2. Marcellin P, Gane E, Buti M, Afdhal N, Sievert W, Jacobson IM, Washington MK, Germanidis G, Flaherty JF, Schall RA, Bornstein JD, Kitrinos KM, Subramanian GM, et al. Regression of cirrhosis during treatment with tenofovir disoproxil fumarate for chronic hepatitis B: a 5-year open-label follow-up study. Lancet. 2013; 381:468-75. https://doi.org/10.1016/s0140-6736(12)61425-1.
3. Malekzadeh R, Mohamadnejad M, Nasseri-Moghaddam S, Rakhshani N, Tavangar SM, Sohrabpour AA, Tahaghoghi S. Reversibility of cirrhosis in autoimmune hepatitis. Am J Med. 2004; 117:125-9. https://doi.org/10.1016/j.amjmed.2004.01.026.
4. Dufour JF, DeLellis R, Kaplan MM. Regression of hepatic fibrosis in hepatitis C with long-term interferon treatment. Dig Dis Sci. 1998; 43:2573-6.
5. Regev A, Berho M, Jeffers LJ, Milikowski C, Molina EG, Pyrsopoulos NT, Feng ZZ, Reddy KR, Schiff ER. Sampling error and intraobserver variation in liver biopsy in patients with chronic HCV infection. Am J Gastroenterol. 2002; 97:2614-8. https://doi.org/10.1111/j.1572-0241.2002.06038.x.
6. Germani G, Hytiroglou P, Fotiadu A, Burroughs AK, Dhillon AP. Assessment of Fibrosis and Cirrhosis in Liver Biopsies: An Update. Semin Liver Dis. 2011; 31:082-90. https://doi.org/10.1055/s-0031-1272836.
7. Maharaj B, Maharaj RJ, Leary WP, Cooppan RM, Naran AD, Pirie D, Pudifin DJ. Sampling variability and its influence on the diagnostic yield of percutaneous needle biopsy of the liver. Lancet. 1986; 1:523-5.
8. Bravo AA, Sheth SG, Chopra S. Liver biopsy. N Engl J Med. 2001; 344:495-500. https://doi.org/10.1056/nejm200102153440706.
9. Cassinotto C, Lapuyade B, Aït-Ali A, Vergniol J, Gaye D, Foucher J, Bailacq-Auder C, Chermak F, Le Bail B, de Lédinghen V. Liver fibrosis: noninvasive assessment with acoustic radiation force impulse elastography--comparison with FibroScan M and XL probes and FibroTest in patients with chronic liver disease. Radiology. 2013; 269:283–92. https://doi.org/10.1148/radiol.13122208.
10. Friedrich-Rust M, Nierhoff J, Lupsor M, Sporea I, Fierbinteanu-Braticevici C, Strobel D, Takahashi H, Yoneda M, Suda T, Zeuzem S, Herrmann E. Performance of Acoustic Radiation Force Impulse imaging for the staging of liver fibrosis: a pooled meta-analysis. J Viral Hepat. 2012; 19:e212-9. https://doi.org/10.1111/j.1365-2893.2011.01537.x.
11. Bota S, Sporea I, Sirli R, Popescu A, Danila M, Costachescu D. Intra- and interoperator reproducibility of acoustic radiation force impulse (ARFI) elastography--preliminary results. Ultrasound Med Biol. 2012; 38:1103-8. https://doi.org/10.1016/j.ultrasmedbio.2012.02.032.
12. Feier D, Balassy C, Bastati N, Stift J, Badea R, Ba-Ssalamah A. Liver fibrosis: histopathologic and biochemical influences on diagnostic efficacy of hepatobiliary contrast-enhanced MR imaging in staging. Radiology. 2013; 269:460-8. https://doi.org/10.1148/radiol.13122482.
13. Nishie A, Asayama Y, Ishigami K, Tajima T, Kakihara D, Nakayama T, Takayama Y, Okamoto D, Taketomi A, Shirabe K, Fujita N, Obara M, Yoshimitsu K, et al. MR prediction of liver fibrosis using a liver-specific contrast agent: Superparamagnetic iron oxide versus Gd-EOB-DTPA. J Magn Reson Imaging. 2012; 36:664-71. https://doi.org/10.1002/jmri.23691.
14. Chen BB, Hsu CY, Yu CW, Wei SY, Kao JH, Lee HS, Shih TT. Dynamic contrast-enhanced magnetic resonance imaging with Gd-EOB-DTPA for the evaluation of liver fibrosis in chronic hepatitis patients. Eur Radiol. 2012; 22:171-80. https://doi.org/10.1007/s00330-011-2249-5.
15. Verloh N, Utpatel K, Haimerl M, Zeman F, Fellner C, Fichtner-Feigl S, Teufel A, Stroszczynski C, Evert M, Wiggermann P. Liver fibrosis and Gd-EOB-DTPA-enhanced MRI: A histopathologic correlation. Sci Rep. 2015; 5:15408. https://doi.org/10.1038/srep15408.
16. Taouli B, Tolia AJ, Losada M, Babb JS, Chan ES, Bannan MA, Tobias H. Diffusion-weighted MRI for quantification of liver fibrosis: preliminary experience. AJR Am J Roentgenol. 2007; 189:799-806. https://doi.org/10.2214/AJR.07.2086.
17. Soylu A, Kilickesmez O, Poturoglu S, Dolapcioglu C, Serez K, Sevindir I, Yasar N, Akyildiz M, Kumbasar B. Utility of diffusion-weighted MRI for assessing liver fibrosis in patients with chronic active hepatitis. Diagn Interv Radiol. 2010; 16:204-8. https://doi.org/10.4261/1305-3825.DIR.2810-09.1.
18. Lewin M, Poujol-Robert A, Boelle PY, Wendum D, Lasnier E, Viallon M, Guechot J, Hoeffel C, Arrive L, Tubiana JM, Poupon R. Diffusion-weighted magnetic resonance imaging for the assessment of fibrosis in chronic hepatitis C. Hepatology. 2007; 46:658-65. https://doi.org/10.1002/hep.21747.
19. Girometti R, Furlan A, Bazzocchi M, Soldano F, Isola M, Toniutto P, Bitetto D, Zuiani C. Diffusion-weighted MRI in evaluating liver fibrosis: a feasibility study in cirrhotic patients. Radiol Med. 2007; 112:394-408. https://doi.org/10.1007/s11547-007-0149-1.
20. Sandrasegaran K, Akisik FM, Lin C, Tahir B, Rajan J, Saxena R, Aisen AM. Value of diffusion-weighted MRI for assessing liver fibrosis and cirrhosis. AJR Am J Roentgenol. 2009; 193:1556-60. https://doi.org/10.2214/AJR.09.2436.
21. Bakan AA, Inci E, Bakan S, Gokturk S, Cimilli T. Utility of diffusion-weighted imaging in the evaluation of liver fibrosis. Eur Radiol. 2012; 22:682-7. https://doi.org/10.1007/s00330-011-2295-z.
22. Boulanger Y, Amara M, Lepanto L, Beaudoin G, Nguyen BN, Allaire G, Poliquin M, Nicolet V. Diffusion-weighted MR imaging of the liver of hepatitis C patients. NMR Biomed. 2003; 16:132-6. https://doi.org/10.1002/nbm.818.
23. Jiang T, Xu JH, Zou Y, Chen R, Peng LR, Zhou ZD, Yang M. Diffusion-weighted imaging (DWI) of hepatocellular carcinomas: a retrospective analysis of the correlation between qualitative and quantitative DWI and tumour grade. Clin Radiol. 2017; 72:465–472. https://doi.org/10.1016/j.crad.2016.12.017.
24. Jahic E, Sofic A, Selimovic AH. DWI/ADC in Differentiation of Benign from Malignant Focal Liver Lesion. Acta Inform Med. 2016; 24:244-7. https://doi.org/10.5455/aim.2016.24.244-247.
25. Lee JK, Glazer HS. Controversy in the MR imaging appearance of fibrosis. Radiology. 1990; 177:21-2. https://doi.org/10.1148/radiology.177.1.2399319.
26. Kim T, Murakami T, Takahashi S, Hori M, Tsuda K, Nakamura H. Diffusion-weighted single-shot echoplanar MR imaging for liver disease. AJR Am J Roentgenol. 1999; 173:393-8. https://doi.org/10.2214/ajr.173.2.10430143.
27. Le Bihan D, Turner R, Douek P, Patronas N. Diffusion MR imaging: clinical applications. AJR Am J Roentgenol. 1992; 159:591-9. https://doi.org/10.2214/ajr.159.3.1503032.
28. Le Bihan D. Molecular diffusion, tissue microdynamics and microstructure. NMR Biomed. 1995; 8:375-86.
29. Aube C, Racineux PX, Lebigot J, Oberti F, Croquet V, Argaud C, Cales P, Caron C. [Diagnosis and quantification of hepatic fibrosis with diffusion weighted MR imaging: preliminary results]. [Article in French]. J Radiol. 2004; 85:301–6.
30. Amano Y, Kumazaki T, Ishihara M. Single-shot diffusion-weighted echo-planar imaging of normal and cirrhotic livers using a phased-array multicoil. Acta Radiol. 1998; 39:440-2.
31. Rosenkrantz AB, Oei M, Babb JS, Niver BE, Taouli B. Diffusion-weighted imaging of the abdomen at 3.0 Tesla: image quality and apparent diffusion coefficient reproducibility compared with 1.5 Tesla. J Magn Reson Imaging. 2011; 33:128-35. https://doi.org/10.1002/jmri.22395.