
INTRODUCTION
Pigment epithelium-derived factor (PEDF), also known as early population double level cDNA-1 (EPC1), is a 50 kDa secreted glycoprotein. It was first identified when Tombran-Tink’s group were studying human retinal cell development. They found a factor that was secreted by the human foetal retinal pigment epithelial cells and showed it to be a potent neurite promoting factor [1]. Subsequently, PEDF was found to be a member of the non-inhibitory serpin gene family [2]. The gene encoding PEDF (SERPINF1) is localised to the chromosome 17p13.1 [3]. There is evidence that PEDF is pleiotropic with multiple biological properties including neuroprotective, anti-tumorigenic and immune-modulating [4–5] and has been shown to be one of the most potent endogenous inhibitors of angiogenesis, more so than angiostatin, endostatin, and thrombospondin-1 [6–7].
PEDF exerts anti-angiogenic activities by arresting endothelial cell proliferation and migration, an activity which has been shown to occur even in the presence of vascular endothelial growth factor (VEGF) [6, 8–9]. The mechanisms of action appear to be multifactorial; suggested underlying mechanisms of PEDF biological effects on endothelial cells involve a complex cross-talk between the signal events triggered by both pro-angiogenic and anti-angiogenic molecules [10].
PEDF expression has been found to be lower in solid tumour tissue when compared to normal tissue from the same organ [11–16], suggesting that loss of PEDF expression may play a crucial role in tumorigenesis. Previous studies have also demonstrated that PEDF expression is downregulated with worsening prognostic factors in a range of cancers [11–12, 15, 17–20] and that treatment with recombinant PEDF has shown some benefit in cellular functional models [14, 19, 21–27], likely due, in part, to PEDF inhibiting aberrant angiogenesis, which leads to normalisation of healthy vasculature.
However, the evidence investigating the role of PEDF in colorectal cell line function has been limited. The current study examined the expression of PEDF in colorectal cancer tissue and its effect on in vitro cellular function of colorectal cancer cells.
RESULTS
Low expression of PEDF mRNA in colorectal cancer tissues
Expression screening for PEDF was performed using both colorectal cancer tissue samples obtained from the clinical cohort and colorectal cancer cell lines. PEDF expression was lower in all the colorectal cancer cell lines when compared to the CCD-33C0 colorectal fibroblast cell line, used as a positive control (Figure 1). On transcript analysis, mRNA expression of PEDF was lower in colorectal tumour tissue when compared to matched normal colorectal tissue from colorectal cancer patients (Table 1). On IHC staining highest expression of PEDF was seen within smooth muscle, endothelial cells and fibroblasts (Figure 2). There was some slight cytoplasmic staining seen within cancer adjacent and normal colorectal tissue. However, there was reduced expression overall.
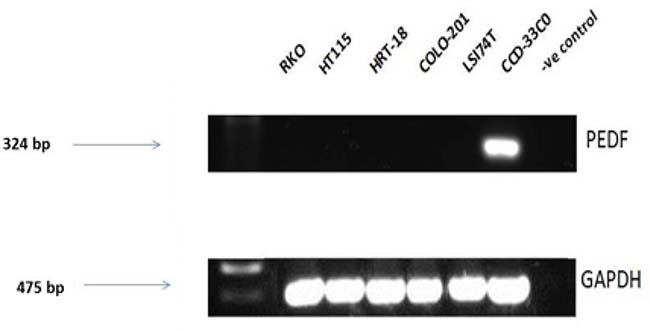
Figure 1: Transcript expression levels in PEDF in colorectal cell lines. Control = Nuclease free water and all gels were run with a molecular weight marker used to identify band sizes.
Table 1: Correlation between PEDF expression and clinical parameters in colorectal cohort
N |
Median transcript copy number |
IQR |
P value |
|
|---|---|---|---|---|
Tumour |
406 |
3.64 × 10⁻⁵ |
1.05 × 10⁻⁹–4.40 × 10⁻³ |
|
Normal matched tissue |
209 |
1.05 × 10⁻³ |
6.84 × 10⁻⁹–4.18 × 10⁻² |
<0.001* |
Female |
185 |
1.54 × 10⁻⁴ |
3.95 × 10⁻⁸–1.02 × 10⁻² |
|
Male |
221 |
1.51 × 10⁻⁵ |
2.52 × 10⁻¹⁰–2.36 × 10⁻³ |
0.01* |
Aged 64 years or younger |
163 |
8.78 × 10⁻⁶ |
1.17 × 10⁻¹²−3.46 × 10⁻³ |
|
Aged 65 years or older |
184 |
1.04 × 10⁻⁶ |
1.17 × 10⁻¹²−1.36 × 10⁻³ |
0.645 |
Female aged 64 years or younger |
75 |
1.08 × 10⁻⁵ |
1.17 × 10⁻¹²− 4.18 × 10⁻³ |
|
Male aged 64 years or younger |
88 |
4.39 × 10⁻⁶ |
2.45 × 10⁻¹²−1.44 × 10⁻³ |
0.729 |
Female aged 65 years or older |
84 |
1.47 × 10⁻⁵ |
1.17 × 10¹²–2.29 × 10⁻³ |
|
Male aged 65 years or older |
100 |
5.63 × 10⁻⁷ |
1.17 × 10⁻¹²–7.25 × 10⁻⁴ |
0.107 |
Smoker |
95 |
1.78 × 10⁻⁵ |
8.34 × 10⁻¹¹–3.02 × 10⁻³ |
|
Non-smoker |
239 |
6.44 × 10⁻⁵ |
1.31 × 10⁻¹⁰–3.92 × 10⁷ |
0.70 |
History of other cancers |
17 |
4.02 × 10⁻⁵ |
6.54 × 10⁻⁷–2.79 × 10⁻³ |
|
No history of other cancers |
375 |
5.32 × 10⁻⁵ |
9.62 × 10⁻¹⁰–4.50 × 10⁻³ |
0.617 |
Family history of colorectal cancer |
47 |
1.85 × 10⁻⁵ |
1.69 × 10⁻¹ 0–1.15 × 10⁻³ |
|
No family history of colorectal cancer |
344 |
6.93 × 10⁻⁵ |
4.09 × 10⁻⁹–5.25 × 10⁻³ |
0.382 |
Tumour location |
||||
Colon |
263 |
2.91 × 10⁻⁶ |
5.00 × 10⁻¹⁴–4.78 × 10⁻³ |
|
Rectum |
143 |
1.25 × 10⁻⁴ |
4.44 × 10⁻⁶–3.40 × 10⁻³ |
<0.001* |
Tumour differentiation |
||||
Well differentiation |
84 |
1.31 × 10⁻⁴ |
3.36 × 10⁻⁷–4.00 × 10⁻³ |
|
Moderately differentiation |
231 |
2.49 × 10⁻⁵ |
1.97 × 10⁻¹⁰–3.31 × 10⁻³ |
|
Poorly differentiation |
37 |
9.69 × 10⁻⁷ |
1.31 × 10⁻¹¹–1.83 × 10⁻³ |
0.187 |
Tumour type |
||||
Adenocarcinoma |
307 |
6.44 × 10⁻⁵ |
9.62 × 10⁻¹⁰–3.67 × 10⁻³ |
|
Mucinous adenocarcinoma |
49 |
4.92 × 10⁻⁵ |
4.45 × 10⁻¹⁰–2.41 × 10⁻³ |
0.98 |
Duke’s stage |
||||
A |
22 |
1.94 × 10⁻⁴ |
3.17 × 10⁻⁶–5.03 × 10⁻³ |
|
B |
170 |
1.63 × 10⁻⁵ |
4.78 × 10⁻¹¹–3.33 × 10⁻³ |
|
C |
156 |
1.29 × 10⁻⁴ |
2.45 × 10⁻⁸–6.66 × 10⁻³ |
|
D |
30 |
5.12 × 10⁻⁵ |
2.24 × 10⁻⁹–2.25 × 10⁻³ |
0.16 |
Pathological T stage |
||||
T1 |
0 |
|||
T2 |
34 |
1.65 × 10⁻⁴ |
3.09 × 10⁻⁷–4.37 × 10⁻³ |
|
T3 |
201 |
2.66 × 10⁻⁵ |
3.55 × 10⁻¹⁰–2.51 × 10⁻³ |
|
T4 |
148 |
5.78 × 10⁻⁵ |
1.50 × 10⁻¹⁰–7.76 × 10⁻³ |
0.45 |
No nodal involvement |
201 |
2.77 × 10⁻⁵ |
2.25 × 10⁻¹⁰–3.46 × 10⁻³ |
|
Nodal involvement |
181 |
7.30 × 10⁻⁵ |
7.21 × 10⁻⁹–5.33 × 10⁻³ |
0.23 |
No metastatic disease |
273 |
6.04 × 10⁻⁵ |
9.42 × 10⁻¹¹–3.69 × 10⁻³ |
|
Metastatic disease |
31 |
1.45 × 10⁻⁵ |
1.09 × 10⁻⁹–2.11 × 10⁻³ |
0.54 |
Radical surgery |
341 |
6.48 × 10⁻⁵ |
4.09 × 10⁻⁹–4.42 × 10⁻³ |
|
Palliative surgery |
45 |
1.51 × 10⁻⁵ |
1.50 × 10⁻¹²–5.33 × 10⁻³ |
0.54 |
*p ≤ 0.05.
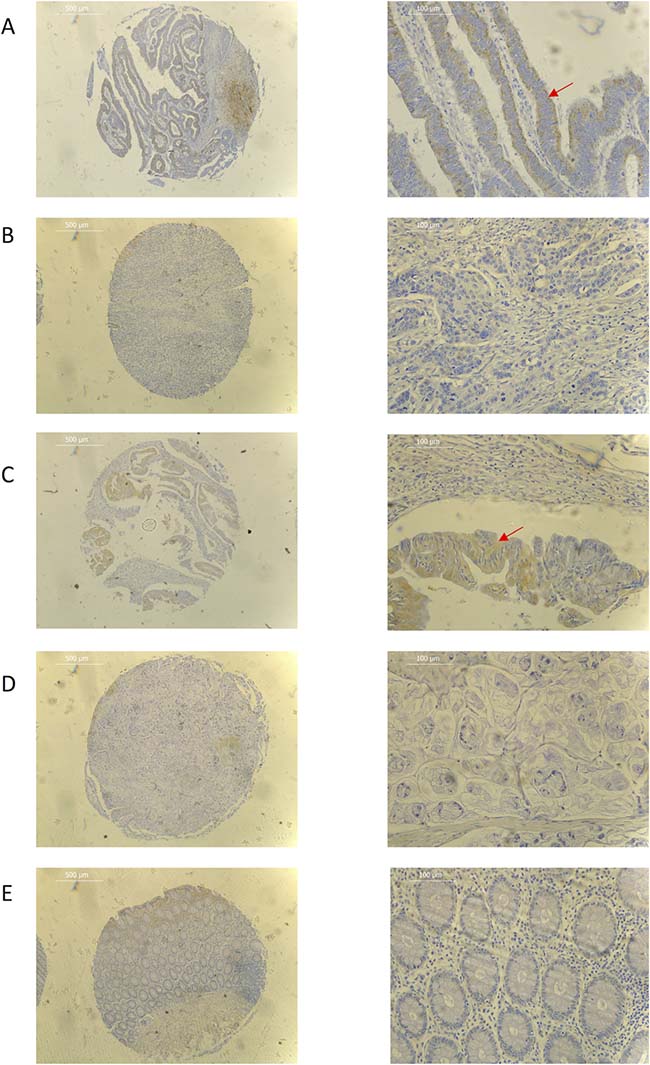
Figure 2: Representative immunohistochemistry images for (A) well differentiated adenocarcinoma (B) poorly differentiated adenocarcinoma (C) well differentiated mucinous adenocarcinoma (D) poorly differentiated mucinous adenocarcinoma (E) normal colorectal tissue samples. Red arrow shows cytoplasmic tumour staining. ×40 (L) and ×200 (R) magnification used. Scale bar represents 500 μm (L) and 100 μm (R).
Association of PEDF transcript levels with clinical and histopathological features of colorectal cancer
On transcript analysis, PEDF was more highly expressed in females with colorectal cancer within this cohort when compared to males with colorectal cancer (p = 0.01), and in rectal tumours compared with colonic tumours (p < 0.001) (Table 1). Whilst there was an obvious decline in mRNA expression of PEDF with worsening tumour grade, this trend was not found to be significant (p = 0.187). No other demographic or clinicopathological association were found to be statistically significant. Unfortunately, survival data was not available due to the short follow-up period of this cohort.
On IHC, tumour expression of PEDF was more pronounced in well-differentiated mucinous adenocarcinomas when compared to poorly differentiated mucinous adenocarcinomas and all grades of adenocarcinoma (Figure 2). There was a significant decrease in expression with worsening tumour grade in both adenocarcinomas and mucinous adenocarcinomas (p = 0.008 and p < 0.001, respectively), while there was no difference seen in expression in tumour location (colon vs. rectum), Dukes Stage or TNM Stage.
Effect of PEDF on cellular function in colorectal cancer cells
There was no statistically significant difference seen in both cellular growth and invasion in either HT115 or HRT-18 cell line comparing control in the presence of varying concentrations of rhPEDF. There was a statistically significant increase in the attachment of HT115 cells with the treatment of rhPEDF (100 ng/ml) when compared to the control (p = 0.003). However, this significant increase was not observed with 10 ng/ml or 50 ng/ml treatment doses of rhPEDF (Figure 3). No difference was demonstrated in the attachment of HRT-18 cells with the treatment of rhPEDF compared to the control. There was a statistically significant decrease in HT115 migration rate, evident for both 50 ng/ml and 100 ng/ml rhPEDF treatment doses (p = 0.007 and p < 0.001, respectively), when compared to untreated HT115 cells and 10 ng/ml rhPEDF treatment dose (Figure 4). A similar effect was demonstrated in the HRT-18 cell line; a statistically significant decrease in HRT-18 migration rate, was evident for all doses of rhPEDF compared to untreated HRT-18 cells. (rhPEDF 10 ng/ml vs control p = 0.002, rhPEDF 50 ng/ml p < 0.001, rhPEDF 100 ng/ml p < 0.001) (Figure 4).
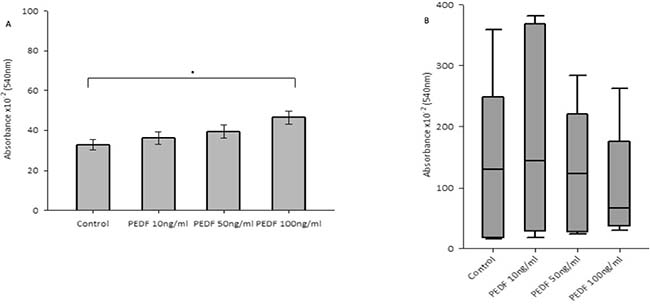
Figure 3: (A) Impact of rhPEDF on cellular attachment in HT115 cells. Mean values of 3 independent repeats are shown. Error bars represent SEM. (B) Impact of rhPEDF on cellular attachment in HRT-18 cells. Median values and IQR of 3 independent repeats are shown. Error bars represent 95% confidence intervals. Absorbance × 10–2 (540 nm) readings used as a marker of cellular attachment, in response to varying concentrations of rhPEDF. *p < 0.05.
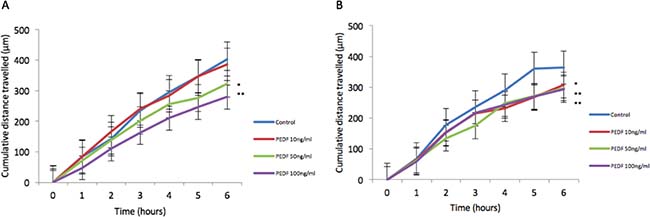
Figure 4: (A) Impact of rhPEDF on HT115 cellular migration assessed through scratch migration assay. (B) Impact of rhPEDF on HRT-18 cellular migration assessed through scratch migration assay. Cumulative distance travelled following scratch is shown and taken as representative of migration in cells compared to control and varying doses of rhPEDF. Mean values of 3 independent repeats are shown. Error bars represent SEM. *p < 0.05 **p < 0.001.
DISCUSSION
The results of this study demonstrate that PEDF mRNA expression was lower in colorectal cancer cell lines when compared to normal colorectal fibroblasts and in colorectal cancer tissue compared to normal tissue. These findings support those of Wågsäter et al. (2010) and Ji et al. (2013), who reported a significant reduction in serum PEDF levels in colorectal cancer patients compared to healthy controls [28–29].
Interestingly, mRNA expression of PEDF was observed to be higher in female colorectal cancer patients when compared to male colorectal cancer patients. This is contrary to both Yamagishi et al. (2006) and Wågsäter et al. (2010) who established that plasma samples from healthy male controls had higher levels of PEDF when compared to healthy female controls [28, 30], however a similar finding in colorectal cancer patients was either not assessed or demonstrated, in the respective studies. Other studies evaluating PEDF expression in other solid tumours did not display significance difference between genders [18, 31]. There is evidence to support a survival advantage in younger females compared to younger males, but with an opposite pattern in older patients [32–34]. One of the main reasons suggested for this effect is the favourable effect of endogenous female sex hormones [35]. However, it may be plausible that the gender difference in expression of PEDF may be responsible for the survival difference seen. In our cohort, we found no difference in PEDF expression comparing both genders in age groups 64 years or less and 65 years and over (p = 0.729 and p = 0.107, respectively).
Rectal tumour tissue appeared to express higher mRNA levels of PEDF when compared to colonic tumour tissue. Díaz et al. (2008) detected a similar difference with higher mRNA expression of PEDF in tissue from rectal tumours when compared to tissue from colonic tumour [36]. Cai et al. (2006b) found conflicting results on a cellular level with stronger PEDF expression in HT115 colonic adenocarcinoma cell line and weaker expression in HRT-18 rectal adenocarcinoma cell line [11], however our results showed little difference in the expression of these two cell lines and therefore there may be other factors in these cell lines that may be responsible for the expression levels shown, such as such as tumour grading or stage.
Mucinous adenocarcinoma tissue showed more positive tumour expression when compared to adenocarcinoma tissue on immunohistochemical staining, which is consistent with work from Ji et al. (2013) where patients with mucinous adenocarcinoma displayed higher PEDF plasma levels than adenocarcinoma patients [29]. This is perhaps a slightly surprising result, as mucinous adenocarcinoma of the colon or rectum is well recognised to have a poorer survival rate when compared to non-mucinous adenocarcinoma [37] and hence there must be other influences, yet to be identified, that are specific to mucin-producing tumours that are responsible for the higher expression levels of PEDF.
The most frequent cause of mortality from colorectal cancer is related to the effects of metastatic spread, and therefore treatments aimed at its prevention may prove highly beneficial for the long-term survival of colorectal cancer patients. Tumour metastasis depends on several cancer cell characteristics including cellular proliferation, adhesion, invasion and migration, and hence the capability to adapt to in vivo environments and outcompete with normal cells for resources necessary for survival. To date, the exact mechanisms of PEDF on colorectal cancer metastases remain poorly understood.
In this study, treatment with rhPEDF appeared to significantly decrease the rate of cellular migration. To date, the effect of rhPEDF on cellular function has not been studied in colorectal cell lines, but has been reported in a number of other solid tumours. Hong et al. (2014) reported a significant decrease in both breast cancer cell migration and invasion, and found that PEDF inhibited breast cancer cell migration and invasion by down-regulating fibronectin and subsequent MMP2/MMP9 reduction via p-ERK and p-AKT signalling pathways [22]. Correspondingly, Tan et al. (2010) found a 20% decrease in cellular invasion in PEDF treated chondrosarcoma cell when compared to control cells [27]. These findings support our results presented in this study.
In the adhesion studies presented in this study, treatment with rhPEDF resulted in an increase in cellular attachment. Tan et al. (2010) found a similar finding when examining chondrosarcoma cells [27]. Increased adhesion certainly presents a beneficial effect in the prevention of metastatic progression, by contributing to a decreased ability for the cancer cells to invade and migrate.
In conclusion, our results confirmed that PEDF expression was higher in normal colorectal tissue and cells compared to cancer tissue and cells and that PEDF administration confers an inhibitory effect on the migration and invasion of colorectal cancer cells. Future studies should examine the possible reasons behind a difference in PEDF expression patterns between the genders and tumour location and assess cellular function on a range of colorectal cancer cell lines (including metastatic and mucinous adenocarcinoma) and to explore the effect of cellular function in in vivo models using colorectal tumour xenografts within animal models.
MATERIALS AND METHODS
Cell culture
Human colorectal cancer cell lines RKO, COLO-201, LSI74T and colorectal fibroblast cell line CCD-33C0 were purchased from American Type Culture Collection (ATCC) (Rockville, Maryland, USA). Human colorectal cancer cell lines HT115, HRT-18 were purchased from Sigma-Aldrich (Poole, Dorset, UK). The cells were maintained in Dulbecco’s modified Eagle’s medium (DMEM)-F12 medium supplemented with 10% foetal calf serum and antibiotics. Polyclonal rabbit anti-PEDF was obtained from Santa Cruz Biotechnology Inc. (Santa Cruz, Texas, USA). Recombinant PEDF (rhPEDF) was purchased from R&D Systems Europe Ltd (Abingdon, Oxfordshire, UK) and cellular functional assays were performed at doses of 10 ng/ml, 50 ng/ml and 100 ng/ml versus control medium. HT115 and HRT-18 were used as representative colorectal cancer cell lines for cellular functional assays. Unless otherwise stated, other materials and reagents were purchased from Sigma-Aldrich Ltd (Poole, Dorset, UK).
Collection of colorectal tissue samples
Colorectal cancer tissues (n = 406) and normal matched colorectal tissue (n = 209) were collected during surgery, and stored at −80° C until use and used for transcript analysis. Histopathological details were obtained from pathological reports. Ethical approval was obtained from Beijing Friendship Hospital, China and consent received from all patients included in the cohort. Colonic cancer tissue microarray (T054b) and rectal cancer tissue microarray (RE961) purchased from US Biomax Inc. (Rockville, USA) were used for immunohistochemical staining, and these microarrays included normal tissue and cancer adjacent normal tissue. All specimens were registered and stored according to Human Tissue Act regulations.
RNA extraction, reverse transcription polymerase chain reaction (RT-PCR) and quantitative PCR
RNA isolation was performed using TRI reagent®. RNA concentration was determined using a UV Spectrophotometer (WPA UV 1101: Biotech Photometer, Cambridge, UK). Reverse transcription was performed using GoTaq Green master mix (Promega, Madison, USA) with 500ng of RNA with each RT reaction. The quality of cDNA was verified by examining a housekeeping gene, glyceraldehyde 3-phosphate dehydrogenase (GAPDH). Conventional PCR was carried out using primers for PEDF (Table 2). The conditions for PCR were: 94° C for 5 minutes, then 34 cycles of 94° C for 30 seconds, 55° C for 30 seconds, 72° C for 40 seconds, followed by a final extension at 72° C for 10 minutes. Visualisation of products took place on 0.8% agarose gel using SYBR safe DNA gel stain (Invitrogen, Manchester, UK). PEDF transcript levels in the colorectal tissue specimens were determined using real-time qPCR, using Amplifluor™ technology as described before [37]. In brief, the ampliflour probe consists of a 3′ region specific to the Z-sequence (ACTGAACCTGACCGTACA) present on the target specific primers and a 5′ hairpin structure labelled with a flourophore [38]. The flourophore hairpin structure is linked to an acceptor moiety and therefore acts as a fluorescence quencher preventing any signal from being detected. During the qPCR reaction, the uniprobe (Millipore, Watford, UK) becomes incorporated and acts as a template for DNA polymerisation, in which DNA polymerase uses its 5′-3′ exonuclease activity to degrade and unfold the hairpin structure. This disrupts the energy transfer between the quencher and flourophore and results in sufficient fluorescence to be emitted and detected. The fluorescent signal emitted during each cycle is directly correlated to the amount of DNA that has been amplified. Pairs of qPCR primers were designed using Beacon Designer™ software (PREMIER Biosoft, Palo Alto, California, USA) as discussed in Table 2, but with the additional Z sequence added to the antisense primer, complimentary to the universal Z probe (Intergen Inc., Oxford, UK). Results are displayed as the number of transcripts/ml based on an internal standard Podoplanin (PDPL). All samples were made with a known dilution series of PDPL transcript/ml against the unknown samples, and they were subjected to the same conditions. This generated a standard curve from which transcript expression of the unknown samples were calculated. This same principal applied to the expression of GAPDH to ensure sample normalisation. An iCyclerIQ thermocycler (Bio-Rad Laboratories, Hemel Hampstead, UK) was used to perform the reaction, with an optical unit that allows real-time detection of 96 reactions. The conditions were: 94° C for 5 minutes, then 100 cycles of 94° C for 10 seconds, 55° C for 35 seconds, followed by a final extension of 72° C for 10 seconds.
Table 2: Primers for conventional RT-PCR and real time qPCR
Gene |
Primer name |
Primer Sequence (5′-3′) |
|---|---|---|
PEDF |
SERPINF1 F50 |
ATCCTTTCTTCAAAGTCCCC |
SERPINF1 R50 |
ATTTTATGCGCAGCTTCTTC |
|
PEDFF1 |
GGTGCTACTCCTCTGCATT |
|
PEDFZR |
ACTGAACCTGACCGTACAAGAAAGGATCCTCCTCCTC |
|
GAPDH |
GAPDHF8 |
GGCTGCTTTTAACTCTGGTA |
GAPDHR8 |
GACTGTGGTCATGAGTCCTT |
|
GAPDHF1 |
AAGGTCATCCATGACAACTT |
|
GAPDHZR1 |
ACTGAACCTGACCGTACAGCCATCCACAGTCTTCTG |
|
PDPL |
PDPLF8 |
GAATCATCGTTGTGGTTATG |
PDPLZR |
ACTGAACCTGACCGTACACTTTCATTTGCCTATCACAT |
ACTGAACCTGACCGTACA represents the Z sequence.
Immunohistochemical staining of tissues
Immunohistochemistry was performed using Vector ABC kit (Vector Laboratories, Burlingame, California, USA) as described previously [39]. The cryosections were air-dried and fixed in acetone prior to rehydration with Tris-buffered saline buffer. Incubation with a blocking reagent (10 mls of Tris-buffered saline buffer with 0.1% bovine serum albumin and 10% horse serum) was performed for 1 hour in a humidified box, followed by incubation with the primary antibody to PEDF (1:50 dilution) for a further hour. Following washing, sections were incubated with the ABC biotinylated secondary antibody for 30 minutes. Washing was repeated with further incubation of the ABC reagent for 30 minutes. ABC reagent used consisted of 5 ml of blocking reagent with 100 μl of reagent A and 100 μl of reagent B (Cat no. PK-6200; Vectastain Universal Elite ABC Kit, Vector Laboratories, Burlingame, California, USA). Washing was once again repeated, and sections were subsequently developed in DAB substrate for 5 minutes and then counterstained with Hematoxylin Gill’s Formula (Vector Laboratories, Burlingame, California, USA) for 2 minutes followed by dehydration in ethanol, clearing in xylene and mounting in DPX. The samples were visualised using a Leica DM 1000 LED microscope (Leica Microsystems Ltd, Milton Keynes, UK) at ×100 magnification. Software used to capture images was LAS EZ (Leica Application Suite, Milton Keynes, UK). All specimens were analysed anonymously. Details of demographical and clinicopathological associations were provided during experimental data analysis.
In vitro cell growth assay
The standard technique used has been previously described [40]. Cells were seeded into 96-well plates at a seeding density of 3 × 10³ cells per well. Cell growth was measured after 1,3 and 5 days. Crystal violet cell staining was performed and analysis of absorbance was performed at 540 nm using a spectrophotometer (BioTek™ EL × 800™; BioTek).
In vitro tumour cell matrigel adhesion assay
The standard technique used has been previously described [41]. Cells were seeded into Matrigel-coated (BD Matrigel™ Basement Membrane Matrix; BD Bioscience, Oxford, UK) wells (5 μg/well) at a seeding density of 4.5 × 10⁴ cells per well. Following 45 minutes of incubation, non-adherent cells were washed off using balanced salt solution buffer. The remaining cells were fixed, stained with Crystal violet and then analysed using a spectrophotometer at 540 nm.
In vitro scratch migration assay
As previously described [42], cells were seeded into a 24-well plate at a seeding density of 3 × 10⁵ cells per well, and were incubated for 24 hours. After incubation, a straight-line scratch was made to the cellular monolayer using the end of a sharpened 200 μl pipette tip down the midpoint of each well. The medium was then removed from the plates carefully and replaced with 500 μl of either treatment or control. The analysis was performed using EVOS cell imaging system (Life Technologies, Paisley, UK) and images were captured every 60 minutes for a total of 6 hours. Migration distances were measured using Image-J software (National Institutes of Health, USA).
In vitro cellular invasion assay
The methods used to determine the invasive ability of the cells in this study have been previously described [43]. Transwell inserts with 8 μm pores were coated with 50 μg of Matrigel™ and air-dried. After rehydrated, 3 × 10⁴ cells were seeded per well. Following 72 hours, the cells that migrated through the matrix to the underside of the insert were fixed and stained. The dye was solubilised using acetic acid and analysed using a spectrophotometer at 540 nm with absorbance levels as a marker of cell density presented.
Statistical analysis
Statistical analysis was performed using Sigma plot 11.0 statistical software (Systat Software Inc.). Student T-test was used for parametric data and Mann–Whitney U test for non-parametric data, where two variables were present. The significance of associations between PEDF mRNA levels and clinicopathological variables and for functional cellular assays (except migration assays) were assessed by Kruskal–Wallis one-way analysis of variance on ranks test, and pairwise multiple comparison procedure (Dunn’s method). Two-way analysis of variance was performed for migration assay data. Parametric data were presented as mean values with error bars depicting standard error of the mean (SEM). Non-parametric data was presented, were possible as boxplots, with median values and interquartile range (IQR), with error bars depicting 95% confidence intervals. Differences were considered to be statistically significant at p ≤ 0.05.
Abbreviations
cDNA: complementary deoxyribonucleic acid; EPC1: early population double level cDNA-1; GAPDH: glyceraldehyde 3-phosphate dehydrogenase; IHC: immunohistochemistry; IQR: interquartile range; mRNA: messenger RNA; PDPL: Podoplanin (internal standard); PEDF: pigment epithelium-derived factor; qPCR: quantitative polymerase chain reaction; rhPEDF: recombinant PEDF; RNA: ribonucleic acid; SEM: standard error of the mean; TNM: tumour, node, metastases staging; VEGF: vascular endothelial growth factor; RT-PCR: reverse transcription polymerase chain reaction.
Author contributions
RLH: lead on the study, performed PCR, qPCR and cellular functional studies, collected and analysed the data, wrote the manuscript. FR: performed immunohistochemistry studies. MM: reviewed the immunohistochemical images as a histopathologist. JL and ZZ: collected colorectal tissue samples and performed qPCR. SO, KGH, JT, WJ and JC: supervised the study and wrote the manuscript.
ACKNOWLEDGMENTS
The authors are grateful to the Royal College of Surgeons in England, the Welsh Wound Innovation Centre, Cancer Research Wales and the Life Sciences Network for Wales for supporting this work. The authors also wish to thank the support of the National Key Clinical Specialist construction Programs of China. Dr Jun Li is a recipient of Cardiff China Medical Scholarship.
CONFLICTS OF INTEREST
None to declare.
FUNDING
RLH was supported by a research fellowship grant from the Royal College of Surgeons of England and Welsh Wound Innovation Centre.
REFERENCES
1. Tombran-Tink J, Chader G, Johnson L. PEDF: a pigment epithelium-derived factor with potent neuronal differentiative activity. Exp Eye Res. 1991; 53:411–414.
2. Steele F, Chader G, Johnson L, Tombran-Tink J. Pigment epithelium-derived factor: neurotrophic activity and identification as a member of the serine protease inhibitor gene family. Proc Natl Acad Sci U S A. 1993; 90:1526–1530.
3. Tombran-Tink J, Pawar H, Swaroop A, Rodriguez I, Chader G. Localization of the gene for pigment epithelium-derived factor (PEDF) to chromosome 17p13.1 and expression in cultured human retinoblastoma cells. Genomics. 1994; 19:266–272.
4. Becerra S, Notario V. The effects of PEDF on cancer biology: mechanisms of action and therapeutic potential. Nat Rev Cancer. 2013; 13:258–271.
5. Zhang S, Wang J, Gao G, Shao C, Mott R, Ma J. Pigment epithelium-derived factor (PEDF) is an endogenous antiinflammatory factor. The FASEB journal. 2006; 20:323–325.
6. Dawson D, Volpert O, Gillis P, Crawford S, Xu H, Benedict W, Bouck N. Pigment epithelium-derived factor: a potent inhibitor of angiogenesis. Science. 1999; 285:245–248.
7. Duh E, Yang H, Suzuma I, Miyagi M, Youngman E, Mori K, Katai M, Yan L, Suzuma K, West K, Davarya S, Tong P, Gehlbach P, et al. Pigment epithelium-derived factor suppresses ischaemia-induced retinal neovascularization and VEGF-induced migration and growth. Invest Ophthalmol Vis Sci. 2002; 43:821–829.
8. Volpert O, Zaichuk T, Zhou W, Reiher F, Ferguson T, Stuart P, Amin M, Bouck N. Inducer-stimulated Fas targets activated endothelium for destruction by anti-angiogenic thrombospondin-1 and pigment epithelium-derived factor. Nat Med. 2002; 8:349–357.
9. Bouck N. PEDF: anti-angiogenic guardian of ocular function. Trends Mol Med. 2002; 8:330–334.
10. Cai J, Chen Z, Ruan Q, Han S, Liu L, Qi X, Boye SL, Hauswirth WW, Grant MB, Boulton ME. γ-Secretase and presenilin mediate cleavage and phosphorylation of vascular endothelial growth factor receptor-1. J Biol Chem. 2011; 286:42514–23.
11. Cai J, Parr C, Watkins G, Jiang W, Boulton M. Decreased pigment epithelium-derived factor expression in human breast cancer progression. Clin Cancer Res. 2006; 12:3510–3517.
12. Zhou D, Cheng S, Ji H, Wang J, Xu H, Zhang G, Pang D. Evaluation of protein pigment epithelium-derived factor (PEDF) and microvessel density (MVD) as prognostic indicators in breast cancer. J Cancer Res Clin Oncol. 2010; 136:1719–1727.
13. Zhang L, Chen J, Ke Y, Mansel R, Jiang W. Expression of pigment epithelial derived factor is reduced in non-small cell lung cancer and is linked to clinical outcome. Int J Mol Med. 2006; 17:937–944.
14. Cheung L, Au S, Cheung A, Ngan H, Tombran-Tink J, Auersperg N, Wong A. Pigment epithelium-derived factor is estrogen sensitive and inhibits the growth of human ovarian cancer and ovarian surface epithelial cells. Endocrinology. 2006; 147:4179–4191.
15. Guan M, Yam H, Su B, Chan K, Pang C, Liu W, Zhang W, Lu Y. Loss of pigment epithelium derived factor expression in glioma progession. J Clin Pathol. 2003; 56:277–282.
16. Zhang C, Xiang L, Shen J, Zhang Y, Li J, Zheng Z. Expression of pigment epithelium-derived factor in human melanocytes and malignant melanoma cells and tissue. Expression of pigment epithelium-derived factor in human melanocytes and malignant melanoma cells and tissue. Dermatoendocrinol. 2009; 1:108–113.
17. Fitzgerald D, Subramanian P, Deshpande M, Graves C, Gordon I, Qian Y, Snitovsky Y, Liewehr D, Steinburg S, Paltán-Ortiz J, Herman M, Camphausen K, Palmieri D, et al. Opposing effects of pigment epithelum-derived factor on breast cancer cell versus neuronal survival: implication for brain metastasis and metastasis-induced brain damage. Cancer Res. 2012; 72:144–153.
18. Uehara H, Miyamoto M, Kato K, Ebihara Y, Kaneko H, Hashimoto H, Murakami Y, Hase R, Takahashi R, Mega S, Shichinohe T, Kawarada Y, Itoh T, et al. Expression of pigment epithelium-derived factor decreases liver metastasis and correlates with favourable prognosis for patients with ductal pancreatic adenocarcinoma. Cancer Res. 2004; 64:3533–3537.
19. Dass C, Ek E, Choong PF. PEDF as an emerging therapeutic candidate for osteosarcoma. Curr Cancer Drug Targets. 2008; 8:683–690.
20. Halin S, Wikström P, Rudolfsson S, Stattin P, Doll J, Crawford S, Bergh A. Decreased pigment epithelium-derived factor is associated with metastatic phenotype in human and rat prostate tumors. Cancer Res. 2004; 64:5664–5671.
21. Chen J, Ye L, Zhang L, Jiang W. The molecular impact of pigement epithelium-derived factor, PEDF, on lung cancer cells and the clinical significance. Int J Oncol. 2009; 35:159–166.
22. Hong H, Zhou T, Fang S, Jia M, Xu Z, Dai Z, Li C, Li S, Li L, Zhang T, Qi W, Bardeesi A, Yang Z. Pigment epithelium-derived factor (PEDF) inhibits breast cancer metastasis by down-regulating fibronectin. Breast Cancer Res Treat. 2014; 148:61–72.
23. Matsumoto K, Ishikawa H, Nishimura D, Hamasaki K, Nakao K, Eguchi K. Antiangiogenic property of pigment epithelium-derived factor in hepatocellular carcinoma. Hepatology. 2004; 40:252–259.
24. Guan M, Jiang H, Xu C, Xu R, Chen Z, Lu Y. Adenovirus-mediated PEDF expression inhibits prostate cancer cell growth and results in augmented expression of PAI-2. Cancer Biol Ther. 2007; 6:419–425.
25. Zhang T, Guan M, Xu C, Chen Y, Lu Y. Pigment epithelium-derived factor inhibits glioma cell growth in vitro and in vivo. Life Sci. 2007; 81:1256–1263.
26. Abe R, Shimizu T, Yamagishi S, Shibaki A, Amano S, Inagaki Y, Watanabe H, Sugawara H, Nakamura H, Takeuchi M, Imaizumi T, Shimizu H. Overexpression of pigment epithelium-derived factor decreases angiogenesis and inhibits the growth of human malignant melanoma. Am J Pathol. 2004; 164:1225–1232.
27. Tan M, Choong P, Dass C. Anti-chondrosarcoma effects of PEDF mediated via molecules important to apoptosis, cell cycling, adhesion and invasion. Biochem Biophys Res Commun. 2010; 398:613–618.
28. Wågsäter D, Löfgren S, Zar N, Hugander A, Dimberg J. Pigment Epithelium-Derived Factor Expression in Colorectal Cancer Patients. Cancer Invest. 2010; 28:872–877.
29. Ji D, Li M, Zhan T, Yao Y, Shen J, Tian H, Zhang Z, Gu J. Prognostic role of serum AZGP1, PEDF and PRDX2 in colorectal cancer patients. Carcinogenesis. 2013; 34:1265–1272.
30. Yamagishi S, Adahi H, Abe A, Yashiro T, Enomoto M, Furiki L, Hino A, Jinnouchi Y, Takenaka K, Matsui T, Nakamura K, Imaizumi T. Elevated serum levels of pigment epithelium-derived factor (PEDF) in the metabolic syndrome. J Clin Endocrinol Metab. 2006; 91:2447–2450.
31. Jiang Z, Fang Z, Ding Q. Prognostic role of pigment epithelium-derived factor in clear cell renal cell carcinoma. Urol Int. 2010; 84:334–340.
32. Majek O, Gondos A, Jansen L, Emrich K, Holleczek B, Katalinic A, Nennecke A, Eberle A, Brenner H. GEKID Cancer Survival Working Group: Sex differences in colorectal cancer survival: population-based analysis of 164,996 colorectal cancer patients in Germany. PLoS One. 2013; 8:e68077.
33. Hendifar A, Yang D, Lenz F, Lurje G, Pohl A, Lenz C, Ning Y, Zhang W, Lenz HJ. Gender disparities in metastatic colorectal cancer survival. Clin Cancer Res. 2009; 15:6391–6397.
34. Koo JH, Jalaludin B, Wong SK, Kneebone A, Connor SJ, Leong RW. Improved survival in young women with colorectal cancer. Am J Gastroenterol. 2008; 103:1488–1495.
35. Franceschi S, Gallus S, Talamini R, Tavani A, Negri E, La Vecchia C. Menopause and colorectal cancer. Br J Cancer. 2000; 82:1860–1862.
36. Díaz R, Peña C, Silva J, Lorenzo Y, García V, García J, Sánchez A, Espinosa P, Yuste R, Bonilla F, Domínguez G. p73 isoforms affect VEGF, VEGF165b and PEDF expression in human colorectal tumors: VEGF165b downregulation as a marker of poor prognosis. Int J Cancer. 2008; 123:1060–1067.
37. Webb SL, Sanders AJ, Mason MD, Jiang WG. Matriptase-2 inhibits HECV motility and tubule formation in vitro and tumour angiogenesis in vivo. Mol Cell Biochem. 2013; 375:207–217.
38. Nazarenko I, Bhatnagar S, Hohman R. A closed tube format for amplification and detection of DNA based on energy transfer. Nucleic Acids Res. 1997; 25: 2516–2521.
39. Wang S, Ye L, Sanders A, Ruge F, Harding K, Jiang W. Tumour endothelial marker-8 in wound healing and its impact on the proliferation and migration of keratinocytes. Int J Mol Med. 2016; 37:293–298.
40. Jiang W, Hiscox S, Hallett M, Horrobin D, Mansel R, Puntis M. Regulation of the Expression of E-Cadherin on Human Cancer Cells by γ -Linolenic Acid (GLA). Cancer Res. 1995; 55:5043–5048.
41. Jiang W, Hiscox S, Hallett M, Scott C, Horrobin D, Puntis M. Inhibtion of hepacyte growth factor-induced motility and in vitro invasion of human colon cancer cells by gamma-linolenic acid. Br J Cancer. 1995; 71:744–752.
42. Sasi W, Ye L, Jiang W, Sharma A, Mokbel K. In vitro and in vivo effects of suppressor of cytokine signalling 7 knockdown in breast cancer: The influence on cellular response to hepacyte growth factor. Biomed Res Int. 2014; 2014:648040.
43. Fernando H, Sanders A, Kynaston H, Jiang W. WAVE3 is associated with vasiveness in prostate cancer cells. Urol Oncol. 2010; 28:320–327.