
INTRODUCTION
Dynamic contrast-enhanced magnetic resonance imaging (DCE MRI) is a modality to characterize perfusion and vascularization of tissues [1–3]. According to the literature, parameters of DCE MRI can differentiate between malignant and benign lesions in several organs [1, 3]. DCE MRI can also distinguish low and high grade tumors [4–6]. Furthermore, some reports identified significant associations between DCE MRI findings and histopathology in several malignancies [7–9]. So Li et al. showed that the perfusion parameters significantly correlated with microvessel density in breast cancer [7]. Additionally, Jain et al. found that DCE MRI was associated with proliferation index KI 67 in glioma [8]. In HNSCC, it has been shown that DCE MRI parameters reflected well microvessel density [9].
Currently, a new approach of imaging analysis, namely histogram analysis of different radiological parameters is in trend. So some reports indicated that histogram analysis parameters of apparent diffusion coefficient (ADC) can better reflect several morphological features in different malignancies in comparison to established ADC parameters [10–12]. For instance, Liu et al. showed that ADC histogram parameters can well differentiate T and N stages in gastic cancer [13]. Also histogram parameters of DCE MRI have been reported to have a great diagnostic potential. According to Lee et al., histogram parameters of MR perfusion can distinguish between oligodendroglioma and astrocytic tumors [14]. Furthermore, histogram DCE MRI parameters can be used to differentiate between lymphoma and squamous cell carcinoma of the oropharynx [15].
Presumably, histogram based DCE MRI parameters are more sensitive to reflect histopathololgical features than mean values used in clinical practice.
The purpose of this study was to analyze possible associations between histogram analysis parameters of DCE MRI and histopathological findings like proliferation index, cell count and nucleic areas in HNSCC.
RESULTS
Correlation analysis identified several statistically significant correlations and correlation trends between the investigated parameters. KI 67 correlated with Ktrans min (P = -0.386, P = 0.043) and Ktrans skewness (P = 0.382, P = 0.045) (Table 1). Furthermore, Ktrans kurtosis correlated with cell count (P = 0.40, P = 0.034). Ve min correlated with KI 67 (P = -0.473, P = 0.011) and Ve max with total nucleic area (P = 0.386, P = 0.042). Ve entropy showed significant correlations with KI 67 (P = 0.424, P = 0.025), cell count (P = 0.475, P = 0.011), and total nucleic area (P = 0.411, P = 0.030). Finally, Kep entropy correlated with KI 67 (P = 0.464, P = 0.013).
Table 1: Correlations between DCE MRI and histopathological parameters
Parameters |
Ki67 |
Cell count |
Total nucleic area |
Average nucleic area |
|---|---|---|---|---|
Ktrans min |
p = –0.386 |
p = –0.347 |
||
Ktrans P10 |
p = –0.334 |
|||
Median |
p = –0.321 |
|||
Ktrans kurtosis |
p = 0.358 |
p = 0.40 |
||
Ktrans skewness |
p = 0.382 |
p = 0.371 |
||
Ve min |
p = –0.473 |
|||
Ve max |
p = 0.386 |
|||
Ve P10 |
p = –0.365 |
|||
Ve P25 |
p = –0.359 |
|||
Ve median |
p = –0.328 |
|||
Ve mode |
p = –0.338 |
|||
Ve entropy |
p = 0.424 |
p = 0.475 |
p = 0.411 |
|
Kep entropy |
p = 0.464 |
p = 0.321 |
Only statistically significant correlations and statistical trends are shown.
On the next step, separate correlation analyses in the low and high grade HNSCC were performed. In G1/2 tumors, only Ktrans entropy correlated well with total (P = 0.78, P = 0.013) and average nucleic areas (P = 0.655, P = 0.006) (Table 2). There were no other statistically significant correlations or correlation trends between the parameters.
Table 2: Correlations between DCE MRI and histopathological parameters in G1/2 tumors
Parameters |
Total nucleic area |
Average nucleic area |
|---|---|---|
Ktrans kurtosis |
||
Ktrans entropy |
p = 0.78 |
p = 0.655 |
Only statistically significant correlations and statistical trends are shown.
In G3 tumors, KI 67 correlated with Ve min (P = –0.552, P = 0.022) and Ve entropy (P = 0.524, P = 0.031) (Table 3). Furthermore, Ve max correlated with total nucleic area (P = 0.483, P = 0.049). In addition, Kep max correlated with total area (P = -0.51, P = 0.037), and Kep entropy with KI 67 (P = 0.567, P = 0.018).
Table 3: Associations between DCE MRI and histopathological parameters in G3 tumors
Parameters |
Ki67 |
Total nucleic area |
Average nucleic area |
|---|---|---|---|
Ktrans mean |
p = –0.415 |
||
Ktrans P10 |
p = –0.439 |
||
Ve min |
p = –0.552 |
||
Ve max |
p = 0.417 |
p = 0.483 |
|
Ve P10 |
p = –0.443 |
||
Ve entropy |
p = 0.524 |
p = 0.441 |
|
Kep max |
p = –0.51 |
p = –0.448 |
|
Kep entropy |
p = 0.567 |
Only statistically significant correlations and statistical trends are shown
DISCUSSION
The present study identified associations between different DCE MRI parameters derived from histogram analysis and histopathological findings in HNSCC.
As mentioned above, previously, numerous studies analyzed DCE MRI findings in HNSCC [16–21]. It has been shown that perfusion parameters predicted tumor behavior and, therefore, can be used as biomarker [16–21]. So far volume of Ve is one of the independent prognostic factors for neck control in HNSCC treated with chemoradiation [16]. Furthermore, Kim et al. investigated lymph node metastases in HNSCC and found that low pretreatment Ktrans was associated with a poor response to concurrent chemoradiation therapy [18]. Finally, Chawla et al. showed that lower pretreatment Ktrans correlated with shorter disease-free survival [19].
The reported results suggested that DCE MRI parameters should be associated with relevant histopathological features in HNSCC. Previously, only two studies analyzed possible relationships between DCE MRI and histopathology in patients HNSCC [9, 22]. So Jansen et al. identified statistically significant correlations between KI 67 and Ktrans, Ve, as well between Kep and vascular endothelial growth factor (VEGF) in neck nodal metastases of HNSCC [22]. However, other authors did not find statistically significant correlations between DCE MRI parameters and KI 67 or tumor cellularity in HNSCC [9]. Presumably, these controversial results may be related to the fact that the studies investigated different parameters: in one study [22] standard deviation and in another [9] mean values of DCE parameters were analyzed. There is also another problem, namely the previous analyses investigated small number of patients, namely 12 [22] and 16 [9]. This fact also relativizes the reported results.
We hypothesize that DCE MRI should have more significant correlations with histopathology than reported previously. Especially Ve and Kep should be associated with cellularity. This suggestion seems to be logical. In fact, Ve represents volume of the extravascular extracellular space [23, 24] and, therefore, may be associated with cell count. Furthermore, the assumed correlation between Ve and cellularity should be inversely, namely more cells-less extracellular space and vice versa. In fact, in an experimental study with glioma model, a strong inverse correlation (r = –0.75) between Ve and cellularity could be identified [25].
Similarly, Kep reflects diffusion of contrast medium from the extravascular extracellular space back to the plasma [23, 24], and may also have relationships with tumor cellularity. Previous studies indicated correlations between Ktrans and microvessel density in several malignancies [7, 9]. Also some authors suggested that Ktrans correlated with proliferation activity (KI 67 expression) in hepatocellular carcinoma [26]. However, this did not apply for all lesions [8, 9]. On the other hand, Ktrans reflects diffusion of contrast medium from the plasma through the vessel wall into the interstitial space [23, 24], and, therefore, may also have significant correlations with tumor cell count.
The present study confirmed these assumptions. Here, interestingly phenomena were identified. Proliferation activity slightly correlated with the minimum of Ktrans and Ve and tended to correlate with several percentiles of both parameters. Furthermore, stronger correlations were observed between histogram-based parameters skewness, kurtosis and entropy and different histopathological findings. So kurtosis of Ktrans correlated statistically significant with cell count and tended to correlate with KI 67, and skewness of Ktrans correlated with KI 67. Entropy of Ve correlated with KI 67 expression, cell count, and total nucleic area. Finally, entropy of Kep correlated with KI 67. In contrast to the previous reports, neither standard deviation nor mean values of the investigated perfusion parameters showed significant correlations with histopathological findings. These findings indicated the following: firstly, routinely used perfusion parameters (mean, median or standard deviation) are non sensitive to reflect relationships with cellularity and proliferation activity in HNSCC. Secondly, histogram-based parameters are better associated with proliferation activity, cellularity and nucleic areas in HNSCC. This finding is very important for clinical practice and implicates use of histogram-based DCE MRI parameters to predict histopathological features in HNSCC.
Furthermore, our study identified also another phenomenon, namely associations between perfusion parameters and histopathology is different in different tumor grades. Significantly more correlations and trends are seen in G3 tumors than in low grade lesions. The exact cause of this finding is unclear. Presumably, high grade carcinomas have other architecture, including relationships between tumor cells, especially cell size or volume and extracellular space, as well nucleic-cytoplasmic ratio. Also other features like stroma and microvessel density etc. may also play a role. These factors results in different associations between histopathology and perfusion parameters derived from DCE MRI. Clearly, further works with more cases are needed to confirm this hypothesis. Also search for relevant associations between histogram analysis DCE MRI parameters and other histopathological features like invasiveness should be performed in HNSCC.
In conclusion, histogram analysis DCE MRI parameters are sensitiver than mean DCE MRI values to reflect associations with histopathology in HNSCC. Especially, histogram-based parameters skewness, kurtosis and entropy of Ktrans, Ve, and Kep can be used as surrogate markers for proliferation activity, cellularity and nucleic content in HNSCC. Tumor grading influences significantly associations between perfusion parameters and histopathologic findings.
MATERIALS AND METHODS
This study was IRB-approved and all patients gave their written informed consent.
Patients
Overall, 30 patients (8 women and 22 men, mean age 57.0 ± 10.6 years, range, 33-77 years) with histological proven primary HNSCC were included in the study. The diagnosed tumors were localized in the oropharynx (46.7%), tongue (23.3%), hypopharynx (10%), larynx (16.7%), and nasopharynx (3.3%). Most frequently, the identified lesions were staged as T3 (33.3%) or T4 tumors (40%) with additional nodal (90%) metastases (Table 4). G1/2 tumors were diagnosed in 36.7% and G3 lesions in 63.3%.
Table 4: Localization and stage of the identified tumors
Diagnosis |
n (%) |
Carcinoma of nasopharynx |
1 (3.3) |
Carcinoma of oropharynx |
14 (46.6) |
Carcinoma of hypopharynx |
3 (10) |
Carcinoma of larynx |
5 (16.7) |
Carcinoma of tongue |
7 (23.3) |
Tumor stage |
n (%) |
T stage |
|
T1 |
1 (3.3) |
T2 |
7 (23.3) |
T3 |
10 (33.3) |
T4 |
12 (40) |
N stage |
n (%) |
N0 |
3 (10) |
N1 |
5 (16.7) |
N2 |
19 (63.3) |
N3 |
3 (10) |
M stage |
n (%) |
M0 |
28 (93.3) |
M1 |
2 (6.7) |
Tumor grading |
n (%) |
G1 |
1 (3.3) |
G2 |
10 (33.3) |
G3 |
19 (63.3) |
DCE MRI
In all patients dynamic contrast-enhanced (DCE) imaging of the neck was performed. In every case, dynamic T1w DCE sequences (TR/TE 2.47/0.97 ms, slice thickness 5 mm, flip angle 8° C, voxel size 1.2 × 1.0 × 5.0 mm) included 40 subsequent scans à 6 seconds were applicated. Intravenous administration of contrast medium (Gadovist®, Bayer Healthcare, Leverkusen, Germany) in a dose of 0.1 mmol per kg of body weight was started after the fifth scan at a rate of 3 ml per second and flushing with 10 ml of normal saline using a power injector (Spectris Solaris, Medrad, Bayer Healthcare, Leverkusen, Germany). Thereafter, all acquired images were transferred to a software module for tissue perfusion estimation (Tissue 4D, Siemens Medical Systems, Erlangen, Germany) as described previously [9, 23, 24]. Though, images of the following pharmacokinetic parameters were saved in DI COM format (Figure 1):
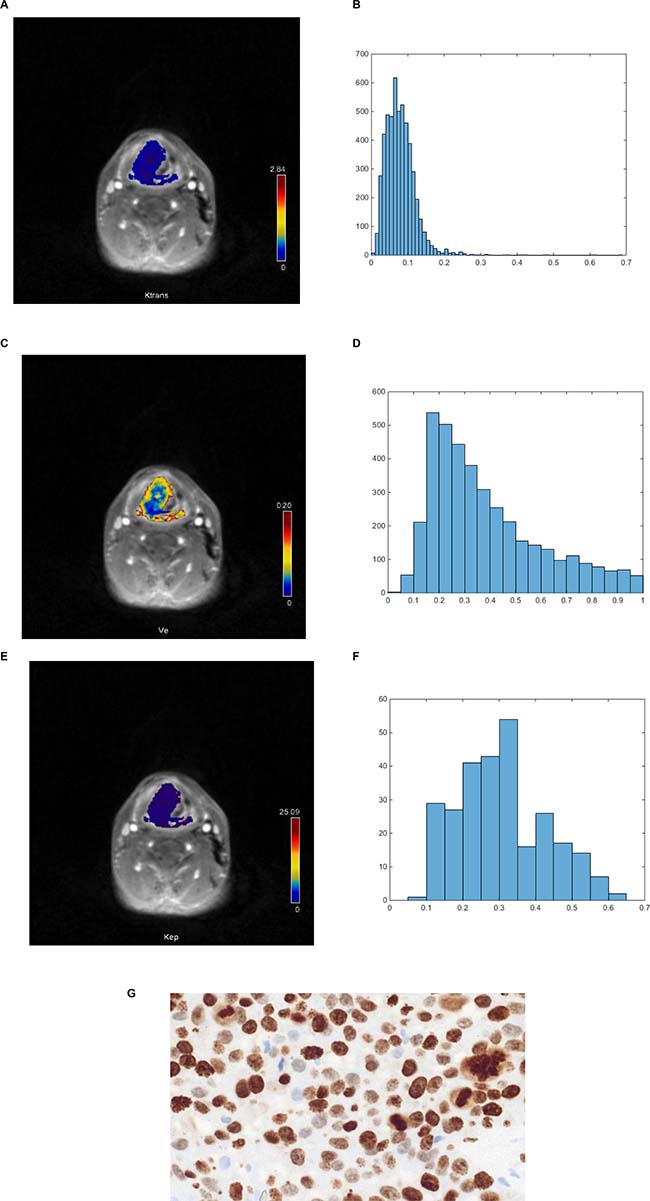
Figure 1: DCE MRI and histopathological findings in a patient with histologically proven squamous cell carcinoma of the oropharynx. (A) Ktrans map of the tumor. (B) Histogram of Ktrans values. The histogram analysis parameters (min-1) are as follows: mean = 0.078, min = 0.014, max = 0.672, P10 = 0.039, P25 = 0.05, P75 = 0.094, P90 = 0.129, median = 0.07, mode = 0.048, kurtosis = 4.48, skewness = 3.85, entropy = 2.71. (C). Ve map of the tumor. (D) Histogram of Ve values. Estimated histogram analysis parameters are as follows: mean = 0.675, min = 0.343, max = 0.992, P10 = 0.466, P25 = 0.532, P75 = 0.822, P90 = 0.929, median = 0.657, mode = 0.475, kurtosis = 1.96, skewness = 0.248, entropy = 2.63. (E) Kep map of the tumor. (F) Histogram of Kep values. Estimated histogram analysis parameters (min-1) are as follows: mean = 0.399, min = 0.14, max = 0.72, P10 = 0.23, P25 = 0.3, P75 = 0.49, P90 = 0.54, median = 0.41, mode = 0.47, kurtosis = 2.47, skewness = 0.059, entropy = 3.31. (G). Immunohistochemical stain (MIB-1 monoclonal antibody). Ki 67 index = 90%, cell count = 150, total nucleic area = 46424 μm², average nucleic area = 310 μm².
• Ktrans or volume transfer constant representing the diffusion of contrast medium from the plasma through the vessel wall into the interstitial space;
• Ve or volume of the extravascular extracellular space (EES);
• Kep or parameter for diffusion of contrast medium from the EES back to the plasma.
On the next step, the saved DI COM images were processed offline with custom-made Matlab-based application (The Mathworks, Natick, MA, USA). Thereafter, polygonal ROIs were automatically drawn on all of the transferred maps along the contours of the primary tumor on each slice (whole lesion measure) according to the previous description [12]. For every perfusion parameter (Ktrans, Ve, and Kep), mean, maximal, minimal, and median values, as well percentiles 10th, 25th, 75th, and 90th were estimated (Figure 1) according to our previous description (). Furthermore, histogram-based characteristics: kurtosis, skewness, and entropy were also calculated.
Histopathological analysis
In every case, sections from formalin-fixed and paraffin-embedded tissue were cut at 5 μm and stained with Ki 67 antigen (MIB-1 monoclonal antibody, DakoCytomation, Denmark). Thereafter, the histopathological images were digitalized by using the Pannoramic microscope scanner (Pannoramic SCAN, 3DHISTECH Ltd., Budapest, Hungary) with Carl Zeiss objectives. In every case, the whole sample was acquired at high resolution. Via the integrated Pannoramic Viewer 1.15.4 (open source software, 3D HISTECH Ltd., Budapest, Hungary) the acquired slides were evaluated and three captures with a magnification of ×200 were extracted and saved as uncompressed Tagged Image File Format (TIFF). Furthermore, the digitalized images were analyzed by using ImageJ software 1.48v (National Institutes of Health Image program) with a Windows operating system [27–30]. For this study, the following histopathological parameters were calculated:
• Tumor proliferation index as relation of KI 67 stained nuclei divided by all nuclei [25, 26]. Though for the analysis the area with the highest number of positive tumor nuclei was selected (Figure 1);
• Cell count as a number of all nuclei;
• Total nucleic area (μm²) as area of all nuclei;
• Average nucleic area (μm²) as a total nucleic area divided by number of nuclei.
Statistical analysis
Statistical analysis and graphics creation was performed with SPSS 22 (IBM SPSS Statistics for Windows, version 22.0, Armonk, NY: IBM corporation). Values are presented as mean ± standard deviation (SD). The distribution of the acquired data was tested by Shapiro-Wilk test. Mean value comparison was carried out using the Mann-Whitney-U test. Spearman’s non-parametric rank correlation coefficients were calculated between DCE and different histopathological parameters. Significance level was set at p ≤ 0.05.
CONFLICTS OF INTEREST
None to declare.
REFERENCES
1. Bernstein JM, Homer JJ, West CM. Dynamic contrast-enhanced magnetic resonance imaging biomarkers in head and neck cancer: potential to guide treatment? A systematic review. Oral Oncol. 2014; 50:963–970.
2. van Niekerk CG, van der Laak JA, Hambrock T, Huisman HJ, Witjes JA, Barentsz JO, Hulsbergen-van de Kaa CA. Correlation between dynamic contrast-enhanced MRI and quantitative histopathologic microvascular parameters in organ-confined prostate cancer. Eur Radiol. 2014; 24:2597–2605.
3. Noij DP, de Jong MC, Mulders LG, Marcus JT, de Bree R, Lavini C, de Graaf P, Castelijns JA. Contrast-enhanced perfusion magnetic resonance imaging for head and neck squamous cell carcinoma: a systematic review. Oral Oncol. 2015; 51:124–138.
4. Puech P, Potiron E, Lemaitre L, Leroy X, Haber GP, Crouzet S, Kamoi K, Villers A. Dynamic contrast-enhanced-magnetic resonance imaging evaluation of intraprostatic prostate cancer: correlation with radical prostatectomy specimens. Urology. 2009; 74:1094–1099.
5. Choi HS, Kim AH, Ahn SS, Shin NY, Kim J, Lee SK. Glioma grading capability: comparisons among parameters from dynamic contrast-enhanced MRI and ADC value on DWI. Korean J Radiol. 2013; 14:487–492.
6. Li X, Zhu Y, Kang H, Zhang Y, Liang H, Wang S, Zhang W. Glioma grading by microvascular permeability parameters derived from dynamic contrast-enhanced MRI and intratumoral susceptibility signal on susceptibility weighted imaging. Cancer Imaging. 2015; 15:4
7. Li L, Wang K, Sun X, Wang K, Sun Y, Zhang G, Shen B. Parameters of dynamic contrast-enhanced MRI as imaging markers for angiogenesis and proliferation in human breast cancer. Med Sci Monit. 2015; 21:376–382.
8. Jain KK, Sahoo P, Tyagi R, Mehta A, Patir R, Vaishya S, Prakash N, Vasudev N, Gupta RK. Prospective glioma grading using single-dose dynamic contrast-enhanced perfusion MRI. Clin Radiol. 2015; 70:1128–1135.
9. Surov A, Meyer HJ, Gawlitza M, Höhn AK, Boehm A, Kahn T, Stumpp P. Correlations Between DCE MRI and Histopathological Parameters in Head and Neck Squamous Cell Carcinoma. Transl Oncol. 2017; 10:17–21.
10. Schob S, Meyer HJ, Pazaitis N, Schramm D, Bremicker K, Exner M, Höhn AK, Garnov N, Surov A. ADC Histogram Analysis of Cervical Cancer Aids Detecting Lymphatic Metastases-a Preliminary Study. Mol Imaging Biol. 2017; 19:953–62.
11. Schob S, Meyer HJ, Dieckow J, Pervinder B, Pazaitis N, Höhn AK, Garnov N, Horvath-Rizea D, Hoffmann KT, Surov A. Histogram Analysis of Diffusion Weighted Imaging at 3T is Useful for Prediction of Lymphatic Metastatic Spread, Proliferative Activity, and Cellularity in Thyroid Cancer. Int J Mol Sci. 2017; 18:E821.
12. Meyer HJ, Leifels L, Schob S, Garnov N, Surov A. Histogram analysis parameters identify multiple associations between DWI and DCE MRI in head and neck squamous cell carcinoma. Magn Reson Imaging. 2018; 45:72–77.
13. Liu S, Zhang Y, Chen L, Guan W, Guan Y, Ge Y, He J, Zhou Z. Whole-lesion apparent diffusion coefficient histogram analysis: significance in T and N staging of gastric cancers. BMC Cancer. 2017; 17:665.
14. Lee JY, Ahn KJ, Lee YS, Jang JH, Jung SL, Kim BS. Differentiation of grade II and III oligodendrogliomas from grade II and III astrocytomas: a histogram analysis of perfusion parameters derived from dynamic contrast-enhanced (DCE) and dynamic susceptibility contrast (DSC) MRI. Acta Radiol. 2017; :284185117728981. https://doi.org/10.1177/0284185117728981.
15. Park M, Kim J, Choi YS, Lee SK, Koh YW, Kim SH, Choi EC. Application of Dynamic Contrast-Enhanced MRI Parameters for Differentiating Squamous Cell Carcinoma and Malignant Lymphoma of the Oropharynx. AJR Am J Roentgenol. 2016; 206:401–7.
16. Ng SH, Lin CY, Chan SC, Yen TC, Liao CT, Chang JT, Ko SF, Wang HM, Huang SF, Lin YC, Wang JJ. Dynamic contrast-enhanced MR imaging predicts local control in oropharyngeal or hypopharyngeal squamous cell carcinoma treated with chemoradiotherapy. PLoS One. 2013; 8:e72230
17. Van Cann EM, Rijpkema M, Heerschap A, van der Bilt A, Koole R, Stoelinga PJ. Quantitative dynamic contrast-enhanced MRI for the assessment of mandibular invasion by squamous cell carcinoma. Oral Oncol. 2008; 44:1147–54.
18. Kim S, Loevner LA, Quon H, Kilger A, Sherman E, Weinstein G, Chalian A, Poptani H. Prediction of response to chemoradiation therapy in squamous cell carcinomas of the head and neck using dynamic contrast-enhanced MR imaging. AJNR Am J Neuroradiol. 2010; 31:262–268.
19. Chawla S, Kim S, Loevner LA, Hwang WT, Weinstein G, Chalian A, Quon H, Poptani H. Prediction of disease-free survival in patients with squamous cell carcinomas of the head and neck using dynamic contrast-enhanced MR imaging. AJNR Am J Neuroradiol. 2011; 32:778–84.
20. Chan SC, Cheng NM, Hsieh CH, Ng SH, Lin CY, Yen TC, Hsu CL, Wan HM, Liao CT, Chang KP, Wang JJ. Multiparametric imaging using 18F-FDG PET/CT heterogeneity parameters and functional MRI techniques: prognostic significance in patients with primary advanced oropharyngeal or hypopharyngeal squamous cell carcinoma treated with chemoradiotherapy. Oncotarget. 2017; 8:62606–21. https://doi.org/10.18632/oncotarget.15904.
21. Guo W, Luo D, Chen X, Lin M, Li L, Zhao Y, Yang L, Hu L, Zhao X, Zhou C. Dynamic contrast-enhanced magnetic resonance imaging for pretreatment prediction of early chemo-radiotherapy response in larynx and hypopharynx carcinoma. Oncotarget. 2017; 8:33836–33843. https://doi.org/10.18632/oncotarget.12952.
22. Jansen JF, Carlson DL, Lu Y, Stambuk HE, Moreira AL, Singh B, Patel SG, Kraus DH, Wong RJ, Shaha AR, Shah JP, Shukla-Dave A. Correlation of a priori DCE-MRI and (1)H-MRS data with molecular markers in neck nodal metastases: Initial analysis. Oral Oncol. 2012; 48:717–22.
23. Gawlitza M, Purz S, Kubiessa K, Boehm A, Barthel H, Kluge R, Kahn T, Sabri O, Stumpp P. In vivo correlation of glucose metabolism, cell density and microcirculatory parameters in patients with head and neck cancer: Initial results using simultaneous PET/MRI. PLoS One. 2015; 10:e0134749.
24. Bisdas S, Seitz O, Middendorp M, Chambron-Pinho N, Bisdas T, Vogl TJ, Hammerstingl R, Ernemann U, Mack MG. An exploratory pilot study into the association between microcirculatory parameters derived by MRI-based pharmacokinetic analysis and glucose utilization estimated by PET-CT imaging in head and neck cancer. Eur Radiol. 2010; 20:2358–2366.
25. Aryal MP, Nagaraja TN, Keenan KA, Bagher-Ebadian H, Panda S, Brown SL, Cabral G, Fenstermacher JD, Ewing JR. Dynamic contrast enhanced MRI parameters and tumor cellularity in a rat model of cerebral glioma at 7 T. Magn Reson Med. 2014; 71:2206–2214.
26. Chen J, Chen C, Xia C, Huang Z, Zuo P, Stemmer A, Song B. Quantitative free-breathing dynamic contrast-enhanced MRI in hepatocellular carcinoma using gadoxetic acid: correlations with Ki67 proliferation status, histological grades, and microvascular density. Abdom Radiol (NY). 2017 Sep 22. [Epub ahead of print]. https://doi.org/10.1007/s00261-017-1320-3.
27. Surov A, Caysa H, Wienke A, Spielmann RP, Fiedler E. Correlation between different ADC fractions, cell count, Ki-67, total nucleic areas and average nucleic areas in meningothelial meningiomas. Anticancer Res. 2015; 35:6841–6846.
28. Surov A, Meyer HJ, Höhn AK, Behrmann C, Wienke A, Spielmann RP, Garnov N. Correlations between intravoxel incoherent motion (IVIM) parameters and histological findings in rectal cancer: preliminary results. Oncotarget. 2017; 8:21974–83. https://doi.org/10.18632/oncotarget.15753.
29. Surov A, Stumpp P, Meyer HJ, Gawlitza M, Hoehn AK, Boehm A, Sabri O, Kahn T, Purz S. Simultaneous 18F-FDG-PET/MRI: Associations between diffusion, glucose metabolism and histopathological parameters in patients with head and neck squamous cell carcinoma. Oral Oncol. 2016; 58:14–20.
30. Aoyagi T, Shuto K, Okazumi S, Hayano K, Satoh A, Saitoh H, Shimada H, Nabeya Y, Kazama T, Matsubara H. Apparent diffusion coefficient correlation with oesophageal tumour stroma and angiogenesis. Eur Radiol. 2012; 22:1172–7.