
INTRODUCTION
Endometrial cancer (EC) is the most common gynaecologic malignancy in the Western world. In the USA in particular, it is the fourth most common cancer in females, with rising incidence and reduced survival [1]. There is strong evidence to suggest that race has an influence in the prognosis of the disease. Black women have a 19-23% lower risk of developing the disease over their lifetime; however, EC incidence in black women has been increasing and their rates even surpass those of Caucasians when correcting for hysterectomy [2, 3]. Furthermore, they tend to have worse outcome and almost double the mortality rate of Caucasian women [4], along with much higher incidence of Type 2 tumors [5], conferring a significantly worse prognosis. Many factors have been proposed as contributing to the poor outcome observed in Black or African American (BoAA) women, including socioeconomic, biologic, access to healthcare and treatment [6]. Among biologic factors, higher prevalence of PTEN mutations in Caucasian women has been reported [7] and these are considered to offer better prognosis [8]. Microsatellite instability (MSI) is three times more common in the tumors of Caucasians compared to BoAA women [9]; whereas BoAA women have higher incidence of TP53 mutations [10], thought to be related to higher incidence of Type 2 tumors in these patients. Racial differences have also been seen with PIK3CA and KRAS mutations being seen more frequently in BoAA women as compared to Caucasian women in low-grade endometrioid EC [11]. Unlike the breadth of knowledge regarding the comparison between BoAA and Caucasian women, much less is known about other ethnic minority groups, for example, Asian. The incidence of EC is almost 30% less in this group compared to Caucasians [1] and women tend to present younger at diagnosis but are reported to have a slightly better outcome [12].
Despite these disparities, little is known regarding the mutational landscape of EC between races. To address this, we investigated the molecular features of EC, including somatic mutations, gene expression, and copy-number aberrations (CNAs) and contrasted them between tumours from BoAA, Caucasian and Asian women to examine differences in EC disease/molecular profile and overall survival.
RESULTS
Population-based analysis
The TCGA dataset comprised of 374 Caucasian, 109 BoAA, and 20 Asian patients. Using a multinomial logistic regression model and Caucasians as the reference model: Asian patients were diagnosed at a significantly younger age (OR 3.43; 95% CI, 1.34-8.6; p=0.011). BoAA women were more likely to be diagnosed with serous-type tumors (OR 2.06; 95% CI 1.25-3.36; p=0.008) and have higher BMI (OR 2.94; 95% CI, 1.42-6.89; p=0.0008) (Table 1). There was no significant difference in overall or progression-free survival between races using a Cox-proportional hazards model.
Table 1: Description of endometrial cancer cohort
|
Characteristic |
Sub-category |
Caucasian (n=374) |
Asian (n=20) |
p |
OR (95% CI) |
BoAA (n=109) |
p |
OR (95% CI) |
|---|---|---|---|---|---|---|---|---|
|
Age at diagnosis |
≤55 |
72 (19.3) |
9 (45) |
0.011 |
3.432 (1.338-8.6) |
16 (14.7) |
0.27 |
0.722 (0.389-1.272) |
|
>55 |
302 (80.7) |
11 (55) |
- |
- |
93 (85.3) |
- |
- |
|
|
BMI |
Obese |
211 (56.4) |
7 (35) |
0.19 |
0.351 (0.1164-NA) |
67 (61.5) |
0.0008 |
2.937 (1.420-6.887) |
|
Overweight |
73 (19.5) |
6 (30) |
- |
0.869 (0.268-NA) |
22 (20.2) |
- |
2.788 (1.207-7.042) |
|
|
Underweight |
3 (0.8) |
0 (0) |
- |
NA |
0 (0) |
- |
NA |
|
|
Unknown |
13 (3.5) |
0 (0) |
- |
NA |
12 (11) |
- |
8.539 (2.988-25.966) |
|
|
Normal |
74 (19.8) |
7 (35) |
- |
- |
8 (7.3) |
- |
- |
|
|
Clinical stage |
I |
245 (65.5) |
14 (70) |
- |
- |
57 (52.3) |
- |
- |
|
II |
33 (8.8) |
3 (10) |
- |
1.061 (0.162-4.025) |
12 (11.) |
- |
1.563 (0.735-3.144) |
|
|
III |
79 (21.1) |
2 (15) |
- |
0.665 (0.15-2.1) |
32 (29.4) |
- |
1.741 (1.047-2.864) |
|
|
IV |
17 (4.6) |
1 (5) |
0.93 |
1.029 (0.055-5.615) |
8 (7.3) |
0.094 |
2.023 (0.792-4.79) |
|
|
Histologic grade |
G1 |
75 (20.1) |
6 (30) |
- |
- |
14 (12.8) |
- |
- |
|
G2 |
88 (23.5) |
4 (20) |
- |
0.568 (0.141-2.063) |
26 (23.9) |
- |
1.583 (0.781-3.32) |
|
|
G3 |
211 (56.4) |
10 (50) |
0.59 |
0.592 (0.213-1.793) |
69 (63.3) |
0.2 |
1.803 (0.995-3.41) |
|
|
Histologic type |
Endometrioid |
293 (78.3) |
17 (85) |
- |
- |
69 (63.3) |
- |
- |
|
Serous |
68 (18.2) |
3 (15) |
0.46 |
0.76 (0.174-2.344) |
33 (30.3) |
0.008 |
2.061 (1.252-3.356) |
|
|
Mixed |
13 (3.5) |
0 (0) |
- |
NA |
7 (6.4) |
- |
2.287 (0.832-5.803) |
Characteristics showing evidence of racial disparity included age at diagnosis, BMI, and histologic type (p<0.05), but no statistically significant differences for histologic grade. Clinical stage exhibited a trend toward racial disparity. All p values and odds ratios (ORs) are derived from χ2 ANOVA on a multinomial logistic regression model with race as outcome, with levels ordered as Caucasian, BoAA, and Asian. Reference categories for reference models: race, Caucasian; age at diagnosis, >55; BMI, normal; clinical stage, stage I; histologic grade, G1; histologic type, endometrioid.
RNA and microRNA expression
Tumor histologic type/grade, clinical stage, and BMI were statistically significant drivers of variation in the RNA-seq expression data (Spearman’s Rho to PC1 eigenvalues; P<0.001). In miRNAs, the same plus age at diagnosis were statistically significant at the same level of significance but to PC2. 4933 transcripts (8.52%) were identified as differentially expressed between tumour and normal samples. Of the 4933 transcripts differentially expressed in tumours compared to normal tissue, pairwise comparisons between each race then revealed 44 transcripts (0.076%) differentially expressed between BoAAs and Caucasians, 131 (0.23%) between BoAAs and Asians, and 78 (0.14%) between Asians and Caucasians (Supplementary Tables 1-3). The top differentially expressed genes for each group were UTF1 in BoAA tumors compared to Caucasian; SLC14A2 in BoAA compared to Asian tumors and GSTA1 in Asian tumors compared to Caucasian.
Two hundred and eighty miRNAs (17.24%) were identified as differentially expressed between tumour and normal samples. Pairwise comparisons of miRNAs differential expressed between tumors and normal samples were then compared in each race, filtering on an FDR Q< 0.05 and log fold change >2. Expression of a single miRNA (miR1269b) was significantly increased in BoAA tumors compared to both Caucasian and Asian tumors. Three miRNAs (miR1269a, miR891a and miR892a) were significantly decreased in Asian tumors compared to Caucasian tumors.
Somatic mutations and recurrent somatic copy number alterations (SCNA)
Excluding variants identified in an unpaired panel of normals, 833,034 mutations were identified including 604,192 (1,669/tumor) in Caucasian tumors, 136,009 (1,283/tumor) in BoAAs, and 92,833 (4,642/tumor) in Asian samples. The most frequently mutated gene in tumors from Caucasian and Asian women was PTEN (63% and 85%, respectively); however, the specific mutations they contained differed in frequency: PTEN p.Arg130Gly was more common in tumors from Caucasian women and PTEN p.Arg130Gln in Asian cases (Supplementary Table 4). The most frequently mutated gene in BoAAs was TP53 (49%) whereas KRAS p.Gly12Asp was the most frequent individual mutation. Of note, observing mutation frequencies across the 12 top mutated genes from the original TCGA study (i.e., PTEN, PIK3CA, ARID1A, TP53, CTNNB1, CTCF, KRAS, PIK3R1, FBXW7, PPP2R1A, ARID5B, and RPL22), we observed statistically significant differences across ethnicities (χ2 P=0.002) (Table 2). For SCNA analysis, clear major chromosomal abnormalities existed between Caucasian and BoAA tumors, including recurrent deletions at chromosome 3p in Caucasians and amplification of chr1q and deletions in chr16 in BoAAs (Figure 1).
Table 2: Recurrently mutated genes differing by ethnicity
|
Caucasian |
Asian |
BoAA |
|||
|---|---|---|---|---|---|
|
Gene |
n (%) |
Gene |
n (%) |
Gene |
n (%) |
|
PTEN |
229 (63.26) |
PTEN |
17 (85) |
TP53 |
52 (49.06) |
|
PIK3CA |
181 (50) |
PIK3CA |
13 (65) |
PTEN |
41 (38.68) |
|
ARID1A |
159 (43.92) |
ARID1A |
9 (45) |
PIK3CA |
41 (38.68) |
|
TP53 |
115 (31.77) |
PIK3R1 |
6 (30) |
ARID1A |
30 (28.3) |
|
CTNNB1 |
98 (27.07) |
ARID5B |
6 (30) |
FBXW7 |
24 (22.64) |
|
CTCF |
86 (23.76) |
CTNNB1 |
6 (30) |
CTCF |
20 (18.87) |
|
KRAS |
76 (21) |
TP53 |
5 (25) |
PIK3R1 |
18 (16.98) |
|
PIK3R1 |
71 (19.61) |
KRAS |
5 (25) |
CTNNB1 |
17 (16.04) |
|
FBXW7 |
64 (17.68) |
CTCF |
5 (25) |
KRAS |
15 (14.15) |
|
PPP2R1A |
62 (17.13) |
FBXW7 |
3 (15) |
PPP2R1A |
13 (12.26) |
|
ARID5B |
50 (13.81) |
RPL22 |
3 (15) |
ARID5B |
12 (11.32) |
|
RPL22 |
41 (11.33) |
PPP2R1A |
2 (10) |
RPL22 |
8 (7.55) |
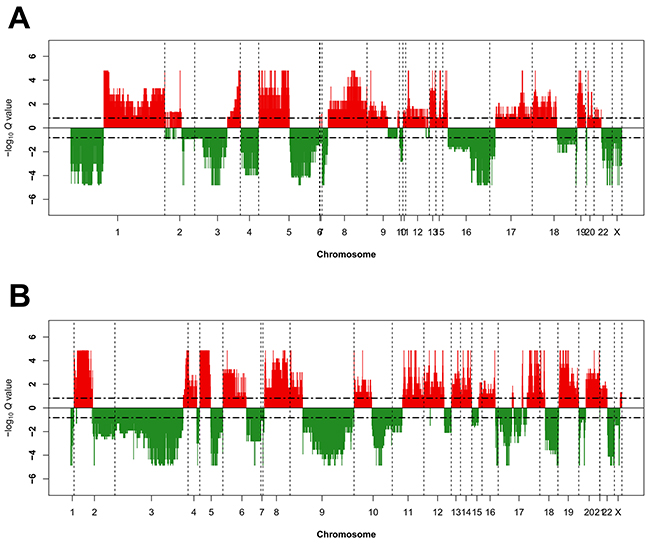
Figure 1: Recurrent genome-wide SNCAs in each race. Genome-wide amplifications and deletions in BoAAs (A) and Caucasians (B). Recurrent SCNA in the GISTIC 2.0 SCNA data was calculated using GAIA [42] with known common CNV filtered out. Recurrent CNV were defined by FDR Q<0.15 using ten iterations. Genomic SCNA plots were generated using a custom R script, with cut-off defined also at FDR Q<0.15 for the purposes of visualisation. Large genomic differences in recurrent SCNA profiles were observed between each race.
Next, the relationship of race with the 4 TCGA groups (POLE ultramutated, microsatellite instability (MSI) hypermutated, copy-number low, and copy-number high) [13] was investigated. Note that Asian women were removed from this analysis due to small numbers of cases.
Through hierarchical clustering, 4 distinct groups were identified within the BoAA tumors (2 high-degree SCNA and 2 low-degree SCNA) and 5 in the Caucasian cases (2 high-degree SCNA, 1 high/low degree SCNA and 2 low-degree SCNA) (Figure 2). In both races, groupings segregated with histologic type/grade and clinical stage, with serous (BoAA, P=0.00435; Caucasian, P<0.0001), stage III (Caucasian, P=0.00469), and grade 3 (BoAA, P=0.000467; Caucasian, P<0.0001) tumors exhibiting a higher degree of SCNA. One group, seen in both Caucasian (Group 1) and BoAA (Group 3) tumors, was almost entirely absent of statistically significant recurrent SCNA, mainly segregating with endometrioid, stage I, and low-grade tumors.
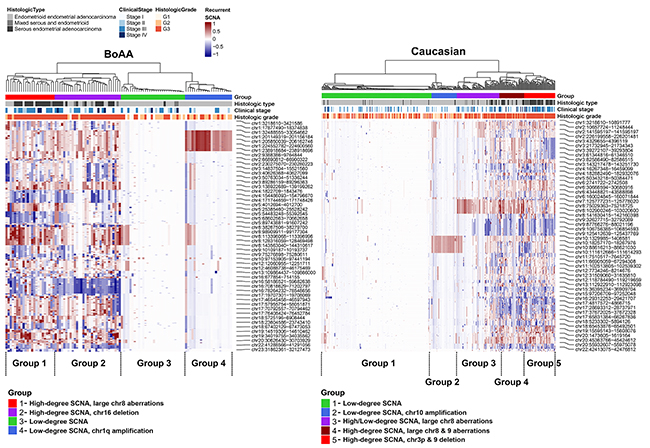
Figure 2: Heatmap of significant SCNA groups in BoAA and Caucasians. Clustering was performed on the copy number segment mean for each recurrent SCNA region passing FDR Q<0.15. Dendrograms were generated using Euclidean distance and Ward’s linkage. To identify groups of SCNA profiles in each race, we cut the dendrogram tree at different heights in order to isolate groups that fit the patterns of SCNA in the heatmap. For heatmap shading, we used a 100-element colour palette of darkblue-to-white-to-darkred and set breaks at -1 and+1.
Comparing the average overall mutations/sample, POLE and RPL22 were more frequently mutated in Caucasian compared to BoAA cases (0.285 versus 0.179, and 0.114 versus 0.085 mutations/sample respectively). The relationship between SCNA groupings and mutation data identified a group in BoAA cases (Group 1), which was dominated by serous tumors (P<0.0001), exhibited mainly TP53 mutations and a had complete absence of POLE or RPL22 mutations (Figure 3A); whereas the other high-degree SCNA group (Group 2) was dominated by different TP53 mutations and also serous tumours (P=0.000374). Both low-degree SCNA groups in BoAAs were almost entirely endometrioid tumors dominated by PTEN mutations. The profiles for the Caucasian cases were quite different, with all SCNA groups harbouring TP53 mutations and Group 5 (High degree SCNA, chr3 and 9 deletion) dominated by serous tumours. The Caucasian tumors contained a sub-group of cases with a high POLE mutation rate (Group 1), which corresponded to the RPL22-mutated sub-group. All the subgroups contained different PTEN mutations, with the exception of Group 5, where PTEN mutations were mostly absent (Figure 3B). Across all SCNA groups in both BoAA and Caucasian tumors, TP53, POLE and RPL22 mutation counts, were significantly different by ANOVA (P<0.05). For most common mutations per group, per race - see Supplementary Table 5.
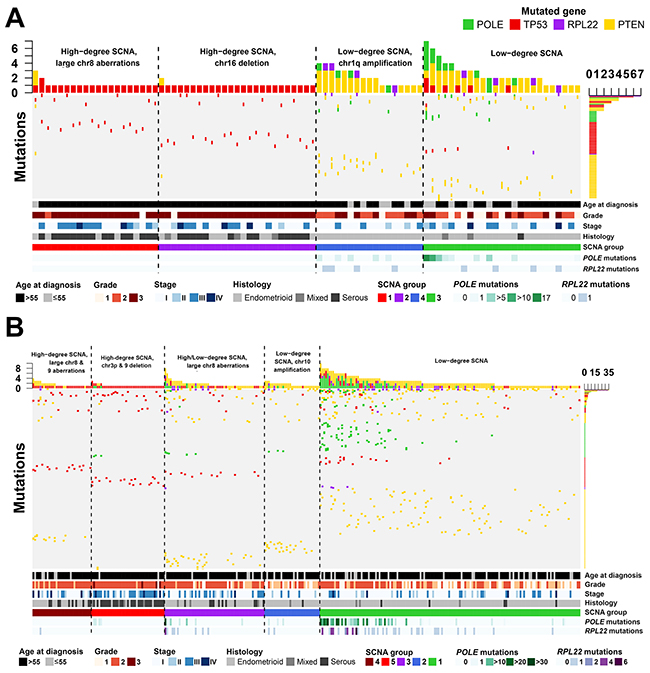
Figure 3: Mutational profiles across endometrial cancers in BoAA and Caucasian patients. Mutation frequencies (vertical axis) are plotted for each tumor (horizontal axis) for BoAAs (A) and Caucasians (B). Details are given regarding patients demographics. Only patients with mutations are illustrated. See Supplementary Table 5 for full details of cohort numbers and groupings.
No significant differences in overall survival was observed between any of the BoAA groups. However, in the Caucasian cases, two groups exhibited statistically significant worse overall survival, both of which harboured high-degree SCNAs: Group 4 (dominated by PPP2R1A mutations (18% of patients in Group 4). HR=1.43; 95% CI, 1.01-2.04; P=0.045) and Group 5 (dominated by TP53, PPP2R1A and GOLGA6L6 mutations. HR=1.43; 95% CI, 1.01-2.04; P=0.045) (Figure 4).
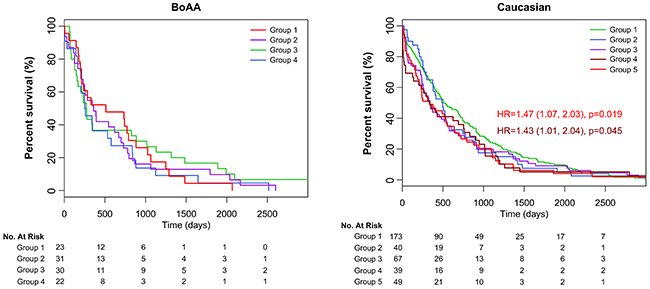
Figure 4: Survival analysis of each group. Kaplain-Meier curves by ethnicity showing 2 groups with significantly poorer outcome in Caucasians.
DNA mismatch repair genes
Lynch syndrome (LS) is one of the most common inherited causes of endometrial cancers [14]. However, in many cases immunohistochemical and/or MSI testing suggests LS but further investigation shows no evidence of germline mutations, with somatic mutations being attributed to up to 70% of mismatch repair (MMR)-deficient colon and endometrial cancers [15]. Analysis of somatic mutations in MMR-associated genes identified an enrichment of somatic mutations in MLH1, MSH2, MSH6 and PMS2 across the 3 racial groups with a higher frequency of mutations in the Asian cases, predominantly missense mutations but also nonsense and silent (Supplementary Figure 1). In particular, PMS2 mutations were found to be significantly enriched (Fisher’s exact test; p=0.0036). Unfortunately, data was not available on the presence of germline MMR mutations and therefore we are not able to comment on the incidence of LS in this cohort.
DISCUSSION
Analysis of the genomic profile of endometrial carcinomas within the TCGA database has led to ground breaking advances in our understanding [13], in particular with the identification of four distinct overarching subtypes. The analysis we have conducted has furthered this understanding by identifying significant differences in genomic profiles between different races, which have potential implications not only for the classification of tumors but also with clinical management by helping to select optimum treatment regimens for patients, and advising on prognosis/screening.
Our results indicate that the four TCGA groups should be viewed as a top-level classification and that performing analysis by race gives additional subgroups within the Caucasian and BoAA populations. It is well recognised that BoAA EC patients have significantly poorer survival compared to Caucasians, which is attributed to a greater proportion of advanced stage, serous-like cancers in the BoAA population [16, 17]. Serous-like EC is associated with TP53 mutations and falls within the TCGA copy number high group. In our analysis we have shown that TP53 mutations were seen more frequently in the BoAA population and although this is not surprising, given the increased prevalence of serous-like cancers in this population, we have also identified two distinct high-copy number subgroups in the BoAA population. The BoAA Group 1 contains high-degree SCNA, large aberrations on chromosome 8 and 2 TP53 mutations (p.Arg273His and p.Arg248Gln), which are known to be common in Type 2 tumors (and thereby confer a poorer prognosis) [18]. The other high SCNA group (Group 2) contains only the TP53 p.Arg273His mutation, but not the additional p.Arg248Gln. It is known that different TP53 mutations confer different functions to the protein in cancer [19]. The TP53 p.Arg273His mutant is known to bind the MRE11 nuclease, resulting in increased genomic instability [20]. However, the TP53 p.Arg248Gln mutant has been associated with metastasis in mouse models [21] and shorter patient survival in an analysis of TCGA data for breast invasive carcinoma, colorectal cancer, glioblastoma, lung squamous cell carcinoma and ovarian serous cystadenocarcinoma [22]. The same study also showed patients harbouring TP53 p.Arg273His mutations have similar survival curves to patients with nonsense mutations. Therefore, it is reasonable to hypothesise that in these 2 groups, the TP53 p.Arg273His mutant may be driving their genomic instability, but it is the TP53 p.Arg248Gln mutation that determines their prognosis.
The finding of a subgroup of BoAA patients harbouring amplification of chr1q is interesting since a recent study has shown amplification at chr1q21.3 to be a biomarker for breast cancer relapse [23]. This region encodes a number of S100A-family proteins, which have been shown to drive tumorsphere growth via a reciprocal feedback loop that can be disrupted using the JAK inhibitor, Pacritinib [23]. Furthermore, they have also been shown to activate the epithelial-to-mesenchymal phenotype and promote cell migration and invasion [24]. This therefore may present a personalised approach for treatment of patients harbouring this amplification.
In Caucasian SCNA groups with significantly poorer survival (Groups 4 and 5), both groups contained a number of PPP2R1A mutations including p.Pro179Arg, p.Ser256Phe and p.Trp257Leu, all 3 of which have been implicated in promoting malignant cell growth [25]. Furthermore, the p.Trp257Gly mutation has also been shown to increase cancer cell migration through the SRC-JNK-c-Jun pathway [26]. PPP2R1A mutations are known to be enriched in serous EC tumors, and therefore it is not surprising to see the 2 groups enriched for these mutations are predominated by serous ECs. Group 5 also contained a number of GOLGA6L6 mutations. To our knowledge, no literature exists detailing any of the mutations highlighted in this study and may be a novel avenue for investigation.
Differential expression was observed in key EC-associated genes between the Caucasian and BoAA cases; however, our analysis has identified several genes that have not been previously recognised to play a role in EC carcinogenesis. UTF1 had the greatest differential RNA expression between the BoAA and Caucasian populations. Increased expression of UTF1 (resulting from hypermethylation of its promoter) has been suggested as a biomarker of cervical cancer diagnosis, with inhibition of DNA methyltransferase by 5-aza-2′-deoxycytidine (also known as Decitabine) reducing UTF1 gene methylation and expression in two cervical cancer cell lines [27]. Furthermore, SLC14A2, which was significantly higher in both BoAA and Caucasian tumours compared to Asian cases has been shown to be down-regulated in chemotherapy-resistant ovarian cancer cell lines [28], suggesting potential race-specific targets for treatment. The estrogen-target gene TFF1 was upregulated in BoAA tumors. TFF1 is known to play a role in breast cancer development [29] and bone metastasis [30], has also been suggested as a poor prognostic indicator associated with lymph node metastasis in pancreatic cancer [31]. A previous study has shown that a combination of the progestin medroxyprogesterone acetate (MPA) and the Ras inhibitor S-farnesylthiosalicylic acid (FTS, also known as Salirasib) inhibited tumor growth and enhanced type 2 EC cell death by reducing expression of ER-target genes, including TFF1 [32]. Since a large proportion of BoAA tumors are type 2 ECs, this presents a promising strategy for therapy in these patients.
BoAA tumours had higher levels of miR1269b, which has been shown to be increased in hepatocellular carcinoma (HCC) and promotes HCC cell growth by down-regulating FOXA1 [33]. Furthermore, miR1269b has been shown to target and enhance expression of the cell cycle regulator CDC40, known to mediate proliferation and migration of HCC cells [34]. This finding presents another novel target for therapeutic intervention in the BoAA population.
The high frequency of somatic mutations in MMR genes in the Asian compared to the Caucasian/BoAA groups is potentially of clinical importance, and could possibly explain the much higher number of mutations in the Asian cohort and the younger age at diagnosis. Somatic mutations of MMR genes can arise in cases without a germline mutation and although hypermethylation of MLH1, EPCAM germline mutations and MSH2 inversions have been identified as likely causes in the majority of cases they do no explain all the cases [35, 36]. In a recent study, deficiency in mismatch repair pathways has been shown to predict response of solid tumours (including endometrial cancers) to PD-1 blockade [37]. Furthermore, epithelial ovarian cancers with MMR-deficiencies were more sensitive to the PARP inhibitor Olaparib [38]. This offers a promising treatment strategy for patients enriched for MMR-deficient ECs and indeed, treatment for MSI-high or MMR-deficient tumours has recently been approved by the FDA.
Limitations
The primary limitation of this study is the unequal number of cases from the different racial groups within the cohort. In some analyses this has resulted in insufficient statistical power between the three groups, for example to confirm a significant difference between MMR gene mutations between the Asian and Caucasian/BoAA populations. Also, the terms ‘Caucasian’, ‘BoAA’ and ‘Asian’ encompasses people from huge geographical areas and since there is a lack of sub-regional information on the cases included in the dataset it is not possible to determine whether certain populations may be over represented in each group. Further work is needed with larger patient numbers to determine whether the genetic profile seen particularly in the Asian group is representative of this population as a whole or whether defined subpopulations are at greater risk. Furthermore, admixture is likely present and unable to be accounted for in this dataset, but may introduce variability. Thirdly, the confounding factor of medical insurance and socioeconomic status on cancer outcomes has been reported previously and potentially could have an impact on patient survival. However, treatments received, age, type of surgery, etc. could all affect overall survival, and are unadjusted for in this study. Despite this, our results support findings from other studies of a racial disparity in EC survival.
CONCLUSIONS
In summary, we have identified clear differences in the molecular portraits in EC from Caucasian, BoAA and Asian patients. The results have implications for patient management by enabling tumors to be classified into subgroups, in addition to the four TCGA groups, that carry significant prognostic information.
MATERIALS AND METHODS
Study cohort
Open access data on Uterine Corpus Endometrial Carcinoma was accessed (01/07/2017) from The Cancer Genome Atlas (TCGA) https://portal.gdc.cancer.gov/ [13]. Race was categorised according to the TCGA groupings of Caucasian, Black or African American (BoAA) and Asian. Other racial groups were excluded due to the small patient numbers. Somatic copy number alteration (SCNA) data minus germline SCNA was produced using GISTIC 2.0 from the Broad Institute of Harvard and MIT’s FireBrowse (http://firebrowse.org/). Raw data was produced as described previously [13].
RNA- and microRNA-seq
We processed mRNA Illumina Genome Analyzer RNA-seq raw counts covering 507 tumour samples and 60,483 transcripts, and micro-RNA (miRNA) Illumina HighSeq raw counts covering 501 samples and 1,881 miRNAs, using R Programming Language (R) [39]. Transcripts with 0 counts across all samples were removed. Normalisation and variance stabilising transformation were conducted using the DESeq2 package [40], with age at diagnosis, BMI, race, and histologic type included as factors likely to bias counts. Outlier samples were identified by visual observation of principal component 1 (PC1) and PC2. Correlation of clinical parameters to PCs was conducted using a customised level plot function and incorporated Spearman Rank correlation coefficients, with p-values derived by t-test. Differential expression (DE) analysis was conducted using DESeq2 with p-values adjusted by false discovery rate (FDR). Three comparisons between each race and all other races was performed. Quality control (QC) of DE results was conducted using customised functions to generate MA and volcano plots, and also inspection of Cook’s distance and plots of mean of normalised counts versus p-value. Clustering with heatmap was performed using the ComplexHeatmap package [41] and included all variance stabilised counts for differentially expressed transcripts at 5% FDR and log2FC>2. Prior to heatmap generation, partitioning around medoids (PAM) was performed on transcripts using default parameters, with defined clusters used to break-up the transcript dendrogram and heatmap. Counts were converted to Z-scores prior to clustering. For transcript and sample dendrograms, Euclidean distance and Ward’s linkage were used.
Somatic mutation and copy number aberrations
Data for a total of 488 patients was available for somatic mutations and 474 patients for somatic CNA (SCNA), respectively. From the somatic mutation data, we filtered out mutations called in a panel of 258 normals used by the Broad Institute (indicated by ‘FILTER’ flag). We included all mutation types in the analysis, including gene coding, UTR, and promoter region and labelled each with HGVS protein ID where available. Recurrent SCNA in the GISTIC 2.0 SCNA data was calculated separately for each race using GAIA [42] by first building a copy number variant (CNV) matrix of regions used by GISTIC 2.0, less known common CNV (available at ftp://ftp.broadinstitute.org/pub/GISTIC2.0/hg19_support/). Recurrent CNV were defined by FDR Q<0.15 using ten iterations. Genomic SCNA plots were generated using a custom R script, with cut-off defined also at FDR Q<0.15. Transcripts overlapping recurrent SCNA were defined using the biomaRt [43] and GenomicRanges [44] packages in R, with “ENSEMBL_MART_ENSEMBL”, “grch37.ensembl.org”, “/biomart/martservice”, and “hsapiens_gene_ensembl” set as the biomart, host, path, and dataset, respectively.
SCNA groupings
For defining SCNA groups, we performed PAM using the copy number segment mean called per sample in each region that passed FDR Q<0.15. Overlap of each region was performed using GenomicRanges. For Caucasians, we selected a PAM cluster solution of five; for BoAAs, we selected four. Clustering and heatmap generation was performed using the ComplexHeatmap package [41]. Dendrograms were generated using Euclidean distance and Ward’s linkage. These groupings were then aligned with the 4 EC categories identified by the TCGA [13] by calculating individual mutation frequencies in each race and each identified SCNA group.
Overall survival analysis
Kaplan-Meier survival was performed using the survcomp package in R [45]. Overall survival (OS) was compared between each SCNA grouping. Overall survival was defined using the ‘days_to_last_follow-up’ parameter in the TCGA metadata. P values and hazard ratios were derived from a Cox proportional hazards regression model by comparing each curve to the low SCNA group, i.e., the clinically-favourable group, respectively, for BoAA and Caucasians.
CONFLICTS OF INTEREST
The authors declare no conflicts of interest.
REFERENCES
1. Jemal A, Ward EM, Johnson CJ, Cronin KA, Ma J, Ryerson B, Mariotto A, Lake AJ, Wilson R, Sherman RL, Anderson RN, Henley SJ, Kohler BA, et al. Annual report to the nation on the status of cancer, 1975-2014, featuring survival. J Natl Cancer Inst. 2017.
2. Cote ML, Ruterbusch JJ, Olson SH, Lu K, Ali-Fehmi R. The growing burden of endometrial cancer: a major racial disparity affecting black women. Cancer Epidemiol Biomarkers Prev. 2015; 24:1407–1415.
3. Jamison PM, Noone AM, Ries LA, Lee NC, Edwards BK. Trends in endometrial cancer incidence by race and histology with a correction for the prevalence of hysterectomy, SEER 1992 to 2008. Cancer Epidemiol Biomarkers Prev. 2013; 22:233–241.
4. Chatterjee S, Gupta D, Caputo TA, Holcomb K. Disparities in gynecological malignancies. Front Oncol. 2016; 6:36.
5. Setiawan VW, Pike MC, Kolonel LN, Nomura AM, Goodman MT, Henderson BE. Racial/ethnic differences in endometrial cancer risk: the multiethnic cohort study. Am J Epidemiol. 2007; 165:262–270.
6. Long B, Liu FW, Bristow RE. Disparities in uterine cancer epidemiology, treatment, and survival among african americans in the united states. Gynecol Oncol. 2013; 130:652–659.
7. Maxwell GL, Risinger JI, Hayes KA, Alvarez AA, Dodge RK, Barrett JC, Berchuck A. Racial disparity in the frequency of PTEN mutations, but not microsatellite instability, in advanced endometrial cancers. Clin Cancer Res. 2000; 6:2999–3005.
8. Risinger JI, Hayes K, Maxwell GL, Carney ME, Dodge RK, Barrett JC, Berchuck A. PTEN mutation in endometrial cancers is associated with favorable clinical and pathologic characteristics. Clin Cancer Res. 1998; 4:3005–3010.
9. Basil JB, Goodfellow PJ, Rader JS, Mutch DG, Herzog TJ. Clinical significance of microsatellite instability in endometrial carcinoma. Cancer. 2000; 89:1758–1764.
10. Clifford SL, Kaminetsky CP, Cirisano FD, Dodge R, Soper JT, Clarke-Pearson DL, Berchuck A. Racial disparity in overexpression of the p53 tumor suppressor gene in stage i endometrial cancer. Am J Obstet Gynecol. 1997; 176:S229–232.
11. Cote ML, Atikukke G, Ruterbusch JJ, Olson SH, Sealy-Jefferson S, Rybicki BA, Alford SH, Elshaikh MA, Gaba AR, Schultz D, Haddad R, Munkarah AR, Ali-Fehmi R. Racial differences in oncogene mutations detected in early-stage low-grade endometrial cancers. Int J Gynecol Cancer. 2012; 22:1367–1372.
12. Zhang MM, Cheung MK, Osann K, Lee MM, Gomez SS, Whittemore AS, Husain A, Teng NN, Chan JK. Improved survival of asians with corpus cancer compared with whites: an analysis of underlying factors. Obstet Gynecol. 2006; 107:329–335.
13. Kandoth C, Schultz N, Cherniack AD, Akbani R, Liu Y, Shen H, Robertson AG, Pashtan I, Shen R, Benz CC, Yau C, Laird PW, Ding L, et al., and Cancer Genome Atlas Research Network. Integrated genomic characterization of endometrial carcinoma. Nature. 2013; 497:67–73.
14. Hampel H, Frankel W, Panescu J, Lockman J, Sotamaa K, Fix D, Comeras I, La Jeunesse J, Nakagawa H, Westman JA, Prior TW, Clendenning M, Penzone P, et al. Screening for lynch syndrome (hereditary nonpolyposis colorectal cancer) among endometrial cancer patients. Cancer Res. 2006; 66:7810–7817.
15. Haraldsdottir S, Hampel H, Tomsic J, Frankel WL, Pearlman R, de la Chapelle A, Pritchard CC. Colon and endometrial cancers with mismatch repair deficiency can arise from somatic, rather than germline, mutations. Gastroenterology. 2014; 147:1308–1316.
16. Maxwell GL, Tian C, Risinger J, Brown CL, Rose GS, Thigpen JT, Fleming GF, Gallion HH, Brewster WR; Gynecologic Oncology Groups. Racial disparity in survival among patients with advanced/recurrent endometrial adenocarcinoma: a gynecologic oncology group study. Cancer. 2006; 107:2197–2205.
17. Oliver KE, Enewold LR, Zhu K, Conrads TP, Rose GS, Maxwell GL, Farley JH. Racial disparities in histopathologic characteristics of uterine cancer are present in older, not younger blacks in an equal-access environment. Gynecol Oncol. 2011; 123:76–81.
18. Le Gallo M, O’Hara AJ, Rudd ML, Urick ME, Hansen NF, O’Neil NJ, Price JC, Zhang S, England BM, Godwin AK, Sgroi DC, Hieter P, Mullikin JC, et al; NIH Intramural Sequencing Center (NISC) Comparative Sequencing Program. Exome sequencing of serous endometrial tumors identifies recurrent somatic mutations in chromatin-remodeling and ubiquitin ligase complex genes. Nat Genet. 2012; 44:1310–1315.
19. Goh AM, Coffill CR, Lane DP. The role of mutant p53 in human cancer. J Pathol. 2011; 223:116–126.
20. Song H, Hollstein M, Xu Y. P53 gain-of-function cancer mutants induce genetic instability by inactivating atm. Nat Cell Biol. 2007; 9:573–580.
21. Hanel W, Marchenko N, Xu S, Yu SX, Weng W, Moll U. Two hot spot mutant p53 mouse models display differential gain of function in tumorigenesis. Cell Death Differ. 2013; 20:898–909.
22. Xu J, Wang J, Hu Y, Qian J, Xu B, Chen H, Zou W, Fang JY. Unequal prognostic potentials of p53 gain-of-function mutations in human cancers associate with drug-metabolizing activity. Cell Death Dis. 2014; 5:e1108.
23. Goh JY, Feng M, Wang W, Oguz G, Yatim S, Lee PL, Bao Y, Lim TH, Wang P, Tam WL, Kodahl AR, Lyng MB, Sarma S, et al. Chromosome 1q21.3 amplification is a trackable biomarker and actionable target for breast cancer recurrence. Nat Med. 2017; 23:1319–1330.
24. Chen H, Xu C, Jin Q, Liu Z. S100 protein family in human cancer. Am J Cancer Res. 2014; 4:89–115.
25. Haesen D, Abbasi Asbagh L, Derua R, Hubert A, Schrauwen S, Hoorne Y, Amant F, Waelkens E, Sablina A, Janssens V. Recurrent PPP2R1A mutations in uterine cancer act through a dominant-negative mechanism to promote malignant cell growth. Cancer Res. 2016; 76:5719–5731.
26. Jeong AL, Han S, Lee S, Su Park J, Lu Y, Yu S, Li J, Chun KH, Mills GB, Yang Y. Patient derived mutation W257G of PPP2R1A enhances cancer cell migration through SRC-JNK-c-Jun pathway. Sci Rep. 2016; 6:27391.
27. Guenin S, Mouallif M, Deplus R, Lampe X, Krusy N, Calonne E, Delbecque K, Kridelka F, Fuks F, Ennaji MM, Delvenne P. Aberrant promoter methylation and expression of UTF1 during cervical carcinogenesis. PLoS One. 2012; 7:e42704.
28. Januchowski R, Zawierucha P, Andrzejewska M, Rucinski M, Zabel M. Microarray-based detection and expression analysis of ABC and SLC transporters in drug-resistant ovarian cancer cell lines. Biomed Pharmacother. 2013; 67:240–245.
29. Amiry N, Kong X, Muniraj N, Kannan N, Grandison PM, Lin J, Yang Y, Vouyovitch CM, Borges S, Perry JK, Mertani HC, Zhu T, Liu D, et al. Trefoil factor-1 (TFF1) enhances oncogenicity of mammary carcinoma cells. Endocrinology. 2009; 150:4473–4483.
30. Smid M, Wang Y, Klijn JG, Sieuwerts AM, Zhang Y, Atkins D, Martens JW, Foekens JA. Genes associated with breast cancer metastatic to bone. J Clin Oncol. 2006; 24:2261–2267.
31. Sunagawa M, Yamaguchi J, Kokuryo T, Ebata T, Yokoyama Y, Sugawara G, Nagino M. Trefoil factor family 1 expression in the invasion front is a poor prognostic factor associated with lymph node metastasis in pancreatic cancer. Pancreatology. 2017; 17:782–787.
32. Faigenbaum R, Haklai R, Ben-Baruch G, Kloog Y. Growth of poorly differentiated endometrial carcinoma is inhibited by combined action of medroxyprogesterone acetate and the ras inhibitor salirasib. Oncotarget. 2013; 4:316–328.
33. Yang XW, Shen GZ, Cao LQ, Jiang XF, Peng HP, Shen G, Chen D, Xue P. Microrna-1269 promotes proliferation in human hepatocellular carcinoma via downregulation of foxo1. BMC Cancer. 2014; 14:909.
34. Kong XX, Lv YR, Shao LP, Nong XY, Zhang GL, Zhang Y, Fan HX, Liu M, Li X, Tang H. HBx-induced MiR-1269b in NF-kappaB dependent manner upregulates cell division cycle 40 homolog (CDC40) to promote proliferation and migration in hepatoma cells. J Transl Med. 2016; 14:189.
35. Ligtenberg MJ, Kuiper RP, Chan TL, Goossens M, Hebeda KM, Voorendt M, Lee TY, Bodmer D, Hoenselaar E, Hendriks-Cornelissen SJ, Tsui WY, Kong CK, Brunner HG, et al. Heritable somatic methylation and inactivation of MSH2 in families with Lynch syndrome due to deletion of the 3’ exons of TACSTD1. Nat Genet. 2009; 41:112–117.
36. Rhees J, Arnold M, Boland CR. Inversion of exons 1-7 of the MSH2 gene is a frequent cause of unexplained Lynch syndrome in one local population. Fam Cancer. 2014; 13:219–225.
37. Le DT, Durham JN, Smith KN, Wang H, Bartlett BR, Aulakh LK, Lu S, Kemberling H, Wilt C, Luber BS, Wong F, Azad NS, Rucki AA, et al. Mismatch repair deficiency predicts response of solid tumors to PD-1 blockade. Science. 2017; 357:409–413.
38. Fleury H, Carmona E, Morin VG, Meunier L, Masson JY, Tonin PN, Provencher D, Mes-Masson AM. Cumulative defects in DNA repair pathways drive the PARP inhibitor response in high-grade serous epithelial ovarian cancer cell lines. Oncotarget. 2017; 8:40152–40168. https://doi.org/10.18632/oncotarget.10308.
39. Team RDC. (2017). R: A language and environment for statistical computing. (Vienna, Austria: R Foundation for Statistical Computing).
40. Love MI, Huber W, Anders S. Moderated estimation of fold change and dispersion for RNA-seq data with DESeq2. Genome Biol. 2014; 15:550.
41. Gu Z, Eils R, Schlesner M. Complex heatmaps reveal patterns and correlations in multidimensional genomic data. Bioinformatics. 2016; 32:2847–2849.
42. Morganella S, Pagnotta SM, Ceccarelli M. Finding recurrent copy number alterations preserving within-sample homogeneity. Bioinformatics. 2011; 27:2949–2956.
43. Durinck S, Moreau Y, Kasprzyk A, Davis S, De Moor B, Brazma A, Huber W. BioMart and Bioconductor: a powerful link between biological databases and microarray data analysis. Bioinformatics. 2005; 21:3439–3440.
44. Lawrence M, Huber W, Pages H, Aboyoun P, Carlson M, Gentleman R, Morgan MT, Carey VJ. Software for computing and annotating genomic ranges. PLoS Comput Biol. 2013; 9:e1003118.
45. Schroder MS, Culhane AC, Quackenbush J, Haibe-Kains B. Survcomp: an r/bioconductor package for performance assessment and comparison of survival models. Bioinformatics. 2011; 27:3206–3208.