
INTRODUCTION
Long noncoding RNAs (lncRNAs) are loci located in genomic regions, which are antisense, intronic, intergenic or overlapping with regard to protein-coding loci. They emerged as important components of mechanisms involved in various biological processes modulating developmental, metabolic and immunological changes. LncRNAs turned out to be functionally associated with specific developmental stages in cells and tissues, the pathogenesis of various diseases (e.g., tumor growth, mental and neurogenerative disorders, cardiovascular pathologies), the susceptibility to infection and other environmental challenges and also with metabolic disorders (e.g., obesity, diabetes) [1–13]. In these remarkably distinct biological processes, dysfunctions and conditions, lncRNAs were found to be involved in a broad range of mechanisms regulating gene expression, genomic imprinting, chromatin modification and epigenetic processes [14–16]. In spite of their potential functional relevance, even in human and mouse, most known lncRNAs are not functionally characterized.
In contrast to human and laboratory model species, lncRNAs are incompletely annotated in the reference genomes of domesticated and farm animals [17]. Transcriptome analyses by RNA sequencing (RNA-seq) have demonstrated to be useful for the identification of complex transcript catalogues of specific cells and tissues, including lncRNAs. The holistic RNA-seq approach allows us to discover previously undetected transcripts and to unravel novel regulatory mechanisms at the transcriptional level. There are only a few transcriptome studies with a focus on the identification and characterization of lncRNAs in specific bovine tissues using RNA-seq [18–23], and the most comprehensive catalogue of lncRNAs across tissues in cattle is based on data from a single animal [24]. Thus, identification and functional characterization of lncRNA atlases fits the aim of the international global network for Functional Annotation of Animal Genomes (FAANG), which is to identify and functionally annotate novel regulatory elements in domesticated animal genomes with a focus on biologically important representative tissues to generate a link between genome and phenome [25, 26].
In this context, the aim of our study was focused on the identification of lncRNAs and the elucidation of their potential regulatory function in intestinal tissue of calves in response to nutritional intervention by following-up a previous whole transcriptome study. In that study we had used RNA-seq to examine the transcriptional changes of protein-coding genes in response to different milk feeding regimens in calves during the pre-weaning period [27]. Our present study followed up previous reports (e.g., [1, 4, 6, 9, 12]) suggesting that lncRNAs are involved as regulatory integral component in the modulation of immunological and metabolic processes as well as in developmental and cellular proliferation. Thus, we hypothesized that lncRNAs may possibly play a regulatory role in mediating the effects of divergent early life milk supply in the gastrointestinal system of calves in the pre-weaning period. Our previous RNA-seq analysis had indicated that in the jejunal mucosa of calves the most divergent transcriptional response to restricted compared to ad libitum milk access was elicited by genes acting in the immune system. In contrast, the response of different milk supply was less pronounced on the metabolic system level compared to the immune system. Pursuing our hypothesis on lncRNAs, this follow-up analysis of the RNA-seq dataset had a focus on the identification of lncRNAs present in the jejunum mucosa of pre-weaning calves. Furthermore, it aimed to elucidate if lncRNAs may play a functional role in the modulation of gene expression patterns caused by restricted milk access of calves at this early ontogenetic stage.
RESULTS AND DISCUSSION
Feed intake and growth performance
Feed intake and growth curves of the two differentially fed calf groups were described in detail in our previous reports [27, 28]. In brief, higher milk intake (transition milk and milk replacer) was accompanied by a faster increase of body weight in AL compared to RES calves. RES calves had a higher concentrate intake than AL calves at the end of the experiment. However, total dry matter intake (sum of milk, milk replacer and concentrate intake) was not different between AL and RES calves during the whole experimental period.
Transcriptome sequencing
Statistics of whole transcriptome sequencing of jejunum mucosa samples were presented in detail in our previous report [27]. Essentially, a total of 6.8 billion quality-filtered reads were available for subsequent guided alignment to the Bos taurus genome assembly UMD 3.1.1. A total of 88.6% of reads were mapped uniquely to the bovine reference genome. Finally, the annotation-guided transcript assembly revealed 69,429 transcripts (corresponding to 25,954 gene loci), which were expressed in at least one sample across calf groups with a minimum of 10 reads. Out of them, 14,689 transcripts (corresponding to 11,413 gene loci) were not annotated in the Bos taurus reference genome assembly. These unknown transcripts were assigned to class code “u” according to the Cufflinks pipeline [29]. The majority of them were monoexonic transcripts, 4,782 transcripts (2,117 loci) consisted of more than one exon.
Analysis of unannotated transcripts and identification of lncRNAs
The transcripts not previously annotated in the bovine transcriptome were subjected to a RNA classification pipeline applying four independent bioinformatic tools in order to identify putative lncRNAs (Figure 1). The selected bioinformatic lncRNA prediction methods PLAR, PLEK, CNCI and FEELnc, are based on different intrinsic sequence-related features (composition, structural properties and motifs) and divergent filtering steps as has been reviewed recently [17]. They are mainly divided into alignment-free (CNCI, PLEK, and FEELnc) or alignment-dependent (PLAR) algorithms. A very critical filtering parameter for all lncRNA prediction tools is, whether intergenic transcripts with single exon structure were retained in the input dataset. Whereas CNCI discards all intergenic singletons, PLEK keeps them in the dataset and PLAR allows retaining only those single-exon transcripts fulfilling more stringent criteria (exonic length >2,000 nt and an FPKM >5 in at least one sample). FEELnc offers three options: remove all monoexonic transcripts, include all of them or keep only antisense singletons. Because we used an RNA-seq stranded protocol, we applied the third option for the analysis of our dataset with FEELnc.
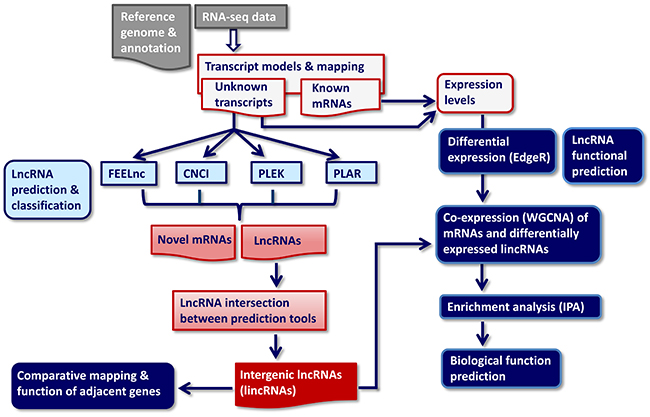
Figure 1: RNA-seq-based data analysis pipeline for identification, classification and biological function annotation of lncRNAs. CNCI, PLAR, PLEK, FEELnc: Bioinformatic prediction tools. WGCNA: Weighted gene co-expression network analysis, IPA: Ingenuity enrichment and biological pathway analysis of genes in GNM significantly co-expressed with differentially expressed lncRNAs.
The comprehensive lncRNA prediction analysis revealed that the classification of unknown transcripts is dependent on the specific bioinformatic tool applied (Table 1). It is striking that PLEK classified nearly all transcripts included in the input dataset of unknown transcripts (98%) compared to the other three tools (21%, 32% and 33% for PLAR, FEELnc and CNCI), which is due to the fact that monoexonic transcripts were not filtered out when applying PLEK. Thus, PLEK predicted the highest number of lncRNA transcripts to be present in the dataset of unknown transcripts. It is further noticeable that FEELnc and CNCI classified a similar number of putative lncRNA and novel mRNA transcripts, whereas PLAR resulted in the lowest number transcripts classified from the dataset of unknown transcripts (Table 1). The particularly remarkable low number of putative novel mRNA transcripts identified by PLAR could be due to the very stringent filtering parameters applied in this prediction algorithm.
Table 1: Analysis and classification of unknown transcripts applying different bioinformatic algorithms
Bioinformatic tool |
Total number of classified transcripts1 |
Predicted lncRNAs2 |
%4 |
Predicted novel mRNAs3 |
%4 |
|---|---|---|---|---|---|
FEELnc |
4,680 |
3,494 |
75 |
1,186 |
25 |
CNCI |
4,784 |
3,626 |
76 |
1,158 |
24 |
PLAR |
3,168 |
2,575 |
81 |
593 |
19 |
PLEK* |
14,328 |
10,449 |
73 |
3,879 |
27 |
1Number of all transcripts classified by the respective bioinformatic algorithm from the input dataset comprising 14,689 class code “u” transcripts based on the filters specific for each tool, 2Number of putative lncRNAs (no coding potential) predicted from the total number of class code “u” transcripts and classified by the respective bioinformatic tool, 3Number of mRNAs (coding potential) predicted from the total number of class code “u” transcripts and classified by the respective bioinformatic tool, 4Percentage of transcripts relative to the total number of lncRNA and mRNA transcripts, respectively, classified by the respective bioinformatic tool, *Singletons included.
After performing lncRNA prediction using these four algorithms separately, the intersection between the results from all four bioinformatic methods and all trio and pair combinations were determined in order to extract lncRNAs with high reliability and to evaluate the concordance between the lncRNA prediction tools applied. The intersection between all four tools extracted a total of 1,055 lncRNAs commonly predicted by all bioinformatic tools (Figure 2). This transcript set contains only intergenic lncRNAs (lincRNAs) with more than one exon because of the intrinsic filtering feature implemented in CNCI. The intersection between the trio combinations of lncRNA prediction tools revealed that the alignment-free pipelines, CNCI, FEELnc and PLEK, shared the highest number (1,812) of concordantly predicted of lncRNA transcripts (Supplementary Table 1). The pairwise intersection of bioinformatic pipeline showed the highest concordance between FEELnc and CNCI (2,872 lncRNA transcripts).
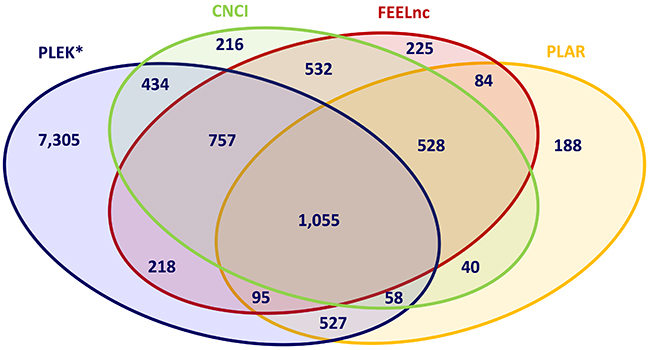
Figure 2: Intersection of predicted lncRNAs applying different bioinformatic prediction tools. CNCI, PLAR, PLEK, FEELnc: Bioinformatic prediction tools.
The intersection of novel mRNA transcripts predicted from the input dataset of unknown transcripts revealed that only 48 transcripts were concordantly predicted by all four prediction methods, and again the trio combination of the alignment-free pipelines, CNCI, FEELnc and PLEK, showed the highest concordance by predicting 457 novel mRNA transcripts corresponding to 204 novel mRNA loci (Figure 3, Supplementary Table 2). When using combinations of two prediction algorithms, the highest agreement in discovering novel potentially coding transcripts was displayed by the CNCI-PLEK pair.
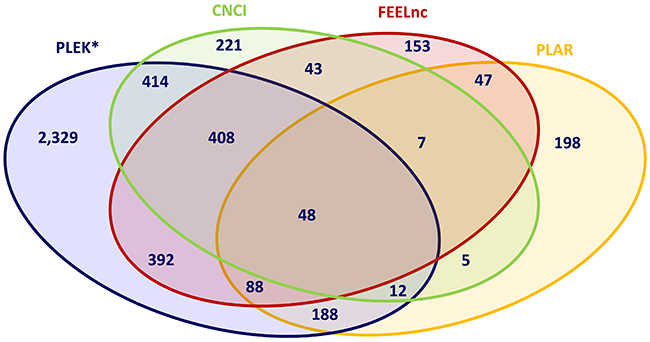
Figure 3: Intersection of predicted novel mRNAs applying different bioinformatic prediction tools. CNCI, PLAR, PLEK, FEELnc: Bioinformatic prediction tools.
Follow-up analyses of lncRNAs were performed using the intersection dataset from the alignment-free pipelines, CNCI, FEELnc and PLEK comprising 1,812 intergenic lncRNA transcripts corresponding to 1,042 putative lncRNA loci (lncRNA concordance dataset, Supplementary Table 1). The intersection dataset was used for sequence similarity searches in the Bos taurus genome NCBI assembly UMD3.1.1 and NONCODE 2016 databases in order to identify novel, unique bovine lncRNAs in our jejunal mucosa dataset. The results revealed that most of the lncRNA loci included in the lncRNA concordance dataset were novel. According to the selected identity thresholds and after manual inspection of identity hits we found that a total of 145 lncRNA loci detected in our study had substantial sequence similarity to 172 bovine lncRNA loci included in the NONCODE 2016 dataset. Out of these 145 confirmed lncRNA loci, 35 lncRNA loci from our dataset were nearly completely covered (>90%) by NONCODE lncRNAs (i.e., the total length of the NONCODE lncRNAs could be longer) (Supplementary Table 3). Finally, 897 out of putative 1,042 lncRNA loci from our lncRNA concordance dataset that were without substantial sequence similarity to sequences included in the NONCODE 2016 dataset, can be designated as novel.
Differentially expressed lncRNAs
Transcriptome-wide differential expression analysis revealed that a total of 275 loci displayed differential expression between groups [27]. There were 55 loci in this dataset, which were not annotated in the bovine genome. Comparing the dataset of differentially expressed loci with our lncRNA concordance dataset, we retrieved nine lncRNA loci that were present in both datasets and met our stringency threshold to be reliably expressed in at least five samples (Table 2).
Table 2: lncRNA loci differentially expressed between calf groups fed different diets
Gene locus |
AL (FPKM) |
RES (FPKM) |
Fold change (log2) |
q-value |
Chromosomal position (Mb) |
|---|---|---|---|---|---|
XLOC_003822 |
1.14 |
0.31 |
-1.85 |
0.0664 |
11:105,094032-105,114596 |
XLOC_004079 |
5.52 |
1.38 |
-2.00 |
0.0085 |
11:25,480054-25,559973 |
XLOC_004376 |
9.26 |
0.57 |
-4.02 |
0.0085 |
11:77,900485-77,936781 |
XLOC_009175 |
16.96 |
5.06 |
-1.74 |
0.0085 |
16:46,076613-46,098065 |
XLOC_019876 |
1.79 |
0.21 |
-3.06 |
0.0085 |
23:40,796533-40,817043 |
XLOC_020293 |
0.62 |
0.08 |
-2.85 |
0.0522 |
24:7,206795-7,216215 |
XLOC_025957 |
43.33 |
14.50 |
-1.58 |
0.0988 |
3:104,408540-104,421736 |
XLOC_026410 |
23.28 |
6.61 |
-1.81 |
0.0085 |
4:77,906094-77,910010 |
XLOC_029089 |
9.77 |
3.56 |
-1.46 |
0.0085 |
5:104,398821-104,402665 |
FPKM (fragments per Kb per million reads).
These lncRNAs differentially expressed (DE lncRNAs) in the jejunal mucosa between both calf groups indicate a potential functional relevance for them in the modulation of regulatory processes in the calf intestine associated with adaptation to the different feeding regimen. All DE lncRNAs were downregulated in the RES calf group compared to the AL calves (Table 2).
Specific classification and mapping characteristics of these DE lncRNAs are summarized in Table 3. The DE lncRNA loci were generally represented by more than one transcript in our dataset comprising a length greater than 1 kb (except for XLOC_026410) and spanned one to five exons. They are localized between protein-coding genes and are classified as intergenic type (lincRNA) with a distance to the nearest annotated protein-coding gene varying between 106 and 87,187 bp.
Table 3: Characteristics of lncRNAloci differentially expressed between calf groups fed different diets
lncRNA locus |
Nearest gene |
Distance (bp)1 |
Location1 |
Class1 |
Direction1 |
Ntrans |
Length (bp) |
Nex |
|---|---|---|---|---|---|---|---|---|
XLOC_003822 |
CACNA1B |
39,145 |
Upstream |
intergenic |
sense |
5 |
1,738-12,651 |
1-3 |
XLOC_004079 |
ZFP36L2 |
66,069 |
Down-stream |
intergenic |
sense |
18 |
1,125-5,523 |
1-4 |
XLOC_004376 |
APOB |
28,164 |
Upstream |
intergenic |
antisense |
2 |
1,857-2,126 |
3 |
XLOC_009175 |
ERRFI1 |
26,160 |
Upstream |
intergenic |
sense |
5 |
1,231-1,946 |
2-3 |
XLOC_019876 |
MYLIP |
5,561 |
Upstream |
intergenic |
sense |
3 |
2,714-2,906 |
2-3 |
XLOC_020293 |
SOCS6 |
87,187 |
Down-stream |
intergenic |
sense |
3 |
1,012-1,523 |
1-3 |
XLOC_025957 |
RIMKLA |
4,046 |
Upstream |
intergenic |
sense |
13 |
740-6,380 |
1-5 |
XLOC_026410 |
POLM |
499 |
Upstream |
intergenic |
sense |
1 |
879 |
2 |
XLOC_029089 |
TNFRSF1A |
106 |
Upstream |
intergenic |
antisense |
4 |
2,784-2,936 |
3 |
1Classification of lncRNAs relative to the nearest gene was retrieved from FEELnc, Ntrans: number of transcripts per locus, Nex: number of exons.
Sequence similarity search of DE lncRNAs against the NONCODE 2016 database indicated that only XLOC_026410 is already deposited there. Screening the current bovine UMD 3.1.1 genome assembly at NCBI (annotation release 105, 10/2017) revealed that the DE lncRNAs (except for XLOC_019876 and XLOC_003822) displayed sequence similarity to noncoding RNA sequences predicted by automated computational analysis using the NCBI eukaryotic gene prediction tool Gnomon (Table 4).
Table 4: Sequence similarity of lncRNA loci differentially expressed between calf groups fed different diets
lncRNA locus |
Similarity1 (Bos taurus) |
Similarity2 (Other ruminants) |
Locus2 |
Seq_ID2 |
Human synteny region3 |
|---|---|---|---|---|---|
XLOC_003822 |
NA |
Odocoileus virginianus texanus |
LOC110123124 |
XR_002309436 |
NA |
XLOC_004079 |
XR_809672 |
NA |
HSA2, ZFP36L2, LINC02580, LINC01819 |
||
XLOC_004376 |
XR_236455 |
Ovis aries |
LOC104989019 |
XR_825310 |
HSA2, APOB/TDRD15 |
XLOC_009175 |
XR_811953 |
Bison bison |
LOC104995879 |
XR_826114, XR_826113 |
HSA1, ERRFI1 |
XLOC_019876 |
NA |
NA |
HSA6, MYLIP |
||
XLOC_020293 |
XR_239769 |
Bubalus bubalis |
LOC102410412 |
XR_327783 |
HSA18, SOCS6 |
XLOC_025957 |
XR_805801 XR_805800 XR_234114 |
Bos mutus |
LOC106701547 |
XR_001351942 |
HSA1, RIMKLA/FOXJ3 |
XLOC_026410 |
XR_806237 |
NA |
HSA7, POLM/AEBP1 |
||
XLOC_029089 |
XR_139312 |
Ovis aries musimon |
LOC102340266 |
XR_318473 |
HSA12, TNFRS1A/SCNN1 |
1,2Sequence similarity search against the NCBI and NONCODE databases, 3synteny search against the NCBI database, NA: no similarity or synteny.
Sequence similarity search of DE lncRNAs in the NCBI nucleotide database (nr, species other than human and mouse) discovered a robust evolutionary conservation (>90% identity) to lncRNAs from other ruminant species for all DE lncRNAs but not XLOC_019876, XLOC_004079 and XLOC_026410 (Table 4). Screening the current human genome assembly at NCBI (GRCh38.p7 primary assembly, annotation release 108, 10/2017) identified no similar human lncRNA sequences.
However, inspecting genomic regions adjacent to lncRNAs on human chromosomes that are syntenic to the targeted bovine chromosomal regions unveiled a similar structural architecture regarding the annotation of some DE lncRNAs (Table 4). XLOC_004079, XLOC_009175, XLOC_019876, XLOC_020293 and XLOC_029089 and corresponding human lncRNAs were found to be located in the neighbourhood of respective orthologous protein-coding genes. Generally, lncRNAs are known to have a low cross-species sequence conservation rate and lack common sequence features or structural motifs. However, the positional, orthologous conservation of lncRNAs and lincRNAs across vertebrates is reported in various species [30–32]. Human lncRNA LINC01910 is particularly interesting because it showed a three exon structure like XLOC_020293 and is located near SOCS6 on HSA18, a syntenic organization found for XLOC_020293 and SOCS6 on BTA24. In addition, LINC01910 was found to be specifically expressed in human small intestine [33] and showed a specific expression pattern during fetal development in this tissue [34].
To elucidate tissue specificity of DE lncRNAs discovered in our study we took advantage from cow RNA-seq data available at the Bos taurus UMD3.1.1 NCBI Genome Data Viewer, GCF000003055.6, (https://www.ncbi.nlm.nih.gov/genome/gdv/browser/?acc=GCF_000003055.6&context=genome). In addition, we searched for expression of DE lncRNAs in own unpublished RNA-seq datasets available for tissues from male and female animals originating from a Charolais x German Holstein cross. We found that all DE lncRNAs revealed expression in one of the other RNA-seq datasets and in more than one tissue (Supplementary Table 4). Hence, it can be excluded that they are specifically expressed only in calf jejunum.
Functional analysis of differentially expressed lncRNAs
For inferring the regulatory functions of DE lncRNAs in the jejunal mucosa in response different nutrient regimes in calves we used a “guilt-by-association” approach which relies on similar co-expression profiles between lncRNAs and protein-coding genes of known function [35, 36]. Co-expression network analysis offers the possibility to simultaneously identify and investigate numerous genes displaying coordinated expression patterns at multiple experimental settings. To predict the functions of DE lncRNAs, we first constructed a co-expression network using the weighted correlation network analysis (WGCNA, see pipeline in Figure 1) and identified modules of co-expressed protein-coding genes (=gene network module (GNM), marked with different colors), which were subsequently correlated to DE lncRNA expression. The sample dendrogram resulting from WGCNA showed a clear clustering of calf groups based on expression levels of the nine DE lncRNAs (Supplementary Figure 1).
The co-expression analysis revealed a total of 58 correlated GNM (Supplementary Figure 2), out of which 26 were significantly correlated (p< 0.05) with at least one of the lncRNAs included in the analysis. The GNM that are most highly co-expressed with at least one DE lncRNAs as indicated by a correlation of r> |0.75| and p< 0.01 are displayed in Figure 4. The DE lncRNA-gene module relationships showed that most of lncRNAs were correlated with several GNM, suggesting a co-regulation of the respective DE lncRNAs. The strongest DE lncRNA – gene module relationships were found for XLOC_004376. It was highly correlated to the gene modules “yellow” (r=0.883, p=0.0003) and “grey” (-0.861, p=0.0007) (Figure 4, Table 5). Both GNM displayed high correlations to several other DE lncRNAs. Out of them, XLOC_029089 revealed a strong correlation to gene module “yellow” (r=0.836, p=0.001), whereas XLOC_025957 and XLOC_004079 were strongly correlated with gene module “grey” (r=-0.839, p=0.001 and r=-0.838, p=0.001, respectively). However, there were also DE lncRNAs (XLOC_003822, XLOC_026410, XLOC_009175 and XLOC_0020293) that revealed a tight correlation with only a single GMN, indicating a specific transcriptional co-regulation. Whereas the first three DE lncRNAs were jointly correlated with the GNM “mediumpurple”, XLOC_0020293 was only significantly correlated with GNM “black” (r=-0.823, p=0.002). XLOC_0020293 seems to play a distinct regulatory role because in turn, GNM “black” revealed no strong correlation with any of the other DE lncRNAs.
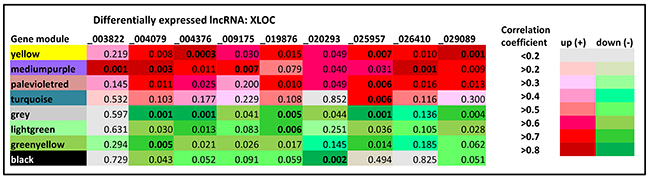
Figure 4: Weighted co-expression analysis of annotated and non-annotated loci with differently expressed lncRNAs. Left column: Different colors represent different GNM identified by Weighted gene co-expression network analysis (WGCNA) established from pairwise correlations of gene expression patterns. Headline: Differentially expressed lncRNAs co-expressed with GNM. Significance of correlation is displayed by p-values, positive correlation is indicated in red, negative correlation is indicated in green, intensity of red/green colors corresponds to the magnitude of the correlation. Those GNM that are most highly co-expressed with at least one DE lncRNAs indicated by a correlation of r> |0.75| and p< 0.01 are displayed. Most significant correlations are given in bold.
Table 5: Gene modules and corresponding canonical pathways associated with DE lncRNAs
GNM |
Gene number1 |
Co-expressed |
Correlation2 |
Top canonical pathways associated with gene modules |
P-value |
|---|---|---|---|---|---|
black |
737 |
XLOC_020293 |
-0.823 |
Oxidative phosphorylation |
5.10E-46 |
yellow |
967 |
XLOC_004376 |
0.883 |
Remodeling of epithelial adherens junctions |
5.21E-08 |
grey |
186 |
XLOC_004376 |
-0.861 |
Bile acid biosynthesis, neutral pathway |
4.81E-04 |
mediumpurple |
48 |
XLOC_003822 |
0.844 |
Retinoic acid mediated apoptosis signaling |
4.94E-03 |
greenyellow |
453 |
XLOC_004079 |
-0.772 |
Role of PKR in interferon induction & antiviral response |
1.05E-05 |
paleviolet |
26 |
XLOC_025957 |
0.770 |
S-methyl-5′-thioadenosine degradation II |
6,06E-03 |
turquoise |
1,616 |
XLOC_025957 |
0.771 |
Estrogen receptor binding |
7.23E-05 |
lightgreen |
72 |
XLOC_019876 |
-0.763 |
PI3K/AKT signalling |
5.25E-03 |
1Number of genes (in the GNM) with known function, 2p < 0.01, r > ±0.75.
The “guilt-by-association principle” claims that genes sharing the same function or that are involved in the same regulatory pathway will tend to present similar expression profiles and hence, form clusters or modules in the network [36]. Thus, within the same module, genes of known function can be used to predict the function of co-expressed unknown genes [14, 35]. For functional annotation of lncRNAs expressed in the jejunum mucosa, co-expression analysis of DE lncRNAs and mRNAs (protein-coding genes) with known biological function was linked with enrichment and canonical pathway analysis of GNM, which were significantly correlated to DE lncRNAs using IPA (see pipeline in Figure 1).
The canonical pathways identified for the most tightly co-expressed DE lncRNA – GNM are summarized in Table 5; and Figure 5 illustrates the integrated network summary of most significantly co-expressed DE lncRNA- GMN pairs. The results obtained from the combined co-expression - biological pathway analysis (WGCNA-IPA) suggest that the DE lncRNAs might be involved in various different biological pathways modulated in the calves’ jejunal mucosa in response to different milk diets. Based on known functions of the co-expressed protein-coding genes, hypotheses can be generated for the functions and potential regulators of the DE lncRNA [14, 35]. Some of the most interesting DE lncRNAs – biological pathway relationships are elucidated and discussed in more detail.
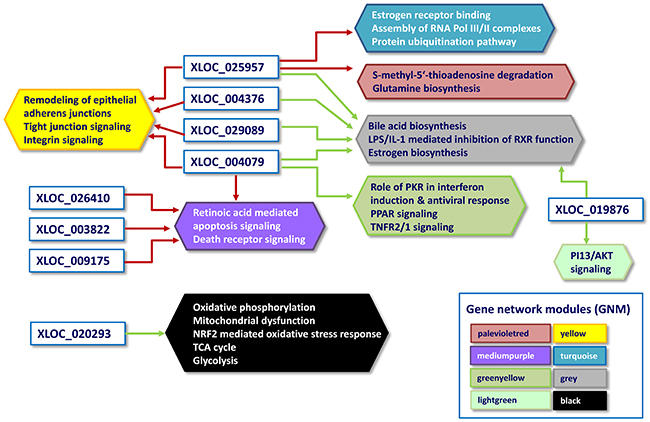
Figure 5: Network of differentially expressed lncRNA and their linked biological pathways predicted by biological pathways analysis. Arrows: Positive correlation between gene network modules (GNM)/biological pathways and DE lncRNAs identified by Weighted gene co-expression network analysis (WGCNA) is indicated in red, negative correlation is indicated in green. Hexagons represent the canonical pathways of GNM identified by Ingenuity pathway analysis, their different colors are equivalent to those of the network modules correlated with DE lncRNAs.
Most interesting out of the nine DE lncRNAs is XLOC_020293 because it was strongly correlated to a single GNM indicating a potential regulatory connection to metabolic pathways. This GNM “black” comprised genes, which were highly significantly enriched in the Ingenuity canonical pathways “Oxidative phosphorylation” and “Mitochondrial dysfunction” (Table 5, Figures 5 and 6). Other genes included in the GNM “black” were associated with canonical pathways “NRF2-mediated oxidative stress response”, “TCA cycle II” and “Glycolysis I” (Table 5, Figure 5), which are collectively implemented within cellular energy production. The strong negative correlation between the expression level of DE lncRNA XLOC_020293 and genes included in GNM “black” suggests a potential regulatory function of this DE lncRNA in metabolic processes related to energy metabolism and maintaining of cellular homeostasis with a specific focus on mitochondrial processes. This is particularly imperative for intestine tissue, because it has an intense metabolic rate and has high energy expenditure required for digestion and absorption processes [37]. The small intestine possesses adaptive capacity to adjust form and function in response to changes in digestive load [38]. As illustrated in Figure 6, all five complexes of the electronic transport chain (ETC) included in the pathways “Oxidative phosphorylation” and “Mitochondrial dysfunction”, are represented in the list of GNM “black” genes. We found that 53% of genes involved in the ETC were collectively modulated in response to the different diets. Most of the affected genes showed a tendency for higher expression levels in the RES calves than AL calves indicating an upregulated oxidative phosphorylation in RES calves. Similar transcriptional effects were observed for genes involved in the pathways “TCA cycle II” and “Glycolysis I” (Supplementary Figures 3, 4). In addition, as shown in Supplementary Figure 5, there are several other genes encoding mitochondrial proteins showing slightly higher but not significant gene expression levels in RES calves compared to AL calves (e.g., FIS1, VDAC1, HSD17B10, AIFM1, PINK1, TXN2, PRX2, ACO2). In summary, this indicates a coordinated modulation of biological processes in the intestinal mitochondria of RES calves, which might involve a regulatory role of the strongly co-expressed DE lncRNA XLOC_020293.
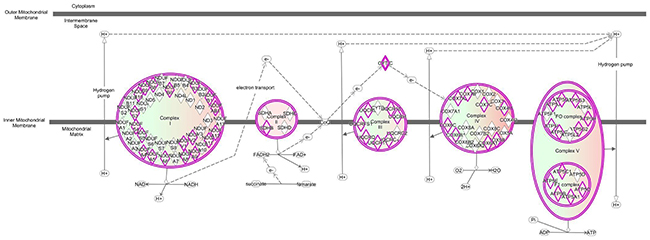
Figure 6: Ingenuity canonical pathway “Oxidative phosphorylation” is predicted to be modulated by DE lncRNA XLOC_02093.
Analysis of potential upstream regulators for GNM “black” by IPA predicted RICTOR (RPTOR independent companion of mTOR complex 2) as potential candidate (z score: -5.93, p-value 4.66E-23). RICTOR and MTOR are components of a protein complex that integrates nutrient- and growth factor-derived signals to regulate cell growth [39]. Hence, it can be hypothesized that presumably DE lncRNA XLOC_020293 may interact with RICTOR to coordinately fine-tune biochemical processes regulating energy metabolism in response to different nutrient regimens in the calf groups.
There is evidence from studies in human and mouse that lncRNAs are implicated in differentiation and homeostasis of metabolic tissues in human and mouse [6, 40–45]. LncRNA-mediated regulation of metabolic processes related to glucose metabolism has been particularly discussed for aerobic glycolysis in cancer associated with the Warburg effect [46]. Goyal et al. [47] found an association of H19 lncRNA levels and impaired gluconeogenesis in diabetic mice. Lan et al. [48] reported that lnc-HC lncRNA plays a regulatory role in hepatocytic cholesterol metabolism by modulating the expression of CYP7A1 and ABCA1 genes implicated in cellular cholesterol excretion. In diabetic nephropatic mice and cell lines from different mouse tissues, Long et al. [49] discovered that the lncRNA TUG1 regulates PPARGC1A gene expression, the transcriptional coactivator that plays an integral role in maintaining energy homeostasis and mitochondrial biogenesis in response to a multitude of nutrient and hormonal signals. Several lncRNAs (ANRIL, AScmtRNA, H19, HOTAIR, LincRNA-p21, MALAT1, RMRP, SAMMSON, and VL30) have emerged as potent regulators of mitochondrial metabolism [50]. In contrast to human and mouse, studies in domesticated animals elucidating the biological function of lncRNAs associated with metabolic processes are limited. For instance in cattle, it has been reported that lncRNA ADNCR is known to act as competing endogenous RNA to sponge miRNA-204, thereby regulating the expression of the target gene SIRT1, which in turn results in inhibiting of bovine adipocyte differentiation [51]. In addition, several unknown lncRNAs potentially regulating fat metabolism in liver tissue of dairy cows were identified [23]. Our study is the first one with a specific focus of metabolism-associated lncRNAs in bovine gastrointestinal tissue. However, it has to be considered that the different effects between calf groups observed on transcriptional level of DE lncRNA XLOC_020293 and genes enriched in associated canonical pathways in response to different diets were recognized at the time point of sampling, two weeks after terminating the different milk feeding period. We cannot clearly distinguish, whether the effects on lncRNA expression level and the genes enriched in pathways linked to energy metabolism might be prolonged effects from the period of different diets on the intestinal epithelial cells or rather originate from different concentrate intake prior to sampling/slaughtering.
Table 5 and Figure 5 highlight DE lncRNAs XLOC_004376, XLOC_004079, XLOC_029089 and XLOC_025957, which were collectively positively correlated with the GNM “yellow”. This GNM comprises genes that were predominantly enriched in canonical pathways in “Remodeling of epithelial adherens junctions”, “Tight junction signaling”, “Antiproliferative role of TOB in T cell signaling” and “Integrin signaling”.
Adherens and tight junctions belong to the adhesive complexes connecting adjacent epithelial cells and intercellular space in the intestinal epithelium, which acts as a selectively permeable barrier. They prevent the passage of harmful intraluminal entities including foreign antigens, microorganisms and their toxins, and simultaneously permit the absorption of essential dietary nutrients, electrolytes and water from the intestinal lumen via the formation of complex protein-protein networks (reviewed by [52]). Rearranging adherens junctions is essential to drive epithelial remodeling during developmental and aging processes, when cells frequently change their shape and position relative to neighboring cells [53]. Defects in the adhesive characteristics of epithelial cells may affect assembly and disassembly of cell-cell adhesion and the ability of cells to regulate their adhesive interactions during tissue morphogenesis, repair and renewal; and these processes may play a key role during adaptive development of jejunal mucosa of calves in the postnatal and pre-weaning period and in response to different diets. In our study, remodeling activity of epithelial adherens junctions in intestinal mucosa tended to be different in both calf groups. Several genes acting in this pathway including CDH1 and CTNND1, which play a critical role in formation of adherens and tight junctions and influence membrane surface stability [54], were sligthly lower expressed in RES compared to AL calves. Hence, the DE lncRNAs tightly co-expressed with the respective GMN could possibly be involved as regulatory component in this biological pathway “Remodeling of epithelial adherens junctions”.
Tight junction signaling is also involved in the modulation of connections between adjacent epithelial cells by participating in the regulation of cell proliferation and differentiation [55]. Tight junctions (TJ) are the most apical structure present in the junctional complex between the epithelial cells. This multifunctional complex was reported to contribute to the paracellular barrier and signal transduction in vertebrate epithelial and endothelial cells [56]. Claudins are the major structural and functional protein components of TJ directly regulating the paracellular passage of ions and solutes in-between cells in an epithelial layer (gate function) and determining the barrier properties [57, 58]. In our study a member of the claudin gene family, CLDN4, was significantly lower expressed in intestinal mucosa of RES calves than in AL calves. The corresponding protein CLDN4 is a tight junction-sealing claudin that was found to be expressed in differentiated luminal epithelial cells with a tight barrier [59]. In mouse intestine cells, Capaldo et al. [60] showed that cytokine-induced proinflammatory TJ remodeling is associated with increased CLDN4 dynamics at the TJ and contributes to epithelial barrier dysfunction by decreasing the assembly of CLDN4 into TJ. In studies that investigated barrier function in cows and calves, it was found that the expression of genes encoding TJ proteins, are affected by age and diet and that intestinal barrier function in calves is suggested to be compromised during the pre-weaning phase [61, 62]. Transcriptome analysis of small intestine of neonatal calves revealed significant temporal upregulation of CLDN4 expression in the first week of life in the jejunum suggesting that barrier function changes immediately post partum at an early ontogenetic stage [63]. It has also been reported that gastrointestinal permeability decreases when calves age from 17 to 42 d, suggesting an improved barrier function [64].
The “Tight junction signaling” was also one of the most significantly enriched canonical pathways in our previous study [27], which had focused on containing differentially expressed coding genes in the jejuna of calves experienced different milk supply. Based on the knowledge from literature it can be suggested that downregulation of CLDN4 in RES calves compared to AL calves in our study may support a tighter epithelial phenotype resulting in reduced paracellular permeability properties of the intestinal mucosa in AL calves compared with RES calves. The DE lncRNAs XLOC_004376, XLOC_004079, XLOC_029089 and XLOC_025957 were highly correlated with the GNM “yellow”, which was enriched for genes in the “Tight junction signaling” pathway. Thus, these DE lncRNAs might be involved in specific fine-tuning of TJ dynamics affecting mechanical strength of the intestine epithelium and might play a functional role in controlling the intestine permeability by altering the stability and translation of respective target mRNAs/genes in calves subjected to a different feeding regimen. Recent studies in human and mouse revealed that lncRNAs play a relevant role in controlling the intestinal epithelial barrier function. Overexpression of H19 lncRNA or silencing of SPRY4-IT1 lncRNA were reported to be accompanied by translational repression of genes encoding tight junction and adherens proteins, which led to dysfunction of epithelial barrier in intestinal cells [65, 66]. Post-transcriptional regulation of intestinal epithelial integrity by lncRNAs has been highlighted as functionally important for the maintenance of the gut epithelial integrity under changing environments requiring that epithelial cells rapidly elicit alterations in gene expression patterns to regulate their survival, adapt to stress and keep epithelial homeostasis [67].
Furthermore, we found that three of the DE lncRNAs (XLOC_004376, XLOC_004079, XLOC_029089 and XLOC_025957) that were strongly linked to epithelial adherens junction remodeling and TJ signaling pathways were also collectively negatively correlated with GNM “grey”. This module included genes that are involved in canonical pathways “Bile acid biosynthesis”, “LPS/IL-1 mediated inhibition of RXR function” and “Estrogen biosynthesis” (Table 5, Figure 5). Obviously, XLOC_004079 and XLOC_025957 seem to play a multi-functional role because they were also significantly correlated with two further GNM. XLOC_004079 was correlated with GNM predominantly enriched for genes associated with immune response signaling (interferon induction, antiviral response, TNFR signalling, GNM “greenyellow”) suggesting that XLOC_004079 might be involved in the regulation of the different transcriptional response observed in RES compared to AL calves in the jejunal mucosa of calves as reported in our previous study [27]. In addition, XLOC_004079 was strongly correlated with the GNM “mediumpurple” enriched for genes in the apoptosis signaling pathway. XLOC_025957 revealed significant correlation to GNM “turquoise” and “palevioletred”, indicating a function in “Estrogen receptor binding” and “Assembly of RNA polymerase II/III complexes” as well as “Protein ubiquitination pathway” and “S-methyl-5′-thioadenosine degradation II”. In contrast to the multiply interrelated XLOC_004079 and XLOC_025957, DE lncRNAs XLOC_026410, XLOC_003822 and XLOC_009175 revealed strong correlations with only a single GNM analogous to DE lncRNA XLOC_02093 (Table 5, Figure 5). The first three DE lncRNAs may exert a joint function together with XLOC_004079 in apoptosis signaling pathways (GNM “mediumpurple”) indicating the relevance of a meticulous fine-tuning of the related multifaceted biological processes.
CONCLUSIONS
Altogether, our study provides the first catalogue of 1,042 potential lncRNA loci expressed in the jejunal mucosa of calves. Moreover, we identified nine lncRNAs that displayed different expression pattern in pre-weaning calves in response to different milk supply, and we predicted potential biological roles for DE lncRNAs in cellular signaling and metabolic processes associated with the different nutritional challenge of the calves. DE lncRNAs were predicted to be most likely linked to pathways essential for energy metabolism in the intestinal epithelium and to be associated with signaling pathways focusing on barrier function of intestinal epithelial cells. The DE lncRNAs correlated with GNM enriched with genes associated with these cellular and metabolic processes may represent specific biological transcriptional signatures in the jejuna of pre-weaning calves in response to different diets.
The results of our study will provide a piece of evidence supporting the FAANG initiative to accelerate the structural and functional annotation of noncoding regulatory elements in the bovine genome and deciphering genome to phenome relationships. Given the positional, orthologous conservation of lncRNAs across vertebrates, further investigation of the reproducibility and function of candidate lncRNAs can benefit from the increase in available RNA-seq data and comprehensive gene expression atlas datasets for cattle and other ruminant and livestock species (e.g., [68, 69]). Comparative model transcriptome resources across livestock species might also be valuable to better understand the function and regulation of orthologous human genes. However, additional validation of lncRNA roles in response to different feeding regimen has to be performed in future studies. Interrogating identified gene networks or pathways of interacting genes in more detail will be required to find the central players and identifying the interaction partners of prominent lncRNAs on genome, transcriptome and proteome level in the respective tissue and under different environmental conditions. Knowledge gleaned from this comprehensive analysis will be helpful to better understand the integral balance between the digestive system and nutrient digestion in response to dietary modulation of ruminants at an early stage of life.
MATERIALS AND METHODS
Animals, experimental design and sampling
The experimental design of the study has already been described in detail earlier [27, 28]. The animal experiment was conducted at the Educational and Research Centre for Animal Husbandry, Hofgut Neumuehle, Germany. In brief, twelve male German Holstein calves were reared from birth until day 80 (80.4 ± 1) of age. After initial colostrum feeding, the calves were divided into two feeding groups (6 animals each), which both were fed acidified transition milk (2 mL acidifier/L milk, H. W. Schaumann GmbH, Pinneberg, Germany) for three days. Starting from day four, one calf group (RES) had restricted access to milk replacer diet (6 L/d, milk replacer: 125 g powder per L; Trouw Nutrition Deutschland GmbH, Burgheim, Germany), whereas the second calf group (AL) received milk replacer ad libitum (max. 25 L/d) for the first eight weeks of age. Water was freely available; hay and concentrate (Raiffeisen, Köln, Germany) were offered ad libitum to all calves starting from 10 (±3) days of age. The amount of milk replacer was reduced linearly during week 9 to 10 in both groups and milk was fed in amounts of 2 L/d until the end of the experiment. The ingredients and chemical composition of milk replacer and concentrate and further experimental details were provided in our previous report [27]. Milk, milk replacer, and concentrate intake was documented daily from first to 11th week of age, and body weight was recorded weekly until the end of the experiment as recently described [27, 28]. At slaughtering (day 80), jejunum mucosa samples were collected by scraping the mucosa from the submucosa with a slide and immediately snap-frozen in liquid nitrogen.
Transcriptome sequencing, transcript assembly and analysis of differential expression
Total RNA isolation, quality control of RNA and preparation of indexed, stranded sequencing libraries (polyA selection, TruSeq Stranded mRNA library preparation kit, Illumina) is described in more detail in our previous report [27]. In brief, the libraries were sequenced using a paired-end protocol (2 x 80 bp) on an Illumina HiSeq2500 sequencer platform. After demultiplexing, reads were trimmed for quality and adapter sequences with Cutadapt [70] and in-house linux tools. The reads passing quality control were subjected to further bioinformatics analyses. As described in our previous report [27], read alignment, transcript assembly and differential expression analysis essentially followed the pipeline published by Trapnell and co-workers [71]. Reads of all samples were aligned against the bovine reference genome assembly UMD3.1 (ftp://ftp.ensembl.org/../../pub/release-83/fasta/bos_taurus/dna/) by the Bowtie/Tophat2 pipeline using a guided annotation approach based on the Ensembl annotation 83 (ftp://ftp.ensembl.org/../../pub/release-83/gtf/bos_taurus/) as starting point. The aligned reads were assembled into contigs by Cufflinks2 and the resulting gtf files from all samples and the Ensembl gtf file were merged by Cuffmerge to create the final gtf transcript annotation file, which served for transcript quantification via Cuffdiff2. The guided assembly strategy was selected because of the incomplete Bos taurus genome annotation. In our previous study [27], cluster analysis, multidimensional scaling plot and inspection of individual transcripts demonstrated that one sample from the AL calf group was an outlier compared to the other samples. Therefore, the respective sample was removed from further analyses. Cuffdiff2 (pooled dispersion modelling) was applied to test for differential expression between both calf groups. Based on raw read counts as determined by Cuffdiff2, differences in transcript abundance between the two calf groups were also calculated using edgeR [72] as a second method to validate differentially expressed transcripts [73]. Differential expression analysis results were corrected for multiple testing [74] and considered as significant at q <0.1.
Analysis and classification of unknown transcripts
The RNA-seq data subset representing those transcripts not previously annotated in the bovine transcriptome (class code “u” according to the Cufflinks package, [29]) served as input for the analysis and classification of unknown transcripts and the identification of putative lncRNAs.
To predict lncRNAs from whole transcriptome datasets, numerous computational bioinformatic algorithms and pipelines have been developed [17]. In our study, four different, independent bioinformatic lncRNA prediction tools were applied in parallel: three alignment-free algorithms, CNCI [Coding-Non-Coding Index, [75], https://github.com/www-bioinfo-org/CNCI)], PLEK [(Predictor of long non-coding RNAs and messenger RNAs based on k-mer scheme, [76], https://sourceforge.net/projects/plek/files/)] and FEELnc [(FlExible Extraction of long NonCoding RNAs, https://github.com/tderrien/FEELnc, [77]], and the alignment-dependent algorithm PLAR [(Pipeline for LncRNA Annotation from RNA-seq data [78], http://www.weizmann.ac.il/Biological_Regulation/IgorUlitsky/pipeline-lncrna-annotation-rna-seq-data-plar)]. The selected bioinformatic lncRNA prediction tools extract different sequence-based features and attributes and apply specific filtering steps. For classification of unannotated transcripts applying the four lncRNA prediction tools, we used default parameters as implemented in the specific algorithms. For lncRNA prediction with CNCI we applied the human/vertebrate training dataset as recommended. Only intergenic transcripts with at least two exons were kept in the classification dataset after filtering. For our lncRNA analysis with PLEK we developed a bovine-specific model as suggested by the authors of PLEK. This model was calculated based on Bos taurus lncRNA sequences extracted from the NONCODE 2016 database (http://www.noncode.org/) and Bos taurus protein-coding mRNA sequences extracted from the NCBI Bos taurus UMD3.1.1 genome assembly (ftp://ftp.ncbi.nlm.nih.gov/genomes/Bos_taurus/) as input data). As implemented in PLEK, monoexonic transcripts were not excluded from the analysis. For the lncRNA analysis and classification with FEELnc, we also applied a bovine-specific training dataset based on Bos taurus lncRNA sequences from the NONCODE 2016 database and Bos taurus mRNA sequences (protein-coding biotype) extracted from the NCBI Bos taurus UMD3.1.1 genome assembly. Monoexonic transcripts (default parameter) were generally filtered out, except for those transcribed in antisense direction. The lncRNA analysis with PLAR required downloading respective annotation files for Bos taurus Refseq genes, other Refseq genes, Bos taurus RepeatMasker and chromosome sizes from the UCSC Genome Browser suite (http://genome.ucsc.edu/). Files required regarding features and structures of Bos taurus transcripts were downloaded from the Ensembl Biomart interface (http://www.ensembl.org/biomart/martview/4af292cc38e3f22b21a6cec10ea38471) as recommended.
After performing lncRNA prediction using these four algorithms separately, the intersection between all four bioinformatic tools, and combinations consisting of two and three of them were determined.
Identification of novel yet unreported lncRNAs
Sequence similarity searches with putative lncRNA transcript sequences retrieved from the intersection of the alignment-free lncRNA prediction tools, CNCI, PLEK, and FEELnc, were performed using the BLASTN algorithm against Bos taurus lncRNA sequences deposited in the NONCODE 2016 database (http://www.noncode.org/). The E-value cut-off for a BLAST top hit was considered significant at less than 10E-100, and a stringent threshold for sequence identity was defined to be ≥98% in a region covering ≥100 nucleotides. In a second step, these results were manually curated by localizing those NONCODE lncRNA sequences with significant similarity to positions of lncRNAs from our study in the NCBI Bos taurus UMD3.1.1 reference genome (annotation release 105) using MEGABLAST (https://blast.ncbi.nlm.nih.gov/Blast.cgi) with default parameters. Sequence or locus identity was accepted, if mapping coordinates of the lncRNA sequence from our study and the respective bovine lncRNA locus deposited in the NONCODE 2016 database were concordant. Finally, we extracted those lncRNA sequences from our analyses, which were nearly completely covered by the respective NONCODE lncRNA or vice versa. Highly similar NONCODE lncRNAs had to have nearly full length coverage (>90%) by jejunal lncRNA transcripts from our dataset (i.e., total length of the jejunal lncRNAs could be longer), or lncRNA transcript sequences from our dataset were nearly completely covered (>90%) by NONCODE lncRNAs (i.e., the total length of the NONCODE lncRNAs could be longer) were considered to have full identity.
Co-expression analysis
Weighted gene co-expression network analysis (WGCNA [79]) implemented in the R package WGCNA [80], version 1.61, has been performed to construct a weighted correlation network with protein-coding genes expressed in the calf jejunum transcriptome. Therefore, all gene loci (comprising annotated and unannotated loci) with average normalized FPKM (Fragments per kilo base transcript per million reads) values >0.1 in at least five samples were included in the analysis. An adjacency matrix of pairwise correlations between expression levels of all pairs of genes across all samples was generated, reporting the connection strength between gene pairs. We selected a soft thresholding power β for constructing weighted gene network as calculated by the picSoftThreshold function. The respective scale-free topology index reached saturation at a value of 20. Network modules, designated with different colors, were established by hierarchical clustering. For the module generating function, blockwiseModules, we selected a minimum module size of 30, and a threshold for merging modules of 0.25 while keeping all other parameters at default.
The hypothesis is that genes, which are highly interconnected within a network eigengene module, are generally involved in the same or linked biological pathways. Finally, these gene network modules (GNM) were related to lncRNAs differentially expressed between RES and AL calf groups by determining the correlation between the module eigengene values, which are the first principal components of the gene expression data within the modules, with lncRNA expression levels (co-expression correlation). Differentially expressed lncRNAs were considered to be significantly correlated with a GNM at p <0.05.
Pathway and network analysis
To identify putative lncRNA-related biological pathways and to predict the functional roles of differentially expressed lncRNAs, we performed enrichment, pathway and network analyses using the Ingenuity analysis package (IPA, https://www.qiagenbioinformatics.com/products/ingenuity-pathway-analysis/). Therefore, genes from significantly correlated GNM identified previously by WGCNA were used as input for the IPA analysis. All annotated protein-coding genes of a GNM were included in the analysis, unannotated loci were discarded. We manually edited gene names of those transcripts only annotated with Ensembl annotation ID numbers according to the Ensembl Bos taurus annotation release 90 and NCBI Bos taurus annotation release 105.
Author contributions
R.W. contributed to the experiments, analyzed the data and drafted the manuscript. F.H. helped in data analysis. H.M.H. conceived the study, evaluated the experiment and drafted the manuscript. D.F., C.G., C.Ko. and G.D. performed the animal study and evaluated the experiment. C.Ku. conceived and designed the study, analyzed the data, evaluated the experiment, and drafted the manuscript. All authors read and approved the manuscript.
ACKNOWLEDGMENTS
The authors are grateful to S. Wöhl, B. Pletz and E. Schröder for excellent technical assistance and thank the staff of the Educational and Research Centre for Animal Husbandry Hofgut Neumuehle and the Animal Nutrition team and students at the University of Applied Sciences Bingen.
CONFLICTS OF INTEREST
The authors declare that they have no conflicts of interest.
Ethics approval and consent to participate
The study was approved by the local department for animal welfare affairs (23 177-07/G 13-20-069, Landesuntersuchungsamt, Koblenz, Germany) in conformity with the German Animal Welfare Act.
REFERENCES
1. Heward JA, Linsay MA. Long non-coding RNAs in the regulation of the immune response. Trends Immunol. 2014; 35:408–9.
2. Wapinski O, Chang HY. Long noncoding RNAs and human disease. Trends Cell Biol. 2011; 21:561.
3. Moran VA, Perera RJ, Khalil AM. Emerging functional and mechanistic paradigms of mammalian long non-coding RNAs. Nucl Acids Res. 2012; 40:6391–400.
4. Satpathy AT, Chang HY. Long noncoding RNA in hematopoiesis and immunity. Immunity. 2015; 42:792–804.
5. Zhang Y, Cao X. Long noncoding RNAs in innate immunity. Cell Mol Immunol. 2016; 13:138–47.
6. Zhao XY, Lin JD. Long noncoding RNAs: a new regulatory code in metabolic control. Trends Biochem Sci. 2015; 40:586–96.
7. Qu Z, Adelson DL. Identification and comparative analysis of ncRNAs in human, mouse and zebrafish indicate a conserved role in regulation of genes expressed in brain. PLoS One. 2012; 7:e52275.
8. Hu W, Alvarez-Dominguez JR, Lodish HF. Regulation of mammalian cell differentiation by long non-coding RNAs. EMBO Rep. 2012; 13:971–83.
9. Moran I, Akerman I, van de Bunt M, Xie R, Benazra M, Nammo T, Arnes L, Nakic N, Garcia-Hurtado J, Rodriguez-Segui S, Pasquali L, Sauty-Colace C, Beucher A, et al. Human beta cell transcriptome analysis uncovers incRNAs that are tissue-specific, dynamically regulated, and abnormally expressed in type 2 diabetes. Cell Metab. 2012; 16:435–48.
10. Devaux Y, Zangrando J, Schroen B, Creemers EE, Pedrazzini T, Chang CP, Dorn GW, Thum T, Heymans S. Long noncoding RNAs in cardiac development and ageing. Nat Rev Cardiol. 2015; 12:415–25.
11. Grote P, Herrmann BG. Long noncoding RNAs in organogenesis: making the difference. Trends Genet. 2015; 31:329–35.
12. Elling R, Chan J, Fitzgerald KA. Emerging role of long noncoding RNAs as regulators of innate immune cell development and inflammatory gene expression. Eur J Immunol. 2016; 46:504–12.
13. Gloss BS, Dinger ME. The specificity of long noncoding RNA expression. Biochim Biophys Acta. 2016; 1859:16–22.
14. Rinn JL, Chang HY. Genome regulation by long noncoding RNAs. Annu Rev Biochem. 2012; 81:145–66.
15. Kung JT, Colognori D, Lee JT. Long noncoding RNAs: past, present, and future. Genetics. 2013; 193:651–69.
16. Sanli I, Feil R. Chromatin mechanisms in the developmental control of imprinted gene expression. Int J Biochem Cell Biol. 2015; 67:139–47.
17. Weikard R, Demasius W, Kuehn C. Mining long noncoding RNA in livestock. Anim Genet. 2017; 48:3–18.
18. Li H, Wei X, Yang J, Dong D, Huang Y, Lan X, Plath M, Lei C, Qi X, Bai Y, Chen H. Developmental transcriptome profiling of bovine muscle tissue reveals an abundant GosB that regulates myoblast proliferation and apoptosis. Oncotarget. 2017; 8:32083–100. https://doi.org/10.18632/oncotarget.16644.
19. Liu XF, Ding XB, Li X, Jin CF, Yue YW, Li GP, Guo H. An atlas and analysis of bovine skeletal muscle long noncoding RNAs. Anim Genet. 2017; 48:278–86.
20. Weikard R, Hadlich F, Kuehn C. Identification of novel transcripts and noncoding RNAs in bovine skin by deep next generation sequencing. BMC Genomics. 2013; 14:789.
21. Billerey C, Boussaha M, Esquerre D, Rebours E, Djari A, Meersseman C, Klopp C, Gautheret D, Rocha D. Identification of large intergenic non-coding RNAs in bovine muscle using next-generation transcriptomic sequencing. BMC Genomics. 2014; 15:499.
22. Tong C, Chen QL, Zhao LL, Ma JF, Ibeagha-Awemu EM, Zhao X. Identification and characterization of long intergenic noncoding RNAs in bovine mammary glands. BMC Genomics. 2017; 18:468.
23. Liang RB, Han B, Li Q, Yuan YW, Li JG, Sun DX. Using RNA sequencing to identify putative competing endogenous RNAs (ceRNAs) potentially regulating fat metabolism in bovine liver. Sci Rep. 2017; 7:6396.
24. Koufariotis LT, Chen YP, Chamberlain A, Jagt CV, Hayes BJ. A catalogue of novel bovine long noncoding RNA across 18 tissues. PLoS One. 2015; 10:e0141225.
25. Andersson L, Archibald AL, Bottema CD, Brauning R, Burgess SC, Burt DW, Casas E, Cheng HH, Clarke L, Couldrey C, Dalrymple BP, Elsik CG, Foissac S, et al. Coordinated international action to accelerate genome-to-phenome with FAANG, the functional annotation of animal genomes project. Genome Biol. 2015; 16:57.
26. Tuggle CK, Giuffra E, White SN, Clarke L, Zhou HJ, Ross PJ, Acloque H, Reecy JM, Archibald A, Bellone RR, Boichard M, Chamberlain A, Cheng H, et al. GO-FAANG meeting: a gathering on functional annotation of animal genomes. Anim Genet. 2016; 47:528–33.
27. Hammon HM, Frieten D, Gerbert C, Koch C, Dusel G, Weikard R, Kühn C. Different milk diets have substantial effects on the jejunal mucosal immune system of pre-weaning calves, as demonstrated by whole transcriptome sequencing. Sci Rep. 2018; 8:1693.
28. Frieten D, Gerbert C, Koch C, Dusel G, Eder K, Kanitz E, Weitzel JM, Hammon HM. Ad libitum milk replacer feeding, but not butyrate supplementation, affects growth performance as well as metabolic and endocrine traits in holstein calves. J Dairy Sci. 2017; 100:6648–61.
29. Trapnell C, Williams BA, Pertea G, Mortazavi A, Kwan G, van Baren MJ, Salzberg SL, Wold BJ, Pachter L. Transcript assembly and quantification by RNA-seq reveals unannotated transcripts and isoform switching during cell differentiation. Nat Biotechnol. 2010; 28:511–U174.
30. Hezroni H, Perry RB, Meir Z, Housman G, Lubelsky Y, Ulitsky I. A subset of conserved mammalian long non-coding RNAs are fossils of ancestral protein-coding genes. Genome Biol. 2017; 18:162.
31. Ulitsky I, Bartel DP. LincRNAs: genomics, evolution, and mechanisms. Cell. 2013; 154:26–46.
32. Liu WH, Tsai ZT, Tsai HK. Comparative genomic analyses highlight the contribution of pseudogenized protein-coding genes to human lincRNAs. BMC Genomics. 2017; 18:786.
33. Fagerberg L, Hallstrom BM, Oksvold P, Kampf C, Djureinovic D, Odeberg J, Habuka M, Tahmasebpoor S, Danielsson A, Edlund K, Asplund A, Sjostedt E, Lundberg E, et al. Analysis of the human tissue-specific expression by genome-wide integration of transcriptomics and antibody-based proteomics. Mol Cell Proteomics. 2014; 13:397–406.
34. Szabo L, Morey R, Palpant NJ, Wang PL, Afari N, Jiang C, Parast MM, Murry CE, Laurent LC, Salzman J. Statistically based splicing detection reveals neural enrichment and tissue-specific induction of circular RNA during human fetal development. Genome Biol. 2015; 16:126.
35. Guttman M, Amit I, Garber M, French C, Lin MF, Feldser D, Huarte M, Zuk O, Carey BW, Cassady JP, Cabili MN, Jaenisch R, Mikkelsen TS, et al. Chromatin signature reveals over a thousand highly conserved large non-coding RNAs in mammals. Nature. 2009; 458:223–7.
36. Wolfe CJ, Kohane IS, Butte AJ. Systematic survey reveals general applicability of “guilt-by-association” within gene coexpression networks. BMC Bioinformatics. 2005; 6:227.
37. McBride BW, Kelly JM. Energy-cost of absorption and metabolism in the ruminant gastrointestinal-tract and liver - a review. J Anim Sci. 1990; 68:2997–3010.
38. Piersma T, Lindstrom A. Rapid reversible changes in organ size as a component of adaptive behaviour. Trends Ecol Evol. 1997; 12:134–8.
39. Sarbassov DD, Ali SM, Kim DH, Guertin DA, Latek RR, Erdjument-Bromage H, Tempst P, Sabatini DM. Rictor, a novel binding partner of mTOR, defines a rapamycin-insensitive and raptor-independent pathway that regulates the cytoskeleton. Curr Biol. 2004; 14:1296–302.
40. Yang L, Li P, Yang WJ, Ruan XB, Kiesewetter K, Zhu J, Cao HM. Integrative transcriptome analyses of metabolic responses in mice define pivotal lncRNA metabolic regulators. Cell Metab. 2016; 24:627–39.
41. Kornfeld JW, Bruening JC. Regulation of metabolism by long, non-coding RNAs. Front Genet. 2014; 5:57.
42. Chen Z. Progress and prospects of long noncoding RNAs in lipid homeostasis. Mol Metab. 2016; 5:164–70.
43. Bai ZQ, Chai XR, Yoon MJ, Kim HJ, Alice LO, Zhang ZC, Xu D, Siang DT, Walet AC, Xu SH, Chia SY, Chen P, Yang HY, et al. Dynamic transcriptome changes during adipose tissue energy expenditure reveal critical roles for long noncoding rna regulators. PLoS Biol. 2017; 15:e2002176.
44. Ruan XB. Long non-coding RNA central of glucose homeostasis. J Cell Biochem. 2016; 117:1061–5.
45. Sun M, Kraus WL. From discovery to function: the expanding role of long noncoding RNAs in physiology and disease. Endocr Rev. 2015; 36:25–64.
46. Kong XZ, Hu SS, Sun Z, Zuo LH, Kang J, Zhu ZF, Tian X, Zhang XJ. Regulation of aerobic glycolysis by long non-coding RNAs in cancer. Biochem Biophys Res Commun. 2016; 479:28–32.
47. Goyal N, Sivadas A, Shamsudheen KV, Jayarajan R, Verma A, Sivasubbu S, Scaria V, Datta M. RNA sequencing of db/db mice liver identifies lncRNA H19 as a key regulator of gluconeogenesis and hepatic glucose output. Sci Rep. 2017; 7:8312.
48. Lan X, Yan JD, Ren J, Zhong B, Li J, Li Y, Liu L, Yi J, Sun QZ, Yang XD, Sun J, Meng LS, Zhu WH, et al. A novel long noncoding Rna Lnc-Hc binds hnRNPA2B1 to regulate expressions of Cyp7a1 and Abca1 in hepatocytic cholesterol metabolism. Hepatology. 2016; 64:58–72.
49. Long JY, Badal SS, Ye ZC, Wang Y, Ayanga BA, Galvan DL, Green NH, Chang BH, Overbeek PA, Danesh FR. Long noncoding RNA Tug1 regulates mitochondrial bioenergetics in diabetic nephropathy. J Clin Invest. 2016; 126:4205–18.
50. de Paepe B, Lefever S, Mestdagh P. How long noncoding RNAs enforce their will on mitochondrial activity: regulation of mitochondrial respiration, reactive oxygen species production, apoptosis, and metabolic reprogramming in cancer. Curr Genet. 2018; 64:163–72.
51. Li MX, Sun XM, Cai HF, Sun YJ, Plath M, Li CJ, Lan XY, Lei CZ, Lin FP, Bai YY, Chen H. Long non-coding RNA ADNCR suppresses adipogenic differentiation by targeting miR-204. Biochim Biophys Acta. 2016; 1859:871–82.
52. Groschwitz KR, Hogan SP. Intestinal barrier function: molecular regulation and disease pathogenesis. J Allergy Clin Immunol. 2009; 124:3–20.
53. Takeichi M. Dynamic contacts: rearranging adherens junctions to drive epithelial remodelling. Nat Rev Mol Cell Biol. 2014; 15:397–410.
54. Tunggal JA, Helfrich I, Schmitz A, Schwarz H, Gunzel D, Fromm M, Kemler R, Krieg T, Niessen CM. E-cadherin is essential for in vivo epidermal barrier function by regulating tight junctions. EMBO J. 2005; 24:1146–56.
55. Matter K, Aijaz S, Tsapara A, Balda MS. Mammalian tight junctions in the regulation of epithelial differentiation and proliferation. Curr Opin Cell Biol. 2005; 17:453–8.
56. Chiba H, Osanai M, Murata M, Kojima T, Sawada N. Transmembrane proteins of tight junctions. Biochim Biophys Acta. 2008; 1778:588–600.
57. Holmes JL, Van Itallie CM, Rasmussen JE, Anderson JM. Claudin profiling in the mouse during postnatal intestinal development and along the gastrointestinal tract reveals complex expression patterns. Gene Expr Patterns. 2006; 6:581–8.
58. Van Itallie CM, Anderson JM. The molecular physiology of tight junction pores. Physiology. 2004; 19:331–8.
59. Rahner C, Mitic LL, Anderson JM. Heterogeneity in expression and subcellular localization of claudins 2, 3, 4, and 5 in the rat liver, pancreas, and gut. Gastroenterology. 2001; 120:411–22.
60. Capaldo CT, Farkas AE, Hilgarth RS, Krug SM, Wolf MF, Benedik JK, Fromm M, Koval M, Parkos C, Nusrat A. Proinflammatory cytokine-induced tight junction remodeling through dynamic self-assembly of claudins. Mol Biol Cell. 2014; 25:2710–9.
61. Steele MA, Penner GB, Chaucheyras-Durand F, Guan LL. Development and physiology of the rumen and the lower gut: targets for improving gut health. J Dairy Sci. 2016; 99:4955–66.
62. Malmuthuge N, Li MJ, Goonewardene LA, Oba M, Guan LL. Effect of calf starter feeding on gut microbial diversity and expression of genes involved in host immune responses and tight junctions in dairy calves during weaning transition. J Dairy Sci. 2013; 96:3189–200.
63. Liang GX, Malmuthuge N, Bao H, Stothard P, Griebel PJ, Guan LL. Transcriptome analysis reveals regional and temporal differences in mucosal immune system development in the small intestine of neonatal calves. BMC Genomics. 2016; 17:602.
64. Wood KM, Palmer SI, Steele MA, Metcalf JA, Penner GB. The influence of age and weaning on permeability of the gastrointestinal tract in holstein bull calves. J Dairy Sci. 2015; 98:7226–37.
65. Zou TT, Jaladanki SK, Liu L, Xiao L, Wu J, Xu Y, Gorospe M, Wang JY. miR-675 Regulates intestinal epithelial barrier function by altering expression of ZO-1 and E-cadherin posttranscriptionally. Gastroenterology. 2016; 150:S311.
66. Xiao L, Rao JN, Cao S, Liu L, Chung HK, Zhang Y, Zhang J, Liu YL, Gorospe M, Wang JY. Long noncoding RNA SPRY4-IT1 regulates intestinal epithelial barrier function by modulating the expression levels of tight junction proteins. Mol Biol Cell. 2016; 27:617–26.
67. Wang JY, Xiao L, Wang JY. Posttranscriptional regulation of intestinal epithelial integrity by noncoding rnas. Wiley Interdiscip Rev RNA. 2017; 8:e1399.
68. Clark EL, Bush SJ, McCulloch ME, Farquhar IL, Young R, Lefevre L, Pridans C, Tsang H, Wu CL, Afrasiabi C, Watson M, Whitelaw CB, Freeman TC, et al. A high resolution atlas of gene expression in the domestic sheep (Ovis aries). PLoS Genet. 2017; 13:e1006997.
69. Zhao P, Zheng X, Feng W, Wang H, Kang H, Ning C, Du H, Yu Y, Li B, Zhao Y, Liu JF. Profiling long noncoding RNA of multi-tissue transcriptome enhances porcine noncoding genome annotation. Epigenomics. 2018; 10:301–20.
70. Martin M. Cutadapt removes adapter sequences from high-throughput sequencing reads. EMBnet J. 2011; 17:10–2.
71. Trapnell C, Roberts A, Goff L, Pertea G, Kim D, Kelley DR, Pimentel H, Salzberg SL, Rinn JL, Pachter L. Differential gene and transcript expression analysis of RNA-seq experiments with TopHat and Cufflinks. Nat Protoc. 2012; 7:562–78.
72. McCarthy DJ, Chen Y, Smyth GK. Differential expression analysis of multifactor RNA-Seq experiments with respect to biological variation. Nucl Acids Res. 2012; 40:4288–97.
73. Costa-Silva J, Domingues D, Lopes FM. RNA-Seq differential expression analysis: an extended review and a software tool. PLoS One. 2017; 12:e0190152.
74. Benjamini Y, Hochberg Y. Controlling the false discovery rate - a practical and powerful approach to multiple testing. J Roy Stat Soc Series B Stat Methodol. 1995; 57:289–300.
75. Sun L, Luo H, Bu D, Zhao G, Yu K, Zhang C, Liu Y, Chen R, Zhao Y. Utilizing sequence intrinsic composition to classify protein-coding and long non-coding transcripts. Nucl Acids Res. 2013; 41:e166.
76. Li A, Zhang J, Zhou Z. Plek: a tool for predicting long non-coding RNAs and messenger RNAs based on an improved k-mer scheme. BMC Bioinformatics. 2014; 15:311.
77. Wucher V, Legeai F, Hedan B, Rizk G, Lagoutte L, Leeb T, Jagannathan V, Cadieu E, David A, Lohi H, Cirera S, Fredholm M, Botherel N, et al. FEELnc: a tool for long non-coding RNA annotation and its application to the dog transcriptome. Nucl Acids Res. 2017; 45:e57.
78. Hezroni H, Koppstein D, Schwartz MG, Avrutin A, Bartel DP, Ulitsky I. Principles of long noncoding RNA evolution derived from direct comparison of transcriptomes in 17 species. Cell Rep. 2015; 11:1110–22.
79. Zhang B, Horvath S. A general framework for weighted gene co-expression network analysis. Stat Appl Genet Mol Biol. 2005; 4:17.
80. Langfelder P, Horvath S. WGCNA: an r package for weighted correlation network analysis. BMC Bioinformatics. 2008; 9:559.