
INTRODUCTION
Breast cancer is the most prevalent form of cancer in women, causing approximately one in four of all cases worldwide. In 2012, there were 1.68 million diagnoses and 522,000 deaths according to the World Health Organization, and around 80% of cases occur within patients over the age of 50. Risk factors include obesity, lack of exercise, alcohol consumption, age, family history and age at menarche. The long-term outcome for patients depends on the stage of the tumor and its characteristics at diagnosis.
Established evidence-based treatments for advanced disease includes radiation, chemotherapy, hormonal therapy, and targeted therapies. Due to the application of these treatments, in the developed world survival is relatively high, with between 80% and 90% of those in England and the USA surviving for at least five years.
Hereditary genetic factors are thought to play a minor role in sporadic breast carcinoma, but in approximately 5% of cases it is significant. Germline mutations in the genes BRCA1, BRCA2, p53, PTEN, STK11, CHEK2, ATM, BRIP1 and PALB2 are all considered important in breast cancer tumorigenesis. The genetics of sporadic breast cancer is now better understood, due to genomic sequencing of many such tumors [1]. Somatic driver variants and the mutational processes underlying them have now been identified [2], and the sequencing of 560 breast cancer genomes [3] has furthered progression towards a complete description of the molecular events that cause these tumors. In total, 93 protein-coding cancer genes were found to have probable driver mutations. This and other data including exon sequencing [4], whole genome [5], transcriptional [6], and methylation-based studies [7] have been used to develop a molecular taxonomy of breast cancer.
Molecularly defined characteristics have been used as predictive and prognostic biomarkers in breast cancer to define therapeutic approaches. The earliest such example is the identification of the estrogen receptor (ER) overexpression in a subset of breast carcinomas in the 1970s, and its subsequent targeting with ER directed therapies [8]. Similarly HER2 (human epidermal growth factor receptor 2) overexpression and its targeting with Herceptin [9] have further defined a subset of this disease that behaves and responds uniquely to HER2-directed therapies. Gene chip technologies that use gene expression profiling of the primary tumor such as OncotypeDX, have been FDA approved as a decision aid in early breast cancer to help define prognostic features [10]. Several preclinical studies have identified drug-genome interactions [11]. These have been borne through with great successes in specific situations, such as the EML4-ALK translocation in non-small cell carcinoma of the lung. These specific tissue and gene scenarios have been validated in prospective clinical studies, and have transformed clinical practice [12].
An approach that has gained traction in recent years is the application of molecular characterization beyond established immunohistochemistry (IHC) biomarkers. This has been used to guide therapeutic decision making across many tissue types, after failure of standard therapies. Genomic sequencing of the cancer [13] enables identification of somatic driver variants, which have been associated with therapeutic outcomes in preclinical or clinical studies [14]. The efficacy of this approach is currently unclear across tumor types, as some mutations are only known to be prognostic for response in particular situations; some early attempts at matching therapies failed for this reason, e.g. the use of BRAF inhibitors in BRAF mutant colorectal cancer [15].
It has been shown that tumor profiling of non-responsive breast cancer resulted in better clinical treatments [14], while other studies have demonstrated the benefit of profiling in other tumor types [16]. To investigate the effectiveness of one such profiling method, we evaluated data provided by Caris Life Sciences from their CODE database (version 1.0). This resource describes molecular profiling data that has been used to recommend clinical treatments, and drug regimens used before and after clinicians received this information along with their outcomes. The impact of profiling on drug usage and survival was evaluated here.
RESULTS
Patient characteristics
Data from the Caris CODE database of 92 advanced stage breast cancer patients who underwent treatment was analyzed. These patients were retrospectively divided into two groups, based on their matching of treatments to recommendations that had been generated according to their profiles. In the matched treatment group, 43 patients received at least one recommended drug after collection of tumor sample for profiling and none that were predicted to lack benefit, whereas in the unmatched treatment group 49 patients were given one or more drugs that were classified as having a lack of benefit at any time following profiling. Information about the patients in both groups is summarized in Table 1 (age, ethnicity, histology, tumor grade and stage, and survival information).
Table 1: A summary of patient information comparing the matched and unmatched groups against all patients overall
Patient & Tumor Information |
|||||||
|---|---|---|---|---|---|---|---|
Group |
Age |
Ethnicity |
Histology |
Grade |
Stage |
Survival (Days) |
Mortality |
All patients (92) |
57 |
White: 71 |
Infiltrating duct carcinoma, NOS: 50 |
Grade 3/ Poorly differentiated: 41 (45%) |
IV: 18 (19%) |
583 |
34% |
Matched only (43) |
55.8 |
White: 34 |
Infiltrating duct carcinoma, NOS: 21 |
Grade 3/ Poorly differentiated: 15 (35%) |
II: 13 (30%) |
667 |
26% |
Unmatched (49) |
58.1 |
White: 37 |
Infiltrating duct carcinoma, NOS: 29 |
Grade 3/ Poorly differentiated: 26 (53%) |
IV: 8 (16%) |
510 |
41% |
Treatment analysis
Do patients whose treatments consistently follow profile-based recommendations fare better than patients whose treatments that do not? To compare the overall survival of the two groups that will be referred to as matched and unmatched, waterfall plots for both are shown in Figure 1, where each bar represents a treatment schedule for a breast cancer patient. The 92 bars shown denote 43 matched and 49 unmatched patients (on the left and right respectively). Each set is ordered by survival time following profiling, so that from left to right in the plots patients are displayed as their post-profiling survival time increases. Green lines indicate administration of drugs predicted to be of benefit (and therefore more prevalent in the matched group), red lines are drugs that have a lack of benefit, and yellow corresponds to times when both of these types of drug were received by the patient. The recommendations from Caris are mostly based on the literature.
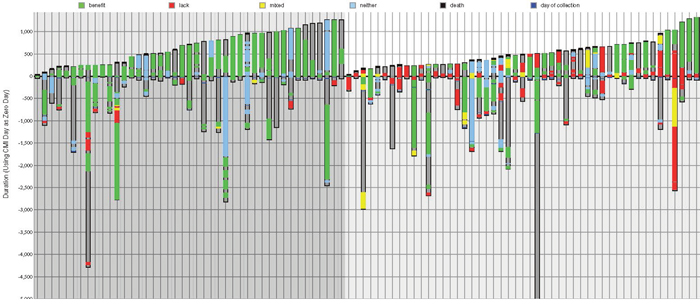
Figure 1: Treatments ordered by survival time for matched and unmatched patients. On the left (darker gray background) - treatment regimens followed by 43 matched patients, in ascending post-profiling survival time; on the right (lighter gray background) - 49 unmatched patients ordered by post-profiling survival time. Each column represents one patient. The y-axis is time (days) where zero is the time of profiling. Dark gray within a column shows the total time monitored from diagnosis to either death or last follow-up; a black line at the top of a column indicates death; green bars represents time on a drug of benefit; red is a lack of benefit drug; yellow is time on a combination therapy associated with both benefit and lack of benefit. Blue bars represent time on a neutral therapy associated with neither benefit nor lack of benefit.
Table 2 shows the drugs most frequently given to all patients compared to the matched and unmatched groups. The number of patients treated with a drug is shown in the first column, and the number of continuous treatment periods is shown in all other columns i.e. treatments of the same patient with intervening periods are counted separately. The drugs given to the most number of patients were cyclophosphamide (70 patients), doxorubicin hydrochloride (58) and docetaxel (56). Overall the most commonly administered drugs were cyclophosphamide (given for 76 time periods), doxorubicin hydrochloride (61), and docetaxel (58). In the matched group docetaxel was given more often than doxorubicin hydrochloride, although cyclophosphamide was still given most often. However, in the matched group after profiling, cyclophosphamide, doxorubicin hydrochloride, paclitaxel and trastuzumab were given less frequently.
Table 2: Most frequently given drug treatments in the matched and unmatched groups, compared with all patients, and the most popular drugs overall that were predicted to be of benefit, lacking benefit, or neither of these
Number of Patients Treated |
Most Frequently Administered Drugs (Total Treatment Periods) |
|||||||
|---|---|---|---|---|---|---|---|---|
All Patients Treated |
All Patients – Treatment Periods |
Matched Only Patients, All Treatments |
Matched, After Profiling Treatments Only |
Unmatched Patients, All Treatments |
Unmatched, After Profiling Treatments Only |
Drugs Predicted of Benefit |
Drugs Predicted to Lack Benefit |
Drugs with No Prediction (Neither of Benefit or Lack of Benefit) |
cyclophosphamide – 70 patients |
cyclophosphamide (76) |
cyclophosphamide (32) |
letrozole; docetaxel (11) |
cyclophosphamide (44) |
docetaxel (13) |
letrozole (28) |
doxorubicin hydrochloride (32) |
cyclophosphamide (73) |
doxorubicin hydrochloride – 58 patients |
doxorubicin hydrochloride (61) |
docetaxel (29) |
- |
doxorubicin hydrochloride (36) |
letrozole (11) |
doxorubicin hydrochloride; trastuzumab (22) |
trastuzumab; docetaxel (11) |
docetaxel (24) |
docetaxel – 56 patients |
docetaxel (58) |
doxorubicin hydrochloride (25) |
carboplatin; capecitabine (7) |
docetaxel (29) |
gemcitabine hydrochloride (10) |
- |
- |
paclitaxel (18) |
carboplatin – 32 patients |
carboplatin (36) |
carboplatin (20) |
- |
trastuzumab (22) |
capecitabine (9) |
docetaxel (21) |
carboplatin (10) |
capecitabine (13) |
letrozole – 31 patients |
trastuzumab (35) |
paclitaxel (17) |
exemestane; gemcitabine hydrochloride (6) |
letrozole (17) |
anastrozole (8) |
tamoxifen citrate (18) |
capecitabine (6) |
carboplatin (12) |
paclitaxel – 29 patients |
letrozole; paclitaxel (32) |
letrozole (15) |
- |
capecitabine; carboplatin; gemcitabine hydrochloride (16) |
cyclophosphamide (6) |
anastrozole (17) |
gemcitabine hydrochloride (5) |
gemcitabine hydrochloride (9) |
capecitabine – 27 patients |
- |
trastuzumab (13) |
nab-paclitaxel (5) |
- |
methotrexate; doxorubicin hydrochloride (5) |
carboplatin (13) |
methotrexate (5) |
fulvestrant (8) |
gemcitabine hydrochloride; trastuzumab – 22 patients |
capecitabine; gemcitabine hydrochloride (27) |
gemcitabine hydrochloride; capecitabine; nab-paclitaxel (11) |
cyclophosphamide; tamoxifen citrate; anastrozole (4) |
- |
- |
gemcitabine hydrochloride (12) |
nab-paclitaxel (4) |
nab-paclitaxel (8) |
- |
- |
- |
- |
paclitaxel (15) |
carboplatin; fluorouracil; vinorelbine tartrate (4) |
exemestane (9) |
anastrozole; pegylated liposomal doxorubicin hydrochloride; |
bevacizumab; vinorelbine tartrate (7) |
anastrozole; nab-paclitaxel; tamoxifen citrate – 19 patients |
anastrozole; nab-paclitaxel (21) |
- |
- |
anastrozole (11) |
- |
fluorouracil (8) |
- |
- |
Most commonly given drugs are listed in descending order going down, with the total number of treatments shown in parentheses (except the first column, which shows the number of patients treated).
On average patients received 5.8 drug treatments. Of these, 40% (2.3 drugs) were predicted to be of benefit, 19% (1.1 drugs) lacked benefit, and 41% (2.4) being neither. Matched patients on average had 5.6 drug treatments – 49% (2.7 drugs) of these were profiled to be of benefit, 6% (0.4) lacked benefit, and 45% (2.5) being neither. Unmatched patients received an average of 5.9 drug treatments; 32% (1.9 drugs) of these were of benefit, 31% (1.8) lacked benefit, and 37% (2.2) neither.
In the unmatched set, 76% of patients received at least one drug treatment predicted to be of benefit, and 49% received two or more drug treatments of this type.
The most commonly given drugs of benefit were letrozole (28), doxorubicin hydrochloride (22), trastuzumab (22), and docetaxel (21). The most commonly given lack of benefit drugs were doxorubicin hydrochloride (32), trastuzumab (11) and docetaxel (11). Some of the administered drugs did not have a recommendation for or against, and appear in the “neither” category. This neither class makes up 45% of drugs administered in the matched cohort versus 38% in the unmatched cohort. The most common agent by far in the neither category was cyclophosphamide (given for 73 time periods, i.e. 13% of all drug treatments for this cohort).
As might be expected, some of the drugs that were most commonly used were administered at similar rates whether or not they were predicted to be of benefit to the patient. However, 31% of the times that trastuzumab was given it was expected to lack benefit. Doxorubicin hydrochloride was only given 38% of the time when it was thought to be beneficial, while 55% of the time it was predicted to lack benefit. Letrozole was used when profiled to be of help 88% of the time. We note that palbociclib was not used in combination with letrozole in any of the cases in the breast cohort studied here, but most of these cases were prior to the FDA approval of this drug. Tamoxifen citrate was prescribed 95% of the time when it was expected to be favorable, and anastrozole was also well matched, being given 85% of the time that it was predicted to be of value.
Survival analysis
Patients in the matched group on average survived for 667 days after the day of profiling, compared to 510 days for patients whose treatments did not match their molecular profile (P=0.0316); this is an increase of 31%.
In the matched group 26% of patients were deceased by the end of the time of monitoring compared to 41% of the unmatched group of patients (P=0.1257).
Patients who received more than one drug in the lack-of-benefit category trended towards worse overall survival (OS) than patients who received only a single drug in this category: 550 days versus 461 days.
A Kaplan-Meier curve (Figure 2, top-right) shows the improvement in OS from time of profiling for patients treated only with therapies predicted to be of benefit by their molecular profile, and separately, patients who received at least one drug predicted to lack benefit. Figure 2 (left) also gives a comparison of biomarkers between matched and unmatched groups, and (middle-right and lower-right plots) matched versus unmatched: age of patients, survival time, treatment numbers and grade of samples.
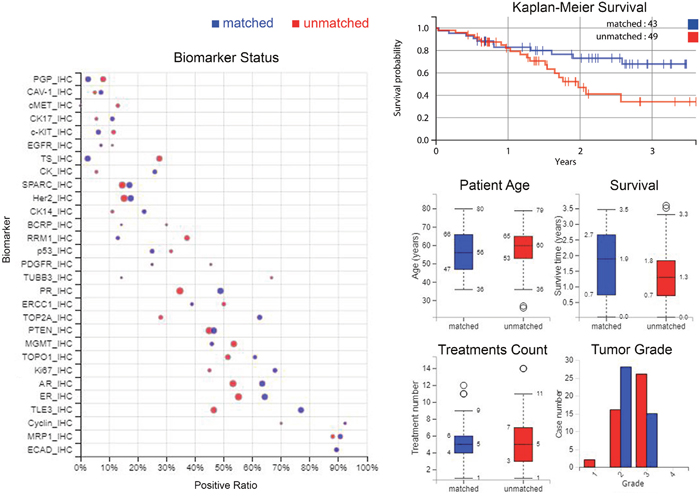
Figure 2: Differences between matched and unmatched groups in biomarker statuses, survival, demographics and tumour grade. Left: Comparison of biomarkers between matched and unmatched groups; positive ratio represents the percentage of the cases that have “positive” biomarker results. Specifically, for IHC, positive is defined as protein expression being above a predetermined threshold. For sequencing biomarkers, positive is defined as a gene mutation (usually pathogenic). The size of the circle indicates the number of cases. Top-right: A Kaplan-Meier curve showing the increase in overall survival from time of profiling for those patients treated only with therapies predicted to be of benefit by their molecular profile, compared to those patients who received at least one therapy predicted to lack benefit. Middle-right and lower-right: Comparison of age of patients, survival time, treatment numbers, grade of samples, between matched and unmatched. Blue denotes matched patients and red is unmatched patients in all plots.
DISCUSSION
Predictive biomarkers – matched treatments better than unmatched
This report looked at data from a breast carcinoma cohort made available from Caris Life Sciences via their CODE database. This was a retrospective review of a cohort of patients that were profiled using established IHC biomarkers, along with fragment analysis, in situ hybridization and sequencing. Their treatments were either matched or unmatched based on whether the treatment chosen by their physician was predicted to be beneficial by Caris Life Sciences using the molecular profile of the tumor. Patients whose treatments subsequently agreed with these recommendations were compared to those who received at least one drug that was predicted to lack benefit, i.e. their regimen did not agree with their tumor profile-based treatment predictions. Comparing these two groups showed that the matched treatment group had an increase of 31% in survival compared to the average for the unmatched group, an increase of 157 days from 510 to 667 days (P=0.0316).
When comparing the matched and unmatched groups, in terms of HER2 and ER directed therapies, there was a similar level of use – in the matched group 87% of treatments were of either of these types, and in the unmatched group 83% of the treatments were one of these two types.
The unmatched group received 0.32 more lines of therapy on average than the matched group, survived for less time, and had a higher mortality rate. This could have been influenced by the tendency for the unmatched group to have tumors that were generally more advanced than in the matched group, as shown in Table 1. The unmatched group may have received more treatments overall and been less adherent to the recommended treatments, due to clinicians trying all possible options as a last resort as the disease advanced, although this is speculative.
Interestingly, across this cohort of patients, the expression of ER and PR was found to be prognostic for overall survival (see Figure 3). The expression of the androgen receptor (AR) was also found to be prognostic; this agrees with previously published data that shows improved long-term survival with co-expression of AR in ER positive breast cancers [16].
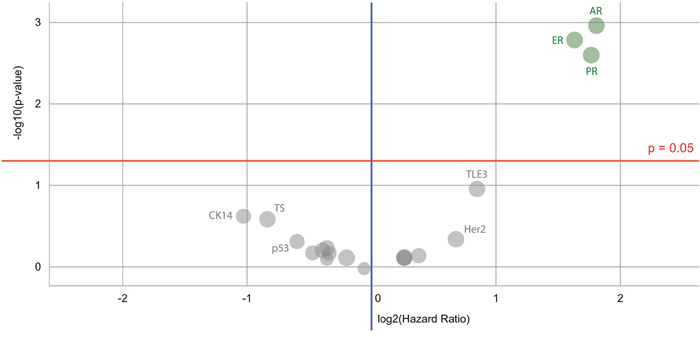
Figure 3: Volcano plot of biomarkers’ prognostic value for a Caris breast cancer dataset. Biomarkers of significance that can be used to indicate differences in survival are found in a cluster on the top right – these are the immunohistochemistry androgen receptor (AR), estrogen receptor (ER) and progesterone receptor (PR) markers. Color code: green = the hazard rate of a positive biomarker result is significantly lower than that of a negative biomarker result; gray = the difference between a positive biomarker result and a negative biomarker result is not significant.
The survival curves from time of diagnosis initially overlap and then diverge after profiling occurs. This may suggest that basing therapy on tumor profiling has an effect on selecting optimal therapies and improving outcome. Combined with the increase in survival and lowering of death rates, this leads to the conclusion that there is a beneficent role of tumor molecular profiling in this cohort.
MATERIALS AND METHODS
The Caris CODE database (Comprehensive Oncology Database Explorer) contains tumor molecular profile data for 841 patients with solid tumors in version 1.0. It also contains demographic information about the patients, their drug treatments that they received before and after molecular profiling, and records of their clinical outcomes. There are 92 breast cancer patients recorded, and this breast cancer cohort was mined after web scraping the data from the Caris website, to determine if molecular characterization recommendations influenced drug selection by their physicians after the time of profiling, and if any molecular subsets had different outcomes. Table 1 describes the clinical characteristics of the patients in this breast cancer cohort. According to Caris, 33% of the samples were from metastatic samples; 50% of these metastatic breast samples were from the lymph nodes, and the rest were from other sites.
The amount of time that patients were monitored varied, as shown in Figure 1. On average patients’ treatment records were available for 1327 days after diagnosis (1342 for matched treatment patients and 131 for unmatched), and on average the time of monitoring after profiling was 583 days. The longest period of monitoring after tumor profiling (the patient represented on the furthest right of Figure 1) was 1317 days; this was 1407 days after diagnosis. The longest amount of time that records were available, i.e. after diagnosis up until the last contact day, was 9427 days.
The data were analysed independently of Caris. Patients were covered under 1 of 4 different protocols or exemptions, listed as follows. (1). The Caris Registry Protocol (TCREG-001-00-V2-1209) was approved by WIRB (WIRB Tracking #20092285) and has an NCT# of NCT02678754. (2). The Caris POA Prospective Repository (COE-001-0815) was approved by WIRB (WIRB Tracking #20162864) and has an NCT# of NCT03324841. (3). The Caris POA Retrospective Repository (COE-002-0116) was approved by WIRB (WIRB Tracking #20162657) and has an NCT# of NCT 00326499. (4). ION data is covered under an IRB exemption. All data are retrospective and have been de-identified prior to Caris receiving it and authors performing independent analyses.
Abbreviations
AR: androgen receptor; HER2: human epidermal growth factor receptor 2; IHC: immunohistochemistry; ER: estrogen receptor; OS: overall survival; PR: progesterone receptor.
Author contributions
All authors contributed equally to the work described in this paper and were involved in writing it.
ACKNOWLEDGMENTS
Thanks to Caris Life Sciences for the provision of their CODE database and the data contained within, and assistance by Dr David Spetzler, Todd Maney, Dr Jia Zeng, Dr Tina Lui, Dr Nick Xiao and Stephanie Ratliff in the use of this resource. We are also grateful to the patients involved in this study.
CONFLICTS OF INTEREST
Authors received no funding or honoraria for this publication. The data were analysed independently of Caris. Lee S. Schwartzberg is on the scientific advisory board of Caris Life Sciences.
FUNDING
This work was supported by the Action Against Cancer charity (http://www.aacancer.org/). Infrastructure support was provided by the Imperial Experimental Cancer Medicine Centre, the CRUK Imperial Centre, and the Imperial NIHR Biomedical Research Centre.
REFERENCES
1. Stephens PJ, Tarpey PS, Davies H, Van Loo P, Greenman C, Wedge DC, Nik-Zainal S, Martin S, Varela I, Bignell GR, Yates LR, Papaemmanuil E, Beare D, et al, and Oslo Breast Cancer Consortium (OSBREAC). The landscape of cancer genes and mutational processes in breast cancer. Nature. 2012; 486:400–04.
2. Alexandrov LB, Nik-Zainal S, Wedge DC, Aparicio SA, Behjati S, Biankin AV, Bignell GR, Bolli N, Borg A, Børresen-Dale AL, Boyault S, Burkhardt B, Butler AP, et al, and Australian Pancreatic Cancer Genome Initiative, and ICGC Breast Cancer Consortium, and ICGC MMML-Seq Consortium, and ICGC PedBrain. Signatures of mutational processes in human cancer. Nature. 2013; 500:415–21.
3. Nik-Zainal S, Davies H, Staaf J, Ramakrishna M, Glodzik D, Zou X, Martincorena I, Alexandrov LB, Martin S, Wedge DC, Van Loo P, Ju YS, Smid M, et al. Landscape of somatic mutations in 560 breast cancer whole-genome sequences. Nature. 2016; 534:47–54.
4. Pereira B, Chin SF, Rueda OM, Vollan HK, Provenzano E, Bardwell HA, Pugh M, Jones L, Russell R, Sammut SJ, Tsui DW, Liu B, Dawson SJ, et al. The somatic mutation profiles of 2,433 breast cancers refines their genomic and transcriptomic landscapes. Nat Commun. 2016; 7:11479.
5. Nik-Zainal S, Alexandrov LB, Wedge DC, Van Loo P, Greenman CD, Raine K, Jones D, Hinton J, Marshall J, Stebbings LA, Menzies A, Martin S, Leung K, et al, and Breast Cancer Working Group of the International Cancer Genome Consortium. Mutational processes molding the genomes of 21 breast cancers. Cell. 2012; 149:979–93.
6. Shlien A, Raine K, Fuligni F, Arnold R, Nik-Zainal S, Dronov S, Mamanova L, Rosic A, Ju YS, Cooke SL, Ramakrishna M, Papaemmanuil E, Davies HR, et al, and ICGC Breast Cancer Working Group, Oslo Breast Cancer Research Consortium. Direct Transcriptional Consequences of Somatic Mutation in Breast Cancer. Cell Reports. 2016; 16:2032–46.
7. Smid M, Rodríguez-González FG, Sieuwerts AM, Salgado R, Prager-Van der Smissen WJ, Vlugt-Daane MV, van Galen A, Nik-Zainal S, Staaf J, Brinkman AB, van de Vijver MJ, Richardson AL, Fatima A, et al. Breast cancer genome and transcriptome integration implicates specific mutational signatures with immune cell infiltration. Nat Commun. 2016; 7:12910.
8. Ward HW. Anti-oestrogen therapy for breast cancer: a trial of tamoxifen at two dose levels. BMJ. 1973; 1:13–14.
9. Bozovic-Spasojevic I, Azim HA Jr, Paesmans M, Suter T, Piccart MJ, de Azambuja E. Neoadjuvant anthracycline and trastuzumab for breast cancer: is concurrent treatment safe? Lancet Oncol. 2011; 12:209–11.
10. Baxter E, Gondara L, Lohrisch C, Chia S, Gelmon K, Hayes M, Davidson A, Tyldesley S. Using proliferative markers and Oncotype DX in therapeutic decision-making for breast cancer: the B.C. experience. Curr Oncol. 2015; 22:192–98.
11. Garnett MJ, Edelman EJ, Heidorn SJ, Greenman CD, Dastur A, Lau KW, Greninger P, Thompson IR, Luo X, Soares J, Liu Q, Iorio F, Surdez D, et al. Systematic identification of genomic markers of drug sensitivity in cancer cells. Nature. 2012; 483:570–75.
12. Shaw AT, Kim DW, Nakagawa K, Seto T, Crinó L, Ahn MJ, De Pas T, Besse B, Solomon BJ, Blackhall F, Wu YL, Thomas M, O’Byrne KJ, et al. Crizotinib versus chemotherapy in advanced ALK-positive lung cancer. N Engl J Med. 2013; 368:2385–94.
13. Frampton GM, Fichtenholtz A, Otto GA, Wang K, Downing SR, He J, Schnall-Levin M, White J, Sanford EM, An P, Sun J, Juhn F, Brennan K, et al. Development and validation of a clinical cancer genomic profiling test based on massively parallel DNA sequencing. Nat Biotechnol. 2013; 31:1023–31.
14. Khirade MF, Lal G, Bapat SA. Derivation of a fifteen gene prognostic panel for six cancers. Sci Rep. 2015; 5:13248.
15. Corcoran RB. New therapeutic strategies for BRAF mutant colorectal cancers. J Gastrointest Oncol. 2015; 6:650–59.
16. Hu R, Dawood S, Holmes MD, Collins LC, Schnitt SJ, Cole K, Marotti JD, Hankinson SE, Colditz GA, Tamimi RM. Androgen receptor expression and breast cancer survival in postmenopausal women. Clin Cancer Res. 2011; 17:1867–74.