
Introduction
Only 2% of RNAs encode for proteins in human cells. Although the large majority is not translated, RNAs play major roles in regulating transcriptional and non-transcriptional processes [1]. Long non-coding RNAs (lncRNAs) are eukaryotic RNAs longer than 200 nucleotides, with no coding capacity. Altered lncRNA expression has been associated with the development of cancer and other diseases [2]. Furthermore, several lncRNAs have shown promise as cancer biomarkers and potential therapeutic targets in several cancer subtypes [3-5]. However, the majority of those studies explored the role of a specific single lncRNA. Thus, comprehensive characterization of the landscape of lncRNAs in a cancer subtype has not been achieved because most genome-wide studies have used microarrays, which have the disadvantage of being biased toward the inclusion of probes that map the known protein-coding transcriptome [6].
Breast cancer is a heterogeneous disease with significant molecular variations, both between tumor subtypes and within a single tumor [7]. In 2000, Perou and colleagues proposed a molecular classification of breast cancer based on transcriptional profiling and cDNA microarrays [8]. Four main subtypes were identified and defined as basal-like, HER-2 enriched, luminal A, and luminal B [8, 9]. The PAM50 assay measures the mRNA expression levels of 50 genes and classifies breast cancers into the same subtypes [10]. Nevertheless, a classification of human breast cancer by lncRNA subtypes has not been established and the correlation between lncRNA subtype and mRNA expression has not been clarified [11]. Unfortunately, the panorama of lncRNAs in breast cancer has not been elucidated because this non-coding part of the genome was previously viewed as transcriptional noise [12]. In addition, genome-wide transcriptomic sequencing, which allows investigators to explore hundreds of tumors simultaneously, has only been available in recent years. Thanks to The Cancer Genome Atlas (TCGA) and the International Cancer Genome Consortium (ICGC) projects, we can conduct a comprehensive bioinformatic analysis to determine the panorama of lncRNAs across breast cancer subtypes.
The influence of lncRNAs is achieved by transcriptional interference, induced chromatin remodeling and histone modifications [13]. One of the best known lncRNAs, HOTAIR, affects the structure of chromatin through the polycomb repressive complex 2 (PRC2), and has been shown in vivo to promote breast cancer [14]. The discovery of HOTAIR as an independent prognostic factor in breast cancer was initially reported by Gupta and collaborators [14] and later validated in another cohort [15]. In addition, recent studies have shown that lncRNAs can be associated with enhancer regions, leading to increased activity of neighboring genes [16, 17]. Herein, we speculate that the identification of expressed lncRNAs, and more specifically those located in enhancer regions, may help to determine key lncRNAs involved in breast carcinogenesis. Targeting these key lncRNAs may then provide new therapeutic options for patients with breast cancer.
Using an important cohort that encompasses more than 600 samples from TCGA, we generated the first bioinformatic computation of the lncRNA subtype classification in a large cohort of breast cancer specimens that are fully clinically annotated. In addition, we performed an integrative analysis of the lncRNAs with mRNAs and chromatin histone modifications, with the aim of assessing the functional relevance of those lncRNAs. Our results unravel four subtypes of breast cancer with clinical relevance and provide the framework for future studies on lncRNAs in breast cancer.
Results
Landscape of expressed lncRNAs in human breast cancer
While single lncRNAs have been previously shown to be specifically expressed in invasive breast cancers, the comprehensive catalogue of expressed lncRNAs remains unknown. To explore lncRNAs that play major roles in breast cancer, we reasoned that the FPKM (fragments per kilobase of non-overlapped exon per million fragments mapped) value of those lncRNAs must be greater than 1 in at least 10% of a large set of breast cancer samples. For the purpose of the analysis, we first extracted RNAseq data from TCGA, which included a total of 869 breast cancer samples. We selected 658 invasive ductal carcinomas that had transcriptomic classification data available (PAM50 assay). As a result, our cohort included 302 samples classified as luminal A, 167 samples classified as luminal B, 126 samples classified as basal-like, and 63 samples classified as HER2-enriched (Figure 1A; Table S1). We excluded samples that had normal-like breast cancer signatures because they may contain high proportions of contamination with normal tissue [10, 18]. We also excluded from this analysis other histologic subtypes of breast cancer (lobular, mucinous, etc.).
According to GENCODE gene annotation V15, which constitutes the largest manually curated catalogue of human lncRNAs, there are 13,159 lncRNAs that can be grouped into six categories based on their location with respect to protein-coding genes. There are 19,595 known coding genes in the human genome. The known lncRNAs include antisense RNAs (n=4424), large intergenic non-coding RNAs “lincRNAs” (n=6,421), sense overlapping transcripts (n=144), sense intronic transcripts (n=647), processed transcripts (n=1341) and 3-prime overlapping non-coding RNAs (n=37). After filtering the dataset to remove the lncRNAs that have low expression levels, we ended up with 1,623 expressed lncRNAs that are potentially relevant in breast cancer (Figure 1B; Table S2). Those lncRNAs include some already known to be involved in cancer, such as H19 and HOTAIR (Table 1), as well as novel lncRNAs never reported in breast cancer (e.g., HOTAIRM1). The lncRNAs known to be expressed in other tumor types (e.g., prostate cancer) were not expressed in our dataset of 1,623 lncRNAs, which demonstrates tissue specificity (Table 1). We then asked whether the distributions of lncRNAs and mRNAs are different according to their FPKM values and find that the expression level of lncRNAs is very low as compared to the level of mRNAs (Figure S1), which is previously well known.
Table 1: Curated cancer-related lncRNAs extracted from the literature
lncRNA gene name |
Expressed |
Differentially expressed
|
Breast subtype classification |
Functional annotation in the literature |
PCA3 |
- |
- |
- |
Prostate |
GAS5 |
Yes |
Yes |
basal |
Breast |
PVT1 |
Yes |
Yes |
luminal B |
breast, gastric |
DANCR |
Yes |
Yes |
basal |
Breast |
PCAT1 |
- |
- |
- |
Prostate |
PCCEM1 |
- |
- |
- |
Prostate |
NEAT1 |
Yes |
Yes |
luminal A |
breast, ovarian |
KCNQ10T1 |
- |
- |
- |
colon, esophagus |
MALAT1 |
Yes |
Yes |
luminal B |
breast, colon lung, osteosarcoma |
HOTAIR |
Yes |
Yes |
HER2-enriched |
Breast |
HOTAIRM1 |
Yes |
Yes |
basal |
- |
MEG3 |
Yes |
Yes |
luminal A |
brain, liver |
UCA1 |
- |
- |
bladder cancer |
|
H19 |
Yes |
Yes |
basal |
bladder, breast, colon, kidney, liver, ovarian |
ANRIL |
- |
- |
- |
Prostate |
XIST |
Yes |
No |
- |
breast, colorectal, ovarian, testicular |
ZFAS1 |
- |
- |
- |
Prostate |
DLEU1 |
- |
- |
- |
Prostate |
RMST |
- |
- |
- |
rhabdomyosarcoma |
HOST2 |
- |
- |
- |
Ovarian |
BIC |
- |
- |
- |
B cell lymphoma |
NAMA |
- |
- |
- |
Liver |
HULC |
- |
- |
- |
papillary thyroid |
To determine the biological relevance of the lncRNAs we identified, we applied a web-based analytic tool, GREAT, which analyzes the annotations of the neighboring genes [19]. We discovered that most lncRNAs were located in the vicinity of genes that played key roles in breast carcinogenesis (Table S2). Those include ESR1, MAPT, GATA3, ZNF703, FOXA1, SOX4 and SOX9. Notably, we found that those lncRNAs were positively associated with the expression of the neighboring genes, suggesting that lncRNAs are cis-acting elements that influence master breast cancer regulators, and thus drive breast carcinogenesis (Table S2).
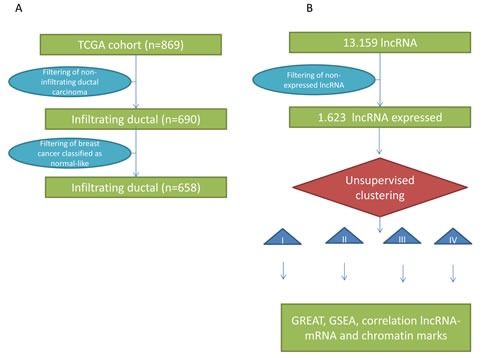
Figure 1: A) Flowchart for patient selection of breast cancer samples from The Cancer Genome Atlas (TCGA) project. B) Flowchart of methods used for analysis of lncRNAs.
Classification of lncRNA subtypes in human breast cancers
We then considered whether the lncRNAs expressed in breast cancer samples were associated with the transcriptomic classification based on PAM50. Our lncRNA-based unsupervised hierarchical consensus clustering revealed four subgroups (Figure 2A), which were highly correlated with the mRNA transcriptomic classification based on PAM50 (p=6.79x10-243) (Table S3). Interestingly, clusters I, II and III were highly correlated with the basal-like, HER2-enriched, and luminal A transcriptomic subtypes, respectively. Indeed, cluster III contained close to the majority of luminal A tumors (n=164; 89.13%). Conversely, cluster IV contained the majority of luminal B tumors (n=143; 85.6%), but also 46% (n=134/291) of luminal A tumors (Figure 2A; Table S3). Kaplan-Meier survival curves show that the four lncRNA groups display distinct lengths of overall survival (OS; p=0.01). Of note, the OS time corresponding to cluster III was better than that corresponding to cluster IV (Figure 2B). It is interesting that the median OS time for patients belonging to cluster III of the lncRNA-based classification was not reached, which was not the case for patients belonging to the luminal A subgroup as identified by PAM50 classification (Figure S2). However, the data were based on short follow-up periods; thus, it remains undetermined whether the lncRNA classification is better than the PAM50 classification for prognostic purposes. We conclude that there is cross-talk between lncRNA and mRNA. The principal component analysis we conducted showed similar patterns, confirming the robustness of our analysis (Figure S3). To further elucidate the clinical relevance of our lncRNA classifications, we investigated the molecular network governing each breast cancer cluster.
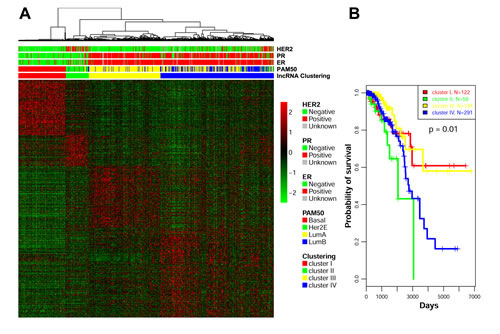
Figure 2: A) Unsupervised clustering of lncRNAs identified 4 clusters: cluster I (related to the basal-like breast cancer subtype), cluster II (related to the HER-2 enriched subtype), cluster III (related to luminal A subtype), and cluster IV (related to luminal A and B subtypes). Correlation with PAM50 classification, estrogen receptor (ER), progesterone receptor (PR) and HER2 status are depicted. B) Kaplan-Meier curve for overall survival in the 4 lncRNA transcriptomic classifications.
Cluster I – related to the basal-like breast cancer subtype (PAM50 classification). Overall, 122 lncRNAs were considered to be overexpressed in cluster I as compared to the other clusters, using a fold change (FC) ≥ 2 and a false discovery rate (FDR) < 0.05. The lncRNA HOTAIRM1 was significantly overexpressed in this cluster. HOTAIRM1 was previously shown to interact with polycomb repressive complexes 1 (PRC1) and 2 (PRC2), but was not reported to be involved in cancer (Figure 3A). Of note, HOTAIRM1 expression was highly positively correlated with the expression of the HOXA1 adjacent gene (Pearson correlation coefficient r=0.74) (Table S2). We also identified two lncRNAs, AC005152.3 and RP11-84E24.2, with unknown functions among the top lncRNAs overexpressed in cluster I as compared to the other clusters (Figure 3B-C). Interestingly, the expressions of both of these lncRNAs were highly associated with the expression of the SOX9 gene (r=0.43) (Table S2), and they were located within the vicinity of the SOX9 gene, which was recently shown to determine the mammary stem cell state [20]. The list of all lncRNAs and their correlation with the mRNA expression of neighboring genes is provided in Table S2. The lncRNAs differentially expressed between the four subtypes are reported in Tables S4-S7, along with the corresponding correlations with copy number gains or losses.
Cluster II – related to the HER-2 enriched breast cancer subtype (PAM50 classification). Overall, 57 lncRNAs were considered to be overexpressed in cluster II as compared to the other clusters. Importantly, the lncRNA HOTAIR located on chromosome 12q13.3 was significantly overexpressed in cluster II (FDR<0.0005; FC=2) (Figure 3D), and its expression was positively correlated with the expression of the adjacent gene HOXC11 (r=0.84). The expression of HOTAIR was independent of the copy number gain.
Clusters III and IV – related to the luminal A and luminal B breast cancer subtypes (PAM50 classification). Overall, 45 and 51 lncRNAs were identified as being overexpressed in clusters III and IV, respectively. The two top overexpressed lncRNAs (RP11-53O19.2 and RP11-473L15.3) in cluster III were located within the vicinity of the MRPS30 gene in the 5q12 chromosomal region, which has been associated with estrogen receptor (ER)-positive tumors as well as a favorable prognosis (Figure 3E-F) [21]. Moreover, these two lncRNAs were associated with positive expression of MRPS30 (r=0.67).
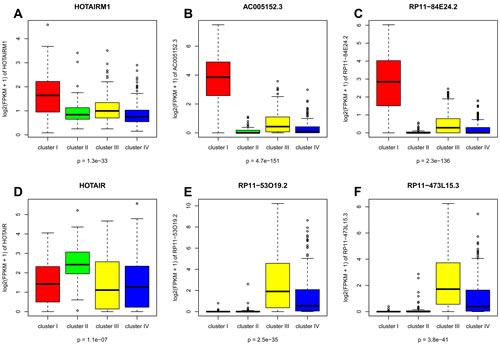
Figure 3: Boxplot for expression levels of lncRNAs: (A) HOTAIRM1, (B) AC005152.3, (C) RP11-84E24.2, (D) HOTAIR, (E) RP11-53O19.2 and (F) RP11-473L15.3.
Identification of potential driver lncRNAs in breast cancer
The correlation between lncRNA expression and the expression of protein-coding genes has not been fully delineated. Whether lncRNAs are cis-acting (influencing neighboring genes) or trans-acting (influencing more distant genes) has not been determined [22-24]. Analysis of GENCODE v7 revealed that both trans- and cis-acting lncRNA expressions correlate with the expression of protein-coding genes [24]. Derrien et al. found more positive and extreme lncRNA-mRNA and mRNA-mRNA correlations in cis-acting elements than in trans-acting elements, and that the lncRNAs with expressions that significantly correlate with those of nearby protein-coding genes may be drivers [24]. To answer this question in breast cancer, we used GREAT to define the neighboring genes [19]. Using an FDR<0.05 and a fold change ≥ 2, we identified a set of overexpressed lncRNAs in each of the four lncRNA clusters, which included 122, 56, 45 and 51 lncRNAs in clusters I, II, III and IV, respectively. Of note, those lncRNAs were cis-acting on 203 protein-coding genes in cluster I, 96 protein-coding genes in cluster II, 96 protein-coding genes in cluster III, and 90 protein-coding genes in cluster IV. Furthermore, there was little overlap between those genes. Cluster I showed overexpression of the lncRNAs that influence their neighboring genes, ALDH1A3 (a breast cancer stem cell marker), SOX4, SOX9, and VIM. Furthermore, we found those genes to be overexpressed in cluster I as compared to the other clusters: ALDH1A3 (FC=2.7; FDR=2.9*10-10), SOX4 (FC=1.6; FDR=1.7*10-7), SOX9 (FC=2.7; FDR=5.8*10-25), and VIM (FC=1.8; FDR=1.3*10-12). Cluster II (related to the HER2-enriched subtype) showed overexpression of the lncRNAs cis-acting on HOXB2 and HOXC11 genes. Cluster III showed overexpression of the lncRNAs cis-acting on GATA3, FOXA1 and FOXD2. Cluster IV showed overexpression of the lncRNAs cis-acting on ZNF703, ESR1, WISP2 and FGFR1 genes. Of note, SOX4 is a master regulator of the epithelial-mesenchymal transition (EMT) in breast cancer [20], and is associated with overexpression of LINC00340, a cis-acting element in cluster I (basal-related). Importantly, the expression of the SOX9 gene in cluster I was associated with the expression of the four cis-acting lncRNAs (Table S2).
Pathway analysis using GREAT showed that the lncRNAs that were overexpressed in cluster I are enriched for cis-acting genes that belong to the following 4 gene sets: (1) up-regulated genes in the basal-like subtype of breast cancer (p=6.78*10-7); (2) 100 transcription regulators showing the most correlated expression with the 9 “embryonic stem cell” transcription factors that are preferentially and coordinately overexpressed in high-grade, ER-negative breast cancer (p=1.93*10-8); (3) genes down-regulated in bone relapse of breast cancer (p=5.47*10-8) and (4) down-regulated genes from the optimal set of 550 markers discriminating breast cancer samples by ESR1 [Gene ID=2099] expression: ER(+) vs ER(-) tumors (p=7.48*10-5).
Puzzlingly, we did not find any pathway enrichment for cluster II, which raised questions about the role of lncRNAs in HER2-enriched tumors. Cluster III exhibited enrichment for genes that are down-regulated in basal-like breast cancer (p=3.32*10-8) and for genes that are down-regulated in brain relapse of breast cancer (p=1.43*10-5). Cluster IV was enriched for genes that are up-regulated in the luminal B subtype of breast cancer (p=3.9*10-6) and for genes that are down-regulated in breast cancer tumors (formed by MCF-7 xenografts) that are resistant to tamoxifen [PubChem=5376] (p=2.58*10-8). These results are remarkable because the luminal B subtype has been associated with resistance to hormonal treatment even in the presence of estrogen and/or progesterone receptor overexpression [25]. We then looked at the lncRNAs near ESR1, GATA3, and FOXA1 and analyzed if their expression is only coordinated in luminal breast cancer but not in basal-like breast cancer as the high expression of these genes is characteristic in luminal breast cancer. As expected, the expression levels of 3 of those lncRNAs were significantly highly expressed in luminal subtypes as compared to basal subtypes (Figure S4).
Thus, we conclude that it is likely that genes located in the vicinity of those lncRNAs are co-regulated and play an important role in driving tumor resistance to endocrine therapy. Additional studies will be needed to determine whether tumors classified to lncRNA cluster IV represent the subgroup of patients with hormone-receptor–positive breast cancer that is resistant to hormonal therapy.
A subset of lncRNAs associated with enhancers
Previous studies have reported that the patterns of lncRNA expression show specificity to the cell type and are likely to be controlled epigenetically [26]. Furthermore, recent studies have revealed that lncRNAs display enhancer-like functions.17 Thus, we analyzed the relationship between the 1,623 lncRNAs we identified in TCGA breast cancer data and different histone markers. As expected, H3K27me3 and H3K9me3 were associated with repressed genes, and H3K4me3, H3K4me2, H3K36me3, and H3K27ac were associated with expressed genes in human mammary epithelial cells (HMECs) (Figure 4A). Similar findings were observed for the breast cancer cell line MCF-7 (not shown). Of note, 197 lncRNAs are bivalent (H3K4me3/H3K27me3) in HMECs, as compared to 34 lncRNAs in MCF-7 cells. Out of those, we can mention HOTAIRM1, which was expressed in HMECs and marked by H3K4me3, but was bivalent and repressed in MCF-7 cells. Strikingly, the majority of lncRNAs marked by H3K27me3 (a polycomb mark) in HMECs were not identified in MCF-7 cells (Figure 4B; Table S8), which is consistent with their gene expression changes (Figure 4C). These data highly suggest a putative role of H3K27me3 demethylase UTX (KDM6A) in the derepression of these lncRNAs in breast cancer cells, through a mechanism identical to that of coding genes. We then considered whether the H3K27me3 demethylase UTX or the polycomb complex genes (EED, SUZ12, and EZH2) were associated with the patient’s outcome. Strikingly, only SUZ12 and KDM6A were associated with a poor outcome; EZH2 was not (Figure 4D-E).
We then investigated whether lncRNAs are associated with enhancers, which are defined as genomic regions marked by acetylation with H3K27ac. Strikingly, 1,038 out of 1,623 were found to be marked by H3K27ac in HMECs and/or MCF-7 cells, suggesting that those lncRNAs may act as enhancers. Using more stringent criteria by defining the enhancers as regions bearing H3K27ac and H3K4me2, we identified 937 lncRNAs in HMECs that had both marks.
As expected, gene set enrichment analysis (GSEA) showed that HOTAIR, which is overexpressed in cluster II, was associated with genes with high-CpG-density promoters (HCPs) that are marked with H3K27me3 in precursor cells of brain and neural tissue [27]. Unexpectedly, we discovered a novel association of differentially expressed lncRNAs with histone marks. For instance, H19, which is overexpressed in the basal-like breast cancer subgroup, was enriched for genes with HCP marked by H3K4me2 and H3K4me3 [27], suggesting that H19 may interact with the trithorax group of proteins, which maintains gene expression. Strikingly, the overexpression of MEG3 and RP11-417E7.2 was associated with the enrichment of bivalent genes in different samples, including embryonic stem cells. Although these data are important, further validation is needed to clarify the role of those lncRNAs in breast cancer.
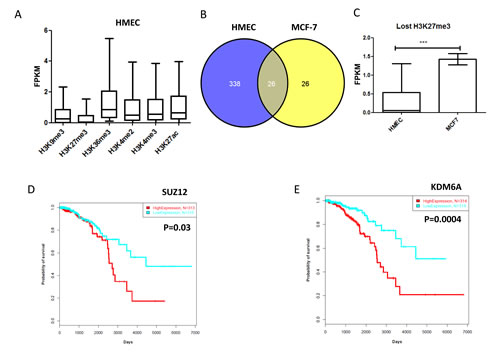
Figure 4: A) Boxplot for gene expression using FPKM for lncRNAs according to corresponding histone marks. Note that the lncRNAs marked by inactive histone marks H3K27me3 and H3K9me3 have low expression. B) Venn diagram for the number of lncRNAs marked by H3K27me3 in HMECs and MCF-7. C) Bar graph for median lncRNA expression level of genes with H3K27me3 mark in HMECs, as compared to genes without this mark in MCF-7 cells. Note that lncRNAs that lost H3K27me3 had increased gene expression. D) Kaplan-Meier curves for overall survival time in patients with breast cancer according to SUZ12 expression. E) Kaplan Meier curves for overall survival time in patients with breast cancer according to KDM6A expression.
Integrative analysis of lncRNA-mRNA functional associations
The expression of lncRNAs in loci known to function transcriptionally has been shown to correlate with the expression of the coding transcripts at those loci [28]. However, according to the category to which the lncRNAs belong (cis-antisense, intronic, or bidirectional), the correlation with their associated protein-coding genes may differ. In fact, the expression of both intronic and bidirectional lncRNAs has been shown to correlate with the expression of their associated coding genes [28, 29]. For example, we identified the lncRNA RP3-443C4.2 within the vicinity of estrogen receptor 1 (ESR1), a gene with important functions in breast cancer. The expression profiles of ESR1 and the lncRNA RP3-443C4.2 were highly correlated. However, RP3-443C4.2 was significantly overexpressed in cluster IV, but not in cluster III, suggesting a distinct regulation of ESR1 in cluster III versus that in cluster IV. Of note, RP3-443C4.2 was positively correlated with the expression of 24 neighboring and distant genes, including ESR1, GATA3, and ZNF703. ZNF703 is an oncogene commonly associated with luminal B breast cancer, and was previously shown to have differential control of luminal and basal progenitors in epithelial cells of the breast [30].
Consistent with a previous report, we found general correlation between the expression of cis-antisense lncRNAs and pairs of protein-coding genes [29]. For example, a cis-antisense lncRNA, MAPT-AS1, exhibits a positive correlation (r=0.70, p<10-16) with its sense protein-coding gene, MAPT. This gene has an essential role in determining the breast tumor response to paclitaxel [31]. Moreover, MAPT-AS1 was highly correlated with the expression of the progesterone receptor (PGR and TMEM26). Strikingly, this lncRNA was not expressed at all in clusters I and II of our lncRNA classification of breast cancer (Figure S5).
Association of lncRNAs with overall survival time
We considered whether lncRNA expression is associated with patient outcome. We used a Cox model in which all the 1,623 lncRNAs were correlated with overall survival in the TCGA cohort. We found 6 lncRNAs to be associated with patient outcome (FDR<0.05). Two of them (TOPORS-AS1, RP11-35G9.3) were associated with a good outcome (Figure 5A-B). Interestingly, these lncRNAs were associated with a loss of the activating mark H3K36me3 in breast cancer cell line MCF-7 as compared to that in human mammary epithelial cells (HMECs). This is consistent with their repression in cancer and suggests that they act as tumor suppressors. Of note, topoisomerase I binding, arginine/serine-rich, E3 ubiquitin protein ligase (TOPORS) is considered to be a probable tumor suppressor that is involved in cell proliferation and apoptosis through the regulation of p53/TP53 stability via ubiquitin-dependent degradation.
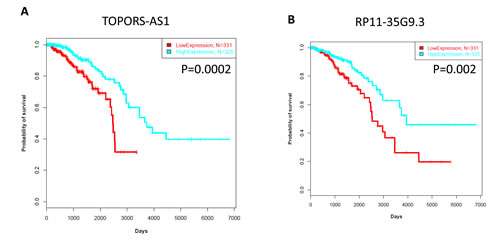
Figure 5: A) Kaplan-Meier curves for overall survival time in patients with breast cancer according to expression of TOPORS-AS1. B) Kaplan-Meier curves for overall survival time in patients with breast cancer according to expression of RP11-35G9.3.
Discussion
To the best of our knowledge, this study represents the first comprehensive description of expressed lncRNAs in breast cancer, as identified through bioinformatic analysis of RNAseq data in a large patient cohort that encompasses 658 infiltrating ductal carcinomas of the breast. Our in-depth genomic analyses unraveled several novel findings. First, we identified the expression of 1,623 lncRNAs that are likely to play important roles in breast cancer initiation and progression, and connected their expression with chromatin marks of HMECs and the MCF-7 breast adenocarcinoma cell line. As expected, our bioinformatic approach validated previous observations such as the link between HOTAIR expression and the PRC2 complex in breast cancer [14], giving us confidence in our methodology. We identified several novel lncRNAs that had not been previously reported in breast cancer. For example, we found that the HOTAIRM1 was overexpressed in the basal-like subtype of breast cancer. Of note, the expression of HOTAIRM1 was previously shown to be specific to the myeloid lineage of hematopoietic cells [32]. Mechanistically, HOTAIRM1 may act by modulating gene expression in the HoxA gene cluster. Thus, further studies are needed to clarify its role in the basal-like subtype of breast cancer.
Second, we provided a new molecular classification of breast cancer using lncRNA expression. Indeed, according to this classification, we found that samples related to lncRNA clusters I and II highly overlap with the basal-like and HER2-enriched subgroups, respectively. Conversely, lncRNA clusters III and IV display a completely different distribution of luminal A and luminal B samples. These data are important because the unsupervised clustering of breast cancers was independent from the ER, HER2 and PR status. This classification may outperform the PAM50 classification for predicting a patient’s response to hormonal therapy and prognosis. However, in the absence of important information on clinical follow-up and clinical response to hormonal therapy, such comparisons cannot be made and will require future studies.
Another important topic is the interplay between lncRNA and chromatin marks. We discovered that almost two thirds of the lncRNAs expressed in breast cancer are localized at enhancer regions. Identifying and targeting those enhancers may provide new therapeutic opportunities for breast cancer. More importantly, the majority of lncRNAs marked by H3K27me3 in normal breast tissue (HEMC) did not show that mark in the MCF-7 cancer cell line. We speculate that H3K27me3 demethylase may play a role in this process. Of note, UTX overexpression was associated with poor patient outcome in our series, which was not the case for EZH2. This finding is in accordance with a recent report showing that UTX overexpression is associated with poor outcome in breast cancer.33 In contrast with previous studies, however, we did not observe a negative impact of EZH2 expression on patient outcome [34].
Our study identified two lncRNAs, TOPORS-AS1 and RP11-35G9.3, that may act as tumor suppressors because their overexpression was associated with a good outcome. Notably, these 2 lncRNAs were marked by H3K36me3 in HMEC, but not in the MCF-7 breast cancer cell line, which is consistent with their repression. Mechanistic studies are needed to clarify the role of those lncRNAs on tumor proliferation and invasion. If validated in an independent cohort, those lncRNAs may serve as robust biomarkers.
Future studies should also focus on the role of lncRNAs in shaping chromatin. Our integrative analysis of chromatin modifications with lncRNAs identified several lncRNAs that were associated with histone marks (e.g., H3K4me3 and H3K4me2 for H19) in normal breast tissue and breast cancer cell lines. HOTAIR and PCAT-1 were previously shown to interact with the PRC2 complex [14, 35].
From a clinical standpoint, our preliminary data indicate that lncRNA-based clustering identifies variations in patient prognosis; however, we cannot make definitive conclusions because outcomes data are very limited in the TCGA database. Additional studies will be needed to compare the new lncRNA-based classification of breast cancer with PAM50 and other classifications based on transcriptomics. From a therapeutic perspective, MAPT-AS1, the antisense lncRNA for MAPT (tau protein), was previously shown to exhibit sensitivity to paclitaxel [31]. We identified MAPT-AS1 to be exclusively expressed in clusters III and IV (compared to clusters I and II), which is consistent with luminal A and B breast cancers. We found a positive correlation between MAPT-AS and MAPT. However, MAPT-AS may also serve as a predictive and prognostic marker in breast cancer, as previously demonstrated [36].
Our study represents the first comprehensive analysis of lncRNAs in breast cancer, with integrative analysis revealing that the majority of those lncRNAs act as enhancers. These data provide a rationale for targeting lncRNAs in breast cancer, and suggest that lncRNAs may be used in the future to predict response to treatment as well as patient outcome. We believe this study sets the stage for a new framework for future research in the role of lncRNAs in breast cancer.
MATERIALS AND METHODS
The Cancer Genome Atlas (TCGA) Data
TCGA breast cancer RNA-Seq data (bam files) and their related clinical data were obtained from the Cancer Genomics Hub (CGHub, https://cghub.ucsc.edu/) and TCGA Data Portal (https://tcga-data.nci.nih.gov/tcga/). The paired-end FASTQ files for each sample were extracted from bam files using bam2fastq (http://www.hudsonalpha.org/gsl/information/software/bam2fastq).
ChIP-Seq data
ChIP-Seq peak data for histone marks H3K4me3, H3K4me2, H3K36me3, H3K27ac, H3K27me3 and H3K9me3 in both human mammary epithelial cells (HMECs) and breast cancer cell line MCF-7 were obtained from the UCSC ENCODE Histone Modification Tracks (http://genome.ucsc.edu/cgi-bin/hgTrackUi?hgsid=331813161&c=chr21&g=wgEncodeHistoneSuper). To examine the histone modification profiles of lncRNA genes, we analyzed the promoter regions of lncRNA genes for overlap with histone mark enrichment peaks. Specifically, the lncRNA was defined to be marked/associated with a specific histone mark if the peak from ChIP-Seq data for a specific histone mark was located within +/- 5kb from the transcription start site (around the promoter regions) for the lncRNA.
Mapping/Alignment
The raw, paired-end reads in FASTQ format were then aligned to the human reference genome, GRCh37/hg19, using MOSAIK alignment software [37]. MOSAIK works with paired-end reads from Illumina HiSeq 2000, and uses both a hashing scheme and the Smith-Waterman algorithm to produce gapped optimal alignments and to map exon junction-spanning reads with a local alignment option for RNA-seq. The resulting alignments were then saved as a standard bam file.
The raw counts for each gene of both mRNAs and lncRNAs from RNA-seq
We then counted the mapped reads in genomic features such as genes (mRNAs and lncRNAs) annotated in GENCODE15 to generate the raw counts for each gene using the HTSeq-count script distributed with the HTSeq package. We chose the “union” mode of HTSeq to mask the regions that overlapped between mRNAs and lncRNAs to overcome the issue of non-strand-specific RNA sequencing in the kit (TruSeq) used in TCGA data.
Count data normalization
Raw reads count data were normalized across samples with DESeq_1.10.1 [38]. Specifically, DESeq first estimates the effective library size, which is also called size factor, by dividing each column by the geometric means of the rows given a matrix or data frame of raw count data. Then, the median of these ratios (skipping the genes with a geometric mean of zero) are used as the size factor for that column. With the estimation of size factors, DESeq then divides each column of the count table by the size factor for that column. By doing that, the count values are brought to a common scale, making them comparable across samples. Furthermore, we transformed the count data by the varianceStabilizingTransformation function provided in the DESeq package. With this function, the standard deviation of each gene is roughly constant regardless of the gene expression magnitude.
FPKM calculation
We calculated the number of fragments per kilobase of non-overlapped exon per million fragments mapped (FPKM). Since the raw count data per gene were generated with the “union” mode in HTSeq, where the reads mapped to the overlapping regions between mRNAs and lncRNAs were not counted, the exon sequences for which overlap between mRNAs and lncRNAs exists were excluded when we calculated the gene lengths for both mRNAs and lncRNAs.
Low expression filtering
To reduce noise, we kept only mRNAs or lncRNAs with FPKM equal to or above 1 in at least 10% of the samples for downstream analysis.
Detection of differential mRNA and lncRNA expressions
All statistical analyses were performed using the R and R-Bioconductor statistical programming environment. We identified differentially expressed mRNAs and lncRNAs using DESeq with the standard comparison mode between the two experimental conditions. P values were adjusted for multiple testing with an embedded Benjamini-Hochberg procedure in DESeq.
Consensus clustering by lncRNAs
To assess the stability of the discovered clusters, we performed consensus clustering. We conducted 500 runs of hierarchical clustering on the resampled data. For each run, 80% samples and 80% lncRNAs were randomly chosen. The distance measurement was set as a Pearson correlation, and the linkage function was set as “Ward.” Based on the 500 runs, a consensus was obtained by taking the average over the connectivity matrices of every perturbed dataset. Then we carried out hierarchical clustering with the consensus matrix as a similarity matrix, with “Euclidean” as the distance measurement and “Ward” as the linkage function. We also calculated the Bayesian information criterion to detect the number of clusters.
Correlation matrix of lncRNA-mRNA
We generated a correlation matrix between lncRNAs and mRNAs by computing the Pearson correlation coefficient between all pairs of significant lncRNAs and mRNAs. A matrix was constructed with entries in the ternary scale (-1, 0, 1), where the top 1% with negative correlation was assigned -1; the top 1% with positive correlation was assigned 1; and the others were assigned 0. The matrix was clustered and visualized using a Euclidian distance metric and complete linkage clustering.
Gene set enrichment analysis (GSEA)
In order to associate functional gene sets to each lncRNA, we performed GSEA as previously described [39, 40]. Specifically, we used each lncRNA as a profile/phenotype, and computed the Pearson correlation coefficient for each lncRNA-mRNA combination. For each lncRNA, mRNAs were ranked according to the Pearson correlation coefficient to generate ranked gene (mRNA) lists for GSEA using 10,295 functional gene set collections from the GSEA Molecular Signatures Database. Gene sets with a false discovery rate (FDR) below 5% were considered significant, and the GSEA normalized enrichment scores (NES) were transformed to a ternary scale (-1, 0, 1), where FDR>0.05 was assigned a value of 0; FDR<0.05 & NES>0 was assigned 1; and FDR<0.05 & NES<0 was assigned -1. We used R package GSA41 to perform GSEA and to construct an association matrix of each lncRNA, with each of 10,295 functional gene sets whose entries are the ternary scale (-1, 0, 1) prior to hierarchical clustering. We then performed biclustering on this matrix to identify significant lncRNAs associated with functional gene sets.
Disclosure of potential conflicts of interest
The authors declare no conflicts of interest.
Acknowledgments
This work was supported in part by NIH through the National Center for Research Resources, grant UL1TR000371 (X.S., F.M.B.), the NIH/NCI through MD Anderson Cancer Center CCSG, P30 CA016672 (X.S., J.N.W.) and Leukemia SPORE P50 CA100632 (X.S., J.N.W.), the Michael & Susan Dell Foundation and the Mary K. Chapman Foundation (X.S., J.N.W.), and the Breast Cancer Research Foundation (F.J.E.).
Abbreviations
EMT - epithelial-mesenchymal transition
ER – estrogen receptor
FC - fold change
FDR – false discovery rate
FPKM - fragments per kilobase of non-overlapped exon per million fragments mapped
GSEA - gene set enrichment analysis
HCP - high-CpG-density promoter
HER2 – human epidermal growth factor receptor – 2
HMEC - human mammary epithelial cell
ICGC - International Cancer Genome Consortium
lncRNA – long non-coding RNA
NES – normalized enrichment score
OS – overall survival
PR – progesterone receptor
PRC1, PRC2 - polycomb repressive complex 1, polycomb repressive complex 2
r – Pearson correlation coefficient
TCGA – The Cancer Genome Atlas
TOPORS - topoisomerase I binding, arginine/serine-rich, E3 ubiquitin protein ligase
References
1. Wilusz JE, Sunwoo H, Spector DL. Long noncoding RNAs: functional surprises from the RNA world. Genes Dev 2009; 23:1494-1504.
2. Wapinski O, Chang HY. Long noncoding RNAs and human disease. Trends Cell Biol 2011; 21:354-61.
3. Crea F, Watahiki A, Quagliata L, Xue H, Pikor L, Parolia A, Wang Y, Lin D, Lam WL, Farrar WL, et al. Identification of a long non-coding RNA as a novel biomarker and potential therapeutic target for metastatic prostate cancer. Oncotarget 2014; 5:764-74.
4. Shi Y, Lu J, Zhou J, Tan X, He Y, Ding J, Tian Y, Wang L, Wang K. Long non-coding RNA Loc554202 regulates proliferation and migration in breast cancer cells. Biochem Biophys Res Commun 2014; pii: S0006-291X(14)00432-X. doi: 10.1016/j.bbrc.2014.02.144. [Epub ahead of print]
5. Zhuang M, Gao W, Xu J, Wang P, Shu Y. The long non-coding RNA H19-derived miR-675 modulates human gastric cancer cell proliferation by targeting tumor suppressor RUNX1. Biochem Biophys Res Commun 2014; Jan 2. pii: S0006-291X(13)02197-9. doi: 10.1016/j.bbrc.2013.12.126. [Epub ahead of print].
6. Du Z, Fei T, Verhaak RG, Su Z, Zhang Y, Brown M, Chen Y, Liu XS. Integrative genomic analyses reveal clinically relevant long noncoding RNAs in human cancer. Nat Struct Mol Biol 2013; 20:908-13.
7. Polyak K. Heterogeneity in breast cancer. J Clin Invest 2011; 121:3786-8.
8. Perou CM, Sorlie T, Eisen MB, van de Rijn M, Jeffrey SS, Rees CA, Pollack JR, Ross DT, Johnsen H, Akslen LA, et al. Molecular portraits of human breast tumours. Nature 2000; 406:747-52.
9. Sorlie T, Perou CM, Tibshirani R, Aas T, Geisler S, Johnsen H, Hastie T, Eisen MB, van de Rijn M, Jeffrey SS, et al. Gene expression patterns of breast carcinomas distinguish tumor subclasses with clinical implications. Proc Natl Acad Sci U S A 2001; 98:10869-74.
10. Parker JS, Mullins M, Cheang MC, Leung S, Voduc D, Vickery T, Davies S, Fauron C, He X, Hu Z, et al. Supervised risk predictor of breast cancer based on intrinsic subtypes. J Clin Oncol 2009; 27:1160-7.
11. Piao HL, Ma L. Non-coding RNAs as regulators of mammary development and breast cancer. J Mammary Gland Biol Neoplasia 2012; 17:33-42.
12. Ponting CP, Belgard TG. Transcribed dark matter: meaning or myth? Hum Mol Genet 2010; 19:R162-8.
13. Mercer TR, Dinger ME, Mattick JS. Long non-coding RNAs: insights into functions. Nat Rev Genet 2009; 10:155-9.
14. Gupta RA, Shah N, Wang KC, Kim J, Horlings HM, Wong DJ, Tsai MC, Hung T, Argani P, Rinn JL, et al. Long non-coding RNA HOTAIR reprograms chromatin state to promote cancer metastasis. Nature 2010; 464:1071-6.
15. Lu L, Zhu G, Zhang C, Deng Q, Katsaros D, Mayne ST, Risch HA, Mu L, Canuto EM, Gregori G, et al. Association of large noncoding RNA HOTAIR expression and its downstream intergenic CpG island methylation with survival in breast cancer. Breast Cancer Res Treat 2012; 136:875-83.
16. Orom UA, Shiekhattar R. Long non-coding RNAs and enhancers. Curr Opin Genet Dev 2011; 21:194-8.
17. Orom UA, Shiekhattar R: Noncoding RNAs and enhancers: complications of a long-distance relationship. Trends Genet 2011; 27:433-9.
18. Peppercorn J, Perou CM, Carey LA. Molecular subtypes in breast cancer evaluation and management: divide and conquer. Cancer Invest 2008; 26:1-10.
19. McLean CY, Bristor D, Hiller M, Clarke SL, Schaar BT, Lowe CB, Wenger AM, Bejerano G. GREAT improves functional interpretation of cis-regulatory regions. Nat Biotechnol 2010; 28:495-501.
20. Guo W, Keckesova Z, Donaher JL, Shibue T, Tischler V, Reinhardt F, Itzkovitz S, Noske A, Zurrer-Hardi U, Bell G, et al. Slug and Sox9 cooperatively determine the mammary stem cell state. Cell 2012; 148:1015-28.
21. Stacey SN, Manolescu A, Sulem P, Thorlacius S, Gudjonsson SA, Jonsson GF, Jakobsdottir M, Bergthorsson JT, Gudmundsson J, Aben KK, et al. Common variants on chromosome 5p12 confer susceptibility to estrogen receptor-positive breast cancer. Nat Genet 2008; 40:703-6.
22. Orom UA, Derrien T, Beringer M, Gumireddy K, Gardini A, Bussotti G, Lai F, Zytnicki M, Notredame C, Huang Q, et al. Long noncoding RNAs with enhancer-like function in human cells. Cell 2010; 143:46-58.
23. Cabili MN, Trapnell C, Goff L, Koziol M, Tazon-Vega B, Regev A, Rinn JL. Integrative annotation of human large intergenic noncoding RNAs reveals global properties and specific subclasses. Genes Dev 2011; 25:1915-27.
24. Derrien T, Johnson R, Bussotti G, Tanzer A, Djebali S, Tilgner H, Guernec G, Martin D, Merkel A, Knowles DG, et al. The GENCODE v7 catalog of human long noncoding RNAs: analysis of their gene structure, evolution, and expression. Genome Res 2012; 22:1775-89.
25. Creighton CJ. The molecular profile of luminal B breast cancer. Biologics 2012; 6:289-97.
26. Wu SC, Kallin EM, Zhang Y. Role of H3K27 methylation in the regulation of lncRNA expression. Cell Res 2010; 20:1109-16.
27. Meissner A, Mikkelsen TS, Gu H, Wernig M, Hanna J, Sivachenko A, Zhang X, Bernstein BE, Nusbaum C, Jaffe DB, et al. Genome-scale DNA methylation maps of pluripotent and differentiated cells. Nature 2008; 454:766-70.
28. Engstrom PG, Suzuki H, Ninomiya N, Akalin A, Sessa L, Lavorgna G, Brozzi A, Luzi L, Tan SL, Yang L, et al. Complex Loci in human and mouse genomes. PLoS Genet 2006; 2:e47.
29. Dinger ME, Pang KC, Mercer TR, Mattick JS. Differentiating protein-coding and noncoding RNA: challenges and ambiguities. PLoS Comput Biol 2008; 4:e1000176.
30. Holland DG, Burleigh A, Git A, Goldgraben MA, Perez-Mancera PA, Chin SF, Hurtado A, Bruna A, Ali HR, Greenwood W, et al. ZNF703 is a common Luminal B breast cancer oncogene that differentially regulates luminal and basal progenitors in human mammary epithelium. EMBO Mol Med 2011; 3:167-80.
31. Rouzier R, Rajan R, Wagner P, Hess KR, Gold DL, Stec J, Ayers M, Ross JS, Zhang P, Buchholz TA, et al. Microtubule-associated protein tau: a marker of paclitaxel sensitivity in breast cancer. Proc Natl Acad Sci U S A 2005; 102:8315-8320.
32. Zhang X, Lian Z, Padden C, Gerstein MB, Rozowsky J, Snyder M, Gingeras TR, Kapranov P, Weissman SM, Newburger PE. A myelopoiesis-associated regulatory intergenic noncoding RNA transcript within the human HOXA cluster. Blood 2009; 113:2526-34.
33. Kim JH, Sharma A, Dhar SS, Lee SH, Gu B, Chan CH, Lin HK, Lee MG. UTX and MLL4 coordinately regulate transcriptional programs for cell proliferation and invasiveness in breast cancer cells. Cancer Res 2014; 74:1705-17.
34. Kleer CG, Cao Q, Varambally S, Shen R, Ota I, Tomlins SA, Ghosh D, Sewalt RG, Otte AP, Hayes DF, et al. EZH2 is a marker of aggressive breast cancer and promotes neoplastic transformation of breast epithelial cells. Proc Natl Acad Sci U S A 2003; 100:11606-11.
35. Prensner JR, Iyer MK, Balbin OA, Dhanasekaran SM, Cao Q, Brenner JC, Laxman B, Asangani IA, Grasso CS, Kominsky HD, et al. Transcriptome sequencing across a prostate cancer cohort identifies PCAT-1, an unannotated lincRNA implicated in disease progression. Nat Biotechnol 2011; 29:742-9.
36. Baquero MT, Lostritto K, Gustavson MD, Bassi KA, Appia F, Camp RL, Molinaro AM, Harris LN, Rimm DL. Evaluation of prognostic and predictive value of microtubule associated protein tau in two independent cohorts. Breast Cancer Res 2011; 13:R85.
37. Hillier LW, Marth GT, Quinlan AR, Dooling D, Fewell G, Barnett D, Fox P, Glasscock JI, Hickenbotham M, Huang W, et al. Whole-genome sequencing and variant discovery in C. elegans. Nat Methods 2008; 5:183-8. doi: 10.1038/nmeth.1179.
38. Anders S, Huber W. Differential expression analysis for sequence count data. Genome Biol 2010; 11:R106.
39. Guttman M, Amit I, Garber M, French C, Lin MF, Feldser D, Huarte M, Zuk O, Carey BW, Cassady JP, et al. Chromatin signature reveals over a thousand highly conserved large non-coding RNAs in mammals. Nature 2009; 458:223-7.
40. Subramanian A, Tamayo P, Mootha VK, Mukherjee S, Ebert BL, Gillette MA, Paulovich A, Pomeroy SL, Golub TR, Lander ES, et al. Gene set enrichment analysis: a knowledge-based approach for interpreting genome-wide expression profiles. Proc Natl Acad Sci U S A 2005; 102:15545-50.
41. Efron B, Tibshirani R. On testing the significance of gene sets. Ann Appl Stat 2007; 1:107-129.