
INTRODUCTION
High-grade serous ovarian carcinomas (HGSOCs) comprise the majority of serous ovarian carcinomas (SOCs), as they account for 80%–90% of these tumours and are the most aggressive [1–3]. Advanced cases comprise more than 70% of all HGSOCs, and 5-year overall survival is only 30% for this group of patients [3]. Low-grade serous ovarian carcinomas (LGSOCs), based on their indolent growth pattern, do not respond well to chemotherapy, but they have a better prognosis with significantly longer progression-free survival (PFS) rates [1, 3]. The morphological aspects of SOCs and their histological grades provide important diagnostic information, but immunohistochemistry (IHC) is an important tool that is used in differential diagnosis and in the evaluation of molecular features, which further aids in the characterization of morphology and clinical behaviour [4].
The Wilms Tumor 1 (WT1) gene, located on chromosome 11p13, was first identified as the gene responsible for the development of a childhood malignancy [5]. However, WT1 expression has also been demonstrated in various adult cancers [6–8]. Its location in the female genital tract is usually used to distinguish SOC from other tumour types. Some studies have evaluated the immunoexpression of WT1 and its correlation with prognosis in ovarian cancer [9–13].
TP53 gene encodes the 53-KDa nuclear protein that is responsible for maintaining the integrity of the genome via the induction of cellular apoptosis in cases of DNA damage [14]. Mutations in the TP53 gene may be suggested by IHC criteria. TP53 gene mutations are present in nearly 100% of HGSOCs [3]. Diffuse and strong nuclear expression or complete lack of expression (null type) are associated more with TP53 mutations, whereas focal expression (wild type) is suggestive of the absence of mutations in HGSOC [4, 15, 16]. LGSOCs are categorized by their low number of genetic mutations; for instance, TP53 mutations are almost never present in these tumours [3, 17].
p16 is a protein encoded by the CDKN2A tumour suppressor gene. The p16 protein performs an important role in cell cycle regulation by decelerating cell progression from G1 to S phase [18]. Approximately 60%–80% of HGSOCs show diffuse p16 staining, [16, 19, 20] for this reason p16 in association with p53, are used as IHC markers in the differential diagnosis of SOCs [4, 21].
Recently, Köbel et al. [4] proposed an association among WT1, p53 and p16 immunohistochemical expression in the differential diagnosis between LGSOC and HGSOC.
In the present study, we aimed to examine the diagnostic value of these markers, because interobserver variability occurs in clinical practice, in the distinction between LGSOC and HGSOC [4]. We were then able to verify the immunohistochemical expression of WT1, p53 and p16 in SOCs, in which the histological evaluation was clear, in a specialized gynaecological centre in Brazil. Moreover, we also determined the prognostic value of these markers.
SUBJECTS AND METHODS
Participants and tissue specimens
For this retrospective cohort study, we retrieved consecutive formalin-fixed paraffin-embedded (FFPE) tissue samples and the accompanying clinical files of 138 women who were diagnosed and treated at the Women’s Hospital of Campinas State University, Campinas, Brazil, from 1994 to 2013 and who were followed-up until 2016. The local institutional ethics committee (CEP 1086/2009) approved this study. All pathological specimens collected during primary surgery or before neoadjuvant chemotherapy were analysed by an expert gynaecological pathologist (L.A.) according to the guidelines of the World Health Organization (WHO) International Classification of Ovarian Tumours [21]. Stage was classified according to FIGO recommendations and was updated and revised during data collection [22]. Exclusion criteria were as follows: second primary cancer (2 women), no available FFPE tissue sample before chemotherapy (22 women), misdiagnosis (2 women) and missing files (6 women). FFPE tissue samples from the remaining 21 cases of LGSOC and 85 cases of HGSOC with complete data were selected. The data were obtained from each patient’s files. Women underwent chemotherapy regimens that consisted of carboplatin and either paclitaxel or cyclophosphamide according to the service protocols. For both the PFS and OS, the time was estimated in months, from the date of diagnosis to the last follow-up visit, recurrence or any cause of death [23]. The platinum response was classified as recommended by Patch et al. [24].
Tissue microarray (TMA)
Slides from the original paraffin blocks were stained with haematoxylin and eosin (H&E) and were reviewed so that representative areas of the tumour could be identified. Tissue microarray blocks (TMA, Beecher Instruments Microarray Technology, Silver Spring, CA, USA) were constructed using two samples from each case. Sections were obtained from each TMA and were placed on electrically charged slides for all IHC procedures.
Immunohistochemistry (IHC)
After initial deparaffinization, endogenous peroxidase activity was blocked with 0.3% hydrogen peroxide. The sections were then microwaved in 10 mM citrate buffer (pH 6.0) or Tris-EDTA to unmask the epitopes. The slides were incubated with the following primary antibodies according to optimized protocols: monoclonal mouse anti-human Wilms Tumor 1 (WT1) protein (clone 6F-H2; DAKO Corporation, Carpinteria, CA, 1:100), monoclonal mouse anti-human p53 protein (Clone DO-7, DAKO Corporation, Carpinteria, CA, 1:500), and monoclonal mouse anti-p16 (CINtec® histology V-Kit, clone E6H4, Roche mtm laboratories AG, Germany). The peroxidase-labelled polymer ADVANCE™ HRP Detection System (Dako) was applied for 30 minutes at room temperature. DAB chromogen substrate (3-diaminobenzidine, Sigma-Aldrich, St. Louis, MO, USA) was applied, at a proportion of 0.06 g to 100 mL of PBS, 500 μL hydrogen 3% peroxide and 1 mL dimethyl sulfoxide at 37° C for 5 minutes. The slides were subsequently washed in water, counterstained in haematoxylin, dehydrated and mounted. Tissue samples with adequate immunoreactivity were used as positive controls for each antibody. Negative controls were produced by omission of the primary antibodies.
Evaluation of the immunohistochemical reactions
A single gynaecological pathologist (L.A.) with expertise in ovarian cancer, who was blinded to the clinical and pathological data, scored the samples. Two TMA sets of each tumour component were used for each marker, i.e., each tumour area was assessed twice. The reactions were evaluated according to the percentage of positive cells. In a post hoc analysis, if scores differed in the two analyses, the stronger expression was considered.
Nuclear WT1 protein expression was analyzed in each case, and the percentages of cells with nuclear staining were estimated independently of intensity. Cases with ≥1% positive tumour nuclei were considered positive, and those with zero or less than 1% were considered negative [25]. Nuclear p53 protein expression was analysed in each case, and the percentages of cells with nuclear staining were estimated as follows: complete absence, focal nuclear staining (≥1% and <70% of tumour cells), and diffuse nuclear staining (≥70% of tumour cells) [4, 26, 27]. Cytoplasmic and nuclear p16 staining were described as follows: expression was negative when <10% of cells were stained, if no cells were stained or if cells were stained with low intensity; focal expression when between 10% and 90% of cells were stained; and diffuse when ≥ 90% of the cells were stained [4]. Cases in which > 90% of cells were stained were considered positive, and cases in which <90% of the cells were stained were considered negative (Figure 1).
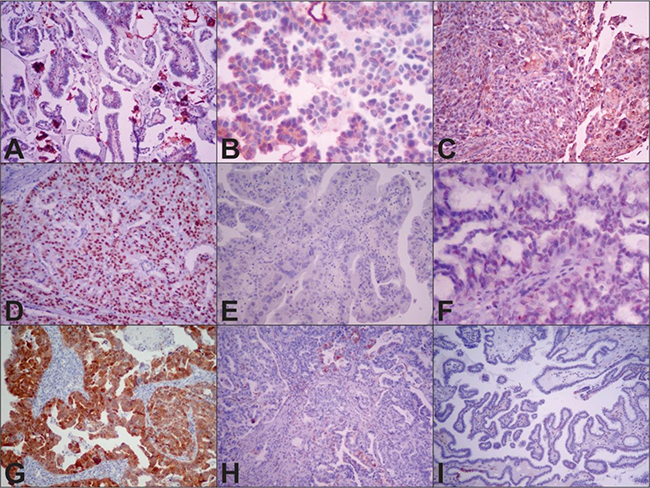
Figure 1: Representative WT1, p53 and p16 immunohistochemical expression in low- (LGSOC) and high-grade serous ovarian carcinoma (HGSOC). Notes: (A) positive expression of WT1 in LGSOC (10×); (B) negative expression of WT1 in LGSOC (40×); (C) positive expression of WT1 in HGSOC (10×); (D) diffuse nuclear expression of p53 in HGSOC (10×); (E) complete absence of p53 (null type) in HGSOC(10×); (F) focal nuclear expression of p53 (wild type) in LGSOC (40×); (G) positive nuclear and cytoplasmic expression of p16 in HGSOC (10×); (H) negative (focal expression) of p16 in HGSOC (10×); (I) negative (expression in only a few cells) of p16 in LGSOC (10×).
We also performed a combined IHC classification proposed by Köbel et al [4]., the IHC p53/p16 index. According to this classification, a low-grade pattern was defined as p53 staining in ≥1% and <70% of cells and/or the complete absence of p53 associated with p16 staining in <90% of cells. A high-grade pattern was defined as p53 staining in >70% of cells (independent of p16) or the complete absence of p53 staining associated with p16 staining in >90% cells. This approach was used to distinguish SOC on the exclusive basis of IHC, regardless of the morphological classification.
Statistical analyses
Differences between groups were analysed using the Chi-square test or Fisher’s exact test. Continuous data were analysed using the Mann-Whitney test. Weighted Kappa was calculated to evaluate the IHC p53/p16 index with the morphological classification of the tumors. Progression-free survival (PFS) was measured from the time of diagnosis until relapse, progressive disease, or last follow-up, and overall survival (OS) from the time of diagnosis until any cause of death or last follow-up. PFS and OS probabilities were estimated by the Kaplan-Meier method, and curves were compared by the log-rank test. The Cox hazards model was used to identify variables that predicted PFS and OS. Variables for which p ≤ 0.10 in the univariate Cox analysis were included in the multivariate Cox analysis. Differences were significant when p < 0.05.
RESULTS
In this study, the main clinical and pathological features of 106 cases of SOC were recorded. Briefly, the sample was composed of 85 HGSOCs (80.2%) and 21 (19.8%) LGSOCs. Women with HGSOC accounted for a significantly higher proportion of advanced stage disease (80.0% vs 42.9%, p < 0.001), presented with higher CA125 levels (median 954 U/ml vs 98 U/ml, p < 0.001), had a higher rate of post-surgery residual disease (53.0% vs 19.1%, p < 0.01) and had higher recurrence/progression rates (62.3% vs 23.8%, p = 0.001) compared with women with LGSOC. No association was observed between LGSOC and HGSOC and age, menopausal status or response to platinum-based chemotherapy (Table 1). In our study, patients with LGSOC were slightly older than their counterparts harboring HGSOG. This finding contrasts to what has been reported in the literature, which tend to concur in that HGSOC has a tendency to affect women older than those harboring LGSOC [3, 24, 28].
Table 1: Clinical features of women with low- and high-grade serous ovarian carcinomas
Clinical features |
Low-grade serous ovarian carcinoma (LGSOC) |
High-grade serous ovarian carcinoma (HGSOC) |
|
|---|---|---|---|
n (%) |
n (%) |
p value |
|
21 (19.8) |
85 (80.2) |
||
Age median (range), in years |
55 (26–78) |
59 (19–85) |
0.83 |
Menopausal status |
|||
Pre-menopausal |
6 (28.6) |
20 (23.5) |
|
Post-menopausal |
15 (71.4) |
65 (76.5) |
0.78 |
FIGO staging |
|||
I + II |
12 (57.1) |
17 (20.0) |
|
III + IV |
9 (42.9) |
68 (80.0) |
<0.001 |
CA125 median (1st; 3rd quartile) in U/ml |
98 (21; 378) |
954 (194; 2248) |
<0.001 |
Post-surgery residual disease |
|||
No |
17 (80.9) |
40 (47.0) |
|
Yes |
4 (19.1) |
45 (53.0) |
<0.01 |
Response to platinum-based chemotherapy* |
|||
Platinum-sensitive |
10 (91.0) |
41 (63.1) |
|
Platinum-refractory/resistant |
1 (9.0) |
24 (36.9) |
0.09 |
Recurrence/disease progression |
|||
No |
16 (76.2) |
32 (37.7) |
|
Yes |
5 (23.8) |
53 (62.3) |
0.001 |
FIGO: The International Federation of Gynecology and Obstetrics; LGSOC: low-grade serous ovarian carcinoma; HGSOC: high-grade ovarian serous carcinoma; *6 LGSOC patients did not undergo chemotherapy because they were stage I FIGO and 8 HGSOC patients did not undergo chemotherapy because they died; LGSOC and HGSOC women with acquired resistance were not included in this analysis; statistically significant differences are in bold, p values were calculated using the Chi square/Fisher exact test or the Mann-Whitney test.
WT1 was expressed in 71.4% of LGSOCs and in 57.1% of HGSOCs, and no significant difference was found in the expression of WT1 in these two tumour types (p = 0.32). p53 expression was diffuse in 68.2% of cases, was completely absent in 30.6% (totalling 98.8% of cases) and was focal in 1.2% of HGSOCs, compared with LGSOCs, which demonstrated diffuse expression in 9.5%, complete absence in 81.0% and focal expression in 9.5% (p < 0.0001). p16 was expressed in 58.5% of HGSOC samples compared with 9.5% of LGSOC samples (p < 0.001). Table 2 shows that the IHC p53/p16 index and the morphological classification are closely matched. It is therefore possible to infer that both classifications can subdivide two distinct SOC subtypes (p < 0.0001). Only two samples that were morphologically classified as LGSOC (9.5%) were also classified as HGSOC by the IHC p53/p16 index. On the contrary, 11.9% of HGSOCs that were classified as such on the basis of morphology, were reclassified as LGSOCs by the IHC p53/p16 index. When the IHC p53/p16 index and morphologic classification were compared, the kappa Cohen coefficient was moderate (k = 0.68). A higher expression of p16 was seen in FIGO stage III and IV disease compared with FIGO stage I and II disease, and no difference was observed in p53 and WT1 expression according to stage (data not shown).
Table 2: Comparison of tumour marker expression in low- and high-grade serous ovarian carcinomas according to morphological classification
Immunohistochemistry expression |
Low-grade serous ovarian carcinoma (LGSOC) n (%) |
High-grade serous ovarian carcinoma (HGSOC) n (%) |
1p value |
|---|---|---|---|
WT1 expression* |
|||
Negative (complete absence to <1%) |
6 (28.6) |
36 (42.9) |
|
Positive (≥1%) |
15 (71.4) |
48 (57.1) |
0.32 |
p53 expression |
|||
Focal (≥1% and <70%) |
2 (9.5) |
1 (1.2) |
|
Complete absence |
17 (81.0) |
26 (30.6) |
|
Diffuse (≥70%) |
2 (9.5) |
58 (68.2) |
<0.0001 |
p16 expression† |
|||
Negative (complete absence to < 90%) |
19 (90.5) |
34 (41.5) |
|
Positive (≥90%) |
2 (9.5) |
48 (58.5) |
<0.001 |
IHC p53/p16 index |
|||
Low-grade pattern (p53 staining in ≥1% and <70% and/or p53 complete absence + p16 <90%) |
19 (90.5) |
10 (11.9) |
2k = 0.68 |
High-grade pattern (p53 ≥70% or p53 complete absence + p16 ≥90%) |
2 (9.5) |
74 (88.1) |
p < 0001 |
LGSOC: low-grade serous ovarian carcinoma; HGSOC: high-grade ovarian serous carcinoma; *1 woman with HGSOC and †3 women with HGSOC had missing data due to exhaustion of tumour material in the paraffin blocks; statistically significant differences are in bold; 1p values were calculated using the Chi-square or Fisher exact test; 2Kappa Cohen.
For the entire cohort, the median follow-up duration was 56 months (range: 1–213 months). At 60 months of follow-up, the PFS and OS were 37.1% and 50.9%, respectively. The PFS and OS were 73.0% and 83.1%, respectively, in women with LGSOC and 29.1% and 43.8%, respectively, in women with HGSOC (data not shown).
According to the univariate analysis, advanced FIGO stage, the presence of post-surgery residual disease and high tumour grade (morphological classification) were significantly associated with worse PFS and OS. The IHC p53/p16 index was associated with worse PFS (HR = 2.19; 95% CI: 1.10–4.34) but only marginally with OS (HR = 1.99; 95% CI: 0.98–4.08) (Table 3). WT1 expression was not associated with PFS or OS. After the multivariate analysis, advanced FIGO stage and presence of post-surgery residual disease remained independent prognostic factors for PFS. Women with advanced FIGO stage (III + IV) and the presence of post-surgery residual disease had a 2.87 (95% CI: 1.15–7.18) and a 2.04 (95% CI: 1.12–3.71) greater chance, respectively, of progression compared with women with FIGO stage I + II and the absence of post-surgery residual disease. There was a trend association between FIGO staging (HR = 2.28; 95% CI: 0.96–5.39; p = 0.06) and post-surgery residual disease (HR = 1.73; 95% CI: 0.96–3.13; p = 0.06) with OS in a multivariate model. The IHC p53/p16 index was not an independent prognostic factor for either PFS or OS (Figure 2).
Table 3: Survival analysis considering key clinical and pathological features
Clinical features |
Progression-free survival |
Overall survival |
||||
|---|---|---|---|---|---|---|
Number of recurrence or disease progression/total |
HR (95% CI) |
p value |
Number of deaths/total |
HR (95% CI) |
p value |
|
FIGO staging |
||||||
FIGO I+II |
6 / 29 |
Reference |
7/29 |
Reference |
||
FIGO III+IV |
52 / 77 |
4.87 (2.08–11.38) |
<0.001 |
50/77 |
3.48 (1.57–7.71) |
0.002 |
Post-surgery residual disease |
||||||
No |
20 / 57 |
Reference |
20/57 |
Reference |
||
Yes |
38 / 49 |
3.39 (1.96–5.88) |
<0.001 |
37/49 |
2.58 (1.49–4.45) |
0.001 |
Histological grade |
||||||
Low histological grade |
5 / 21 |
Reference |
5/21 |
Reference |
||
High histological grade |
53 / 85 |
3.62 (1.44–9.09) |
0.006 |
52/85 |
2.95 (1.17–7.41) |
0.02 |
WT1 expression |
||||||
Negative (complete absence to <1%) |
24 / 42 |
Reference |
27/42 |
Reference |
||
Positive (≥1%) |
33 / 63 |
1.19 (0.70–2.01) |
0.51 |
29/63 |
1.45 (0.86–2.46) |
0.16 |
IHC p53/p16 index |
||||||
Low-grade pattern (p53 staining in ≥1% and <70% and/or p53 complete absence + p16 <90%) |
10/29 |
Reference |
9/29 |
Reference |
||
High-grade pattern (p53 ≥70% or p53 complete absence + p16 ≥90%) |
48/76 |
2.19 (1.10–4.34) |
0.02 |
47/76 |
1.99 (0.98–4.08) |
0.05 |
FIGO: The International Federation of Gynecology and Obstetrics; PFS: progression-free survival; OS: overall survival; CI: Confidence interval; HR: Hazard ratio; statistically significant differences are indicated in bold. In the multivariate analysis, FIGO staging and histological grade were significantly associated with PFS; FIGO III + IV had an HR = 2.87 (95% CI: 1.15–7.18) and presence of post-surgery residual disease had an HR = 2.04 (1.12–3.71) and were more likely to progress compared with FIGO I + II and absence of post-surgery residual disease. There was a trend association between FIGO staging (HR = 2.28; 95% CI: 0.96–5.39; p = 0.06) and post-surgery residual disease (HR = 1.73; 95% CI: 0.96–3.13; p = 0.06) with OS in a multivariate model.
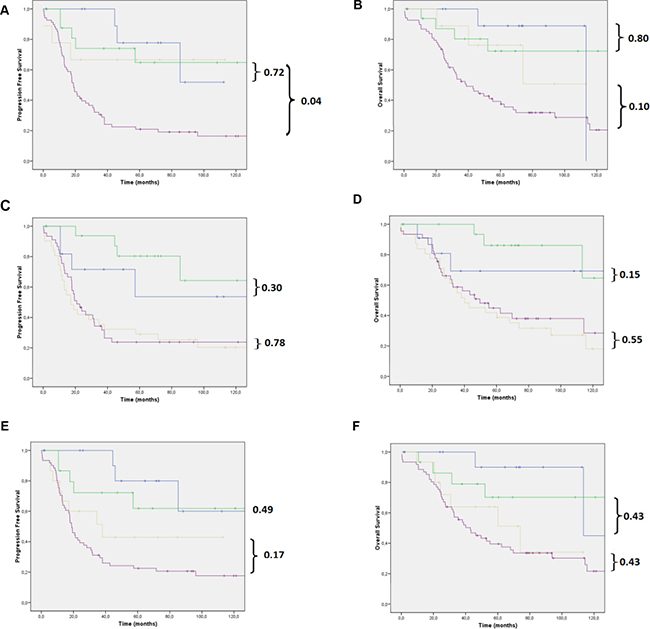
Figure 2: (A) PFS and (B) OS of women with LGSOC and HGSOC in initial and advanced disease stages based on morphological differentiation (WHO); (C) PFS and (D) OS of women with LGSOC and HGSOC in cases of negative and positive WT1 expression; (E) PFS and (F) OS of women with LGSOC and HGSOC in initial and advanced disease stages based on the immunohistochemical p53/p16 algorithm. All our analyses were performed in patients with stage I + II (blue and green lines) or in patients with stage III + IV (yellow and purple lines) disease. Note: Blue line: LGSOC stage I + II; green line: HGSOC stage I + II; yellow line: LGSOC stage III + IV; purple line: HGSOC stage III + IV.
DISCUSSION
In women with clinically advanced ovarian carcinoma, the current treatment consists of surgical cytoreduction combined with adjuvant or neoadjuvant paclitaxel and carboplatin chemotherapy [29]. Optimal cytoreduction surgery, that is, absence of macroscopic residual disease, is the most important prognostic factor related to survival when associated with platinum-based chemotherapy [30, 31].
The two types of SOC harbour different molecular abnormalities and have different clinical courses [3]. These data from the literature were confirmed in our study. Women with HGSOC represented a worse prognosis, and higher CA125 levels compared with women with LGSOC.
We aimed to analyse the expression of WT1, p53 and p16 in LGSOC and HGSOC by IHC and to compare this expression with the pathological/clinical features of the tumours and disease outcomes. We observed that the IHC p53/p16 index has a good association with the histopathological morphological classification. In the univariate analysis, the IHC p53/p16 index was associated only with PFS. After the multivariate analysis, FIGO stage remained the only independent prognostic factor for survival.
In the female genital tract, WT1 expression is usually used to distinguish SOCs from other ovarian tumour types. In a recent review, Köbel et al. [4] affirm that WT1 expression suggests SOC, considering that approximately 10% of HGSOCs can be negative. In our study, approximately 60% of all SOCs expressed WT1 according to the same method described above [4]. In the current study, WT1 expression was lower than what has been reported in most papers in the recent literature, which might be explained by the irregular staining of tissue for WT1, additionally, the TMAs used may not contain the most immunoreactivity areas of the tumours [9, 32, 33]. TMA analysis pose a few challenges in terms of choosing tumor areas representative of the most significant biological processes taking place during tumor formation and progression. To ensure good hot spot selection, having an experienced pathologist in mandatory. Fortunately, we have a team of seasoned pathologists, who took part in several studies using TMA and developed a vast expertise in selecting tumor areas for TMA assembly. These issues are now dealt with in the discussion. We cannot ascribe the unexpected findings pertaining to WT1 expression to a faulty TMA hotspot selection bias.
In our study, p53 expression was diffuse in 68.2% and was completely absent (null type) in 30.6% of women with HGSOCs (totalling 98.8% of cases). Our results are similar to those of a previous study, which considered p53 expression by IHC (TP53 mutations are present in nearly 100% of HGSOCs) [3, 26, 34]. p16-positive IHC expression (i.e., ≥90% expression) was observed in 58.5% of women with HGSOC, which is consistent with what has been reported in the literature [4, 21].
Recently, Köbel et al. [4] concluded that their IHC p53/p16 index matched the standard pathological categorization of SOC and was reproducible. The IHC p53/p16 index aims to differentiate between LGSOC and HGSOC using p53 and p16 IHC in WT1-positive samples. LGSOCs are characterized by the focal expression of both p53 and p16, whereas HGSOCs are defined as tumours with diffuse p53 expression or complete absence of p53 expression (null type) associated with diffuse p16 expression. In our study, only 1 case presented focal expression of both markers. This prompted us to also consider samples with focal and/or complete absence of p53 staining associated with negative p16 expression as LGSOC [4]. In our study, we observed a close match between the morphological classification recommended by the WHO and the IHC p53/p16 index, principally in women with HGSOC.
TP53 alterations are associated with high rates of tumour cell proliferation, but the association between p53 expression and patient prognosis remains controversial [35]. In malignant tumours, p16 overexpression appears to be a mechanism by which the uncontrolled proliferation caused by failure of the Rb pathway can be arrested [36]. In our study, the IHC p53/p16 index was not significantly associated with survival.
Some important limitations of our research should be highlighted. First, our IHC evaluation was performed in TMA samples, and it is known that large ovarian cancers can show regional variability in the expression of protein markers. Indeed, IHC analyses were performed after a long period of time which means that the quality of the paraffin-embedded tissue might have been compromised. Second, the same cases that were included in our study were diagnosed almost 20 years ago. Herein, we divided our casuistry based on the diagnostic data: 1994 to 2003 (n = 61) and 2004 to 2013 (n = 45). No difference was observed in terms of the clinical features or survival (data not shown). Finally, our ratio of LGSOC to HGSOC is higher than that reported in the literature. This might be expected to occur once the majority of HGSOC cases present with advanced FIGO stages and are treated with neoadjuvant chemotherapy; these cases would thus be excluded from the study sample.
CONCLUSIONS
The IHC p53/p16 index and the morphological classification are closely matched, and the IHC p53/p16 index seems to be a good marker for the differentiation of LGSOC and HGSOC. However, the WHO morphologic classification showed a better association with survival. FIGO stage and post-surgery residual disease remained an independent prognostic factors for PFS but only a trend association with OS. However, the IHC p53/p16 index was not an independent prognostic factor for either PFS or OS.
In the evaluation of a new case of SOC, the initial assessment should be performed according to WHO morphologic criteria. In doubtful cases, IHC should be performed to determine the IHC p53/p16 index. Thus, p53 and p16 expression have an important role in the routine differential diagnosis of ovarian carcinoma.
CONFLICTS OF INTEREST
The authors declare that they have no conflicts of interest.
FUNDING
National Council for Scientific and Technological Development (CNPq) number 306583/2014-3 and the São Paulo Research Foundation (FAPESP) number 2012/15059-8 funded this study.
REFERENCES
1. Bodurka DC, Deavers MT, Tian C, Sun CC, Malpica A, Coleman RL, Lu KH, Sood AK, Birrer MJ, Ozols R, Baergen R, Emerson RE, Steinhoff M, et al. Reclassification of serous ovarian carcinoma by a 2-tier system: A Gynecologic Oncology Group Study. Cancer. 2012; 118:3087–94.
2. Nik NN, Vang R, Shih IM, Kurman RJ. Origin and pathogenesis of pelvic (ovarian, tubal, and primary peritoneal) serous carcinoma. Annu Rev Pathol. 2014; 9:27–45.
3. Kurman RJ, Shih IM. The Dualistic Model of Ovarian Carcinogenesis. Revisit, Revised, and Expanded. Am J Pathol. 2016; 186:733–47.
4. Köbel M, Bak J, Bertelsen BI, Carpen O, Grove A, Hansen ES, Levin Jakobsen AM, Lidang M, Måsbäck A, Tolf A, Gilks CB, Carlson JW. Ovarian carcinoma histotype determination is highly reproducible, and is improved through the use of immunohistochemistry. Histopathology. 2014; 64:1004–13.
5. Pritchard-Jones K, Fleming S, Davidson D, Bickmore W, Porteous D, Gosden C, Bard J, Buckler A, Pelletier J, Housman D, van Heyningen V, Hastie N. The candidate Wilms’ tumour gene is involved in genitourinary development. Nature. 1990; 346:194–97.
6. Koesters R, Linnebacher M, Coy JF, Germann A, Schwitalle Y, Findeisen P, von Knebel Doeberitz M. WT1 is a tumor-associated antigen in colon cancer that can be recognized by in vitro stimulatedcytotoxic T cells. Int J Cancer. 2004; 109:385–92.
7. Silberstein GB, Van Horn K, Strickland P, Roberts CT Jr, Daniel CW. Altered expression of the WT1 wilms tumor suppressor gene in human breast cancer. Proc Natl Acad Sci USA. 1997; 94:8132–37.
8. Amini Nik S, Hohenstein P, Jadidizadeh A, Van Dam K, Bastidas A, Berry RL, Patek CE, Van der Schueren B, Cassiman JJ, Tejpar S. Upregulation of Wilms’ tumor gene 1 (WT1) in desmoid tumors. Int J Cancer. 2005; 114:202–8.
9. Netinatsunthorn W, Hanprasertpong J, Dechsukhum C, Leetanaporn R, Geater A. WT1 gene expression as a prognostic marker in advanced serous epithelial ovarian carcinoma: an immunohistochemical study. BMC Cancer. 2006; 6:90.
10. Høgdall EV, Christensen L, Kjaer SK, Blaakaer J, Christensen IJ, Gayther S, Jacobs IJ, Høgdall CK. Expression level of Wilms tumor 1 (WT1) protein has limited prognostic value in epithelial ovarian cancer: from the Danish “MALOVA” ovarian cancer study. Gynecol Oncol. 2007; 106:318–24.
11. Köbel M, Kalloger SE, Boyd N, McKinney S, Mehl E, Palmer C, Leung S, Bowen NJ, Ionescu DN, Rajput A, Prentice LM, Miller D, Santos J, et al. Ovarian carcinoma subtypes are different diseases: implications for biomarker studies. PLoS Med. 2008; 5:232.
12. Liu Z, Yamanouchi K, Ohtao T, Matsumura S, Seino M, Shridhar V, Takahashi T, Takahashi K, Kurachi H. High levels of Wilms’ tumor 1 (WT1) expression were associated with aggressive clinical features in ovarian cancer. Anticancer Res. 2014; 34:2331–40.
13. Taube ET, Denkert C, Sehouli J, Kunze CA, Dietel M, Braicu I, Letsch A, Darb-Esfahani S. Wilms tumor protein 1 (WT1) –not only a diagnostic but also a prognostic marker in high-grade serous ovarian carcinoma. Gynecol Oncol. 2016; 140:494–502.
14. Lee SH, Kim H, Kim WY, Han HS, Lim SD, Kim WS, Hwang TS. Genetic alteration and immunohistochemical staining patterns of ovarian high-grade serous adenocarcinoma with special emphasis on p53 immnnostaining pattern. Pathol Int. 2013; 63:252–9.
15. Canevari S, Gariboldi M, Reid JF, Bongarzone I, Pierotti MA. Molecular predictors of response and outcome in ovarian cancer. Crit Rev Oncol Hematol. 2006; 60:19–37.
16. O’Neill CJ, McBride HA, Connolly LE, Deavers MT, Malpica A, McCluggage WG. High-grade ovarian serous carcinoma exhibits significantly higher p16 expression than low-grade serous carcinoma and serous borderline tumour. Histopathology. 2007; 50:773–9.
17. Singer G, Stöhr R, Cope L, Dehari R, Hartmann A, Cao DF, Wang TL, Kurman RJ, Shih IM. Patterns of p53 mutations separate ovarian serous borderline tumors and low- and high-grade carcinomas and provide support for a new model of ovarian carcinogenesis: a mutational analysis with immunohistochemical correlation. Am J Surg Pathol. 2005; 29:218–24.
18. Beirne JP, McArt DG, James JA, Salto-Tellez M, Maxwell P, McCluggage WG. p16 as a prognostic indicator in ovarian/tubal high-grade serous carcinoma. Histopathology. 2016; 68:615–8.
19. Phillips V, Kelly P, McCluggage WG. Increased p16 expression in high-grade serous and undifferentiated carcinoma compared with other morphologic types of ovarian carcinoma. Int J Gynecol Pathol. 2009; 28:179–86.
20. Yoon N, Yoon G, Park CK, Kim HS. Stromal p16 expression is significantly increased in malignant ovarian neoplasms. Oncotarget. 2016; 7:64665–73. https://doi.org/10.18632/oncotarget.11660.
21. Kurman RJ, Carcangiu ML, Herrington S, Young RH. WHO classification of tumours of female reproductive organs. 4th ed. Lyon, France: IARC. 2014.
22. Mutch DG, Prat J. 2014 FIGO staging for ovarian, fallopian tube and peritoneal cancer. Gynecol Oncol. 2014; 133:401–14.
23. Rustin GJ, Vergote I, Eisenhauer E, Pujade-Lauraine E, Quinn M, Thigpen T, du Bois A, Kris tensen G, Jakobsen A, Sagae S, Greven K, Parmar M, Friedlander M, et al, and Gynecological Cancer Intergroup. Definitions for response and progression in ovarian cancer clinical trials incorporating RECIST 1.1 and CA 125 agreed by the Gynecological Cancer Intergroup (GCIG). Int J Gynecol Cancer. 2011; 21:419–23.
24. Patch AM, Christie EL, Etemadmoghadam D, Garsed DW, George J, Fereday S, Nones K, Cowin P, Alsop K, Bailey PJ, Kassahn KS, Newell F, Quinn MC, et al, and Australian Ovarian Cancer Study Group. Whole-genome characterization of chemoresistant ovarian cancer. Nature. 2015; 521:489–94.
25. Lee S, Piskorz AM, Le Page C, Mes Masson AM, Provencher D, Huntsman D, Chen W, Swanson PE, Gilks CB, Köbel M. Calibration and Optimization of p53, WT1, and Napsin an Immunohistochemistry Ancillary Tests for Histotyping of Ovarian Carcinoma: Canadian Immunohistochemistry Quality Control (CIQC) Experience. Int J Gynecol Pathol. 2016; 35:209–221.
26. Köbel M, Reuss A, du Bois A, Kommoss S, Kommoss F, Gao D, Kalloger SE, Huntsman DG, Gilks CB. The biological and clinical value of p53 expression in pelvic high-grade serous carcinomas. J Pathol. 2010; 222:191–98.
27. Kalloger SE, Köbel M, Leung S, Mehl E, Gao D, Marcon KM, Chow C, Clarke BA, Huntsman DG, Gilks CB. Calculator for ovarian carcinoma subtype prediction. Mod Pathol. 2011; 24:512–21.
28. Vang R, Shih IM, Kurman RJ. Ovarian low-grade and high-grade serous carcinoma: Pathogenesis, Clinicopathologic and Molecular Biologic Features, and Diagnostic Problems. Adv Anat Pathol. 2009; 16:267–82.
29. Alkema NG, Wisman GB, van der Zee AG, van Vugt MA, de Jong S. Studying platinum sensitivity and resistance in high-grade serous ovarian cancer: Different models for different questions. Drug Resist Updat. 2016; 24:55–69.
30. Chang SJ, Bristow RE, Ryu HS. Impact of complete cytoreduction leaving no gross residual disease associated with radical cytoreductive surgical procedures on survival in advanced ovarian cancer. Ann Surg Oncol. 2012; 19: 4059–67.
31. Chi DS, Musa F, Dao F, Zivanovic O, Sonoda Y, Leitao MM, Levine DA, Gardner GJ, Abu-Rustum NR, Barakat RR. An analysis of patients with bulky advanced stage ovarian, tubal, and peritoneal carcinoma treated with primary debulking surgery (PDS) during an identical time period as the randomized EORTC-NCIC trial of PDS vs neoadjuvant chemotherapy (NACT). Gynecol Oncol. 2012; 124:10–4.
32. Schorge JO, Miller YB, Qi LJ, Muto MG, Welch WR, Berkowitz RS, Mok SC. Genetic alterations of the WT1 gene in papillary serous carcinoma of the peritoneum. Gynecol Oncol. 2000; 76:369–72.
33. Goldstein NS, Bassi D, Uzieblo A. WT1 is an integral component of an antibody panel to distinguish pancreaticobiliary and some ovarian epithelial neoplasms. Am J Clin Pathol. 2001; 116:246–52.
34. Chen S, Cavazza E, Barlier C, Salleron J, Filhine-Tresarrieu P, Gavoilles C, Merlin JL, Harlé A. Beside P53 and PTEN: Identification of molecular alterations of the RAS/MAPK and PI3K/AKT signaling pathways in high-grade serous ovarian carcinomas to determine potential novel therapeutic targets. Oncol Lett. 2016; 12:3264–72.
35. Kmet LM, Cook LS, Magliocco AM. A review of p53 expression and mutation in human benign, low malignant potential, and invasive epithelial ovarian tumors. Cancer. 2003; 97:389–404.
36. Liew PL, Hsu CS, Liu WM, Lee YC, Lee YC, Chen CL. Prognostic and predictive values of Nrf2, Keap1, p16 and E-cadherin expression in ovarian epithelial carcinoma. Int J Clin Exp Pathol. 2015; 8:5642–9.