
INTRODUCTION
Pilocytic astrocytoma (PA) is a pediatric low-grade glioma (pLGG) and the most common pediatric brain tumor, accounting about for 18% of all pediatric brain tumors and mostly affecting children between 5–15 years of age. It can arise anywhere in the CNS, but is most commonly localized in the cerebellum followed by the optic pathway/hypothalamic region [1]. It is classified as grade I by the World Health Organization (WHO), reflecting their slow growth and typically non-invasive behavior.
Pilocytic astrocytomas typically contain a BRAF fusion but occasionally a BRAF V600E mutation, RAF1 fusion, intragenic duplication of FGFR1, or other rarer alterations are present [2, 3].
Childhood pilocytic astrocytomas (PA) are low grade tumours with an excellent prognosis. However, PA can cause extensive morbidity due to local tumor expansion or therapy-related side effects and recurrence or progressive disease (PD), which occurs in up to 80% of patients, depending on location and extent of initial resection [4]. Therefore, new therapies are needed in order to specifically target the disease and improve the clinical course of these patients.
Epigenetic biomarkers represent a promising area of research, with DNA methylation having the potential to provide information regarding physiological and pathological status. Methylation signatures can be useful as specific and accurate biomarkers to assist with prognosis. The aims of the present work were to define biologically distinct groups of PA and possible relevant biomarkers through a global DNA methylation analysis over 27K CpG loci, and to asses the impact of methylation alterations on gene expression by qRT-PCR. We identified distinct methylation profiles characterizing PAs from different locations (infratentorial vs supratentorial) and tumors with onset before (≤ 3 yrs) and after (> 3 yrs) 3 years of age. Our study also identified IRX2 as possible topographical biomarker and TOX2 as tumoral biomarker.
RESULTS
Differential methylation analysis
We performed a global DNA methylation profiling using Illumina Infinium HumanMethylation27 BeadChips on 20 PAs and 4 normal brain samples from healthy individuals. We carried out a differential methylation analysis between tumoral and non-tumoral samples, by comparing the average beta signal obtained for each locus in the two subgroups. We found 919 CpG loci resulting hypermethylated in tumoral tissues at the nominal p-value threshold 5.0E-02 (differential score above 13). 640 of them were also significant with p-value below 1.0E-02, and 449 below 1.0E-03. On the other side, 1544 loci were significantly hypomethylated in cancer samples (p-value < 5.0E-02), of which 933 under 1.0E-02 and 609 under 1.0E-03.
Although the number of samples analyzed was quite small, we divided PA patients into two subgroups according to two selection criteria: topographic criterion and age of onset criterion in order to test whether these parameters may correlate with different methylation patterns. According to the topographic criterion, 50% of PAs (10/20) had a supratentorial localization and the other half of tumors (10/20) were located in the infratentorial region. The differential methylation analysis between the two clusters revealed 1931 CpG loci resulting hypermethylated in the supratentorial PAs at the nominal p-value threshold 5.0E-02. 1276 of them were also significant with p-values below 1.0E-02, and 859 below 1.0E-03. On the other side, 1381 loci were significantly hypomethylated in the supratentorial PAs (p-value < 5.0E-02), of which 843 under 1.0E-02 and 519 under 1.0E-03.
Next, we tested the hypothesis whether the age of onset correlated with the DNA methylation pattern. Since brain tumors in children under 3 years of age differ in clinical presentation and biological behavior from those in older patients, cases were grouped as follows: 45% of tumors (9/20) with onset before 3 years of age (≤3 yrs) and 55% of PAs (11/20) developed after 3 years of age (>3 yrs). The differential methylation analysis revealed 2645 CpG loci resulting hypermethylated in the >3 yrs subgroup, at the nominal p-value threshold 5.0E-02. 1506 of them were also significant with p-values below 1.0E-02, and 899 below 0.001. On the other side, 2312 loci were significantly hypomethylated in the >3 yrs subgroup (p-value < 5.0E-02), of which 1403 under 1.0E-02 and 828 under 1.0E-03.
The Unsupervised Hierarchical Clustering (UHC), performed by comparing the methylation value of each sample for each locus, demonstrates that the relevant methylated loci (p-value < 0.01) allow to distinguish two major clusters for each category, infratentorial vs supratentorial (Figure 1A) and age ≤ 3 vs age > 3 (Figure 1B) mostly reflecting the subgroups established a priori. In particular, PAs segregated clearer based on tumor location than age groups; in fact, only two supratentorial tumors clustered with the infratentorial PAs.
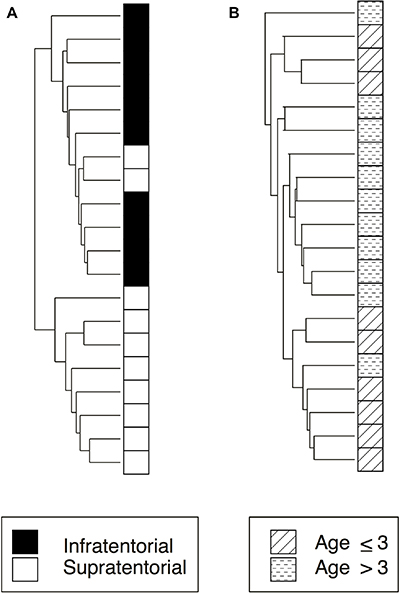
Figure 1: Unsupervised hierarchical clustering analysis of significantly differently methylated CpG Islands related to the two subgroups considered in the study: tumor location and age at onset. (A) infratentorial and supratentorial samples (248 CpG Islands); (B) age at onset ≤ 3 or > 3 (360 CpG Islands).
We conducted Ingenuity Pathway Analysis in order to classify genes associated with differentially methylated loci thus identifying pathways potentially involved in gliomas oncogenesis.
IPA revealed that genes associated to significantly differently methylated CpG loci in the case-control study (p-value < 1.0E-03) belong to the following networks: Gαi Signaling; RhoGDI Signaling; CMP-N-acetylneuraminate Biosynthesis I (Eukaryotes); cAMP-mediated signaling; Synaptic Long Term Depression. The analysis also suggested which cellular and molecular circuits were mainly affected, including: cancer mechanisms, neurological diseases, molecular transport, cellular growth and proliferation, cell cycle, DNA replication, recombination and repair, tissue development, cell to cell signaling and interaction, etc. As expected, the highest number of genes with altered methylation belongs to pathways involved in the development, growth and proliferation of cells and tissues, including the mechanisms of cell death, survival, and cancer. The involvement of these networks is supported by quite strong statistical evaluation (p-value < 2.0E-04).
Then, analyzing by IPA, the list of genes whose CpG loci are differentially methylated between supratentorial vs infratentorial tumors, we identified these pathways: cAMP-mediated signaling; G-Protein Coupled Receptor Signaling; LXR/RXR Activation; Maturity Onset Diabetes of Young (MODY) Signaling; FXR/RXR Activation.
Finally, by entering into IPA, the list of CpG loci differently methylated between ≤3 yrs and >3 yrs subgroups, the molecular pathways that appear to be most affected are: p53 Signaling; Intrinsic Prothrombin Activation Pathway; Sphingosine-1-phosphate Signaling; α-tocopherol Degradation; Role of IL-17A in Psoriasis.
Calibration of an integrated DNA methylation analysis approach: the EN2 case
To validate and increase the robustness of HumanMethylation 27 data taking advantage of the wider epigenome coverage provided by the 450K array, we performed a probe enrichment (see methods and Figure 2) of our data using the 450K data obtained by Lambert et al. analyzing 62 PA samples (GEO repository of NCBI [GSE44684]) [5].
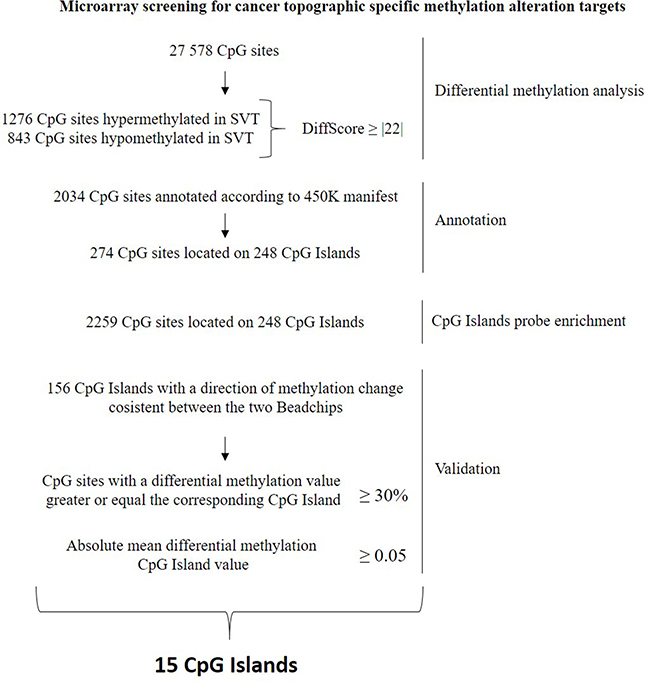
Figure 2: Flowchart describing the selection, annotation, probe enrichment and validation of the methylation alterations relative to the Supratentorial/Infratentorial differential methylation comparison.
First of all, we were able to validate the hypermethylation of EN2, key result in Lambert et al. [5]. In particular, as reported by Lambert et al. [5], this gene shows an extensive gene body hypermethylation, including the regions upstream and downstream the gene, except the region around the transcription start site (TSS) (Figure 3).
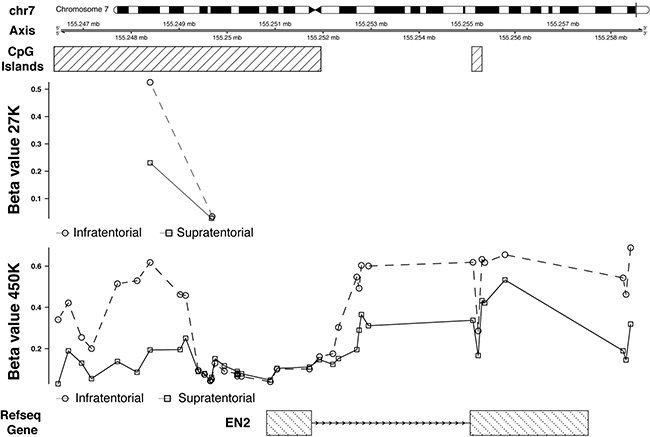
Figure 3: 27K/450K enrichment and comparison. CpG Islands found significantly altered in PAs analyzed in the present study (using the HumanMethylation27 beadchip), were compared and enriched in silico with PA data analyzed by Lambert and colleagues (HumanMethylation450K beadchip). Here is the example of the EN2 gene.
To examine the influence of DNA methylation on gene expression, EN2 expression analysis was assessed by qRT-PCR, revealing that its expression was higher in infratentorial than in supratentorial PAs by almost 6-fold (Figure 4A).
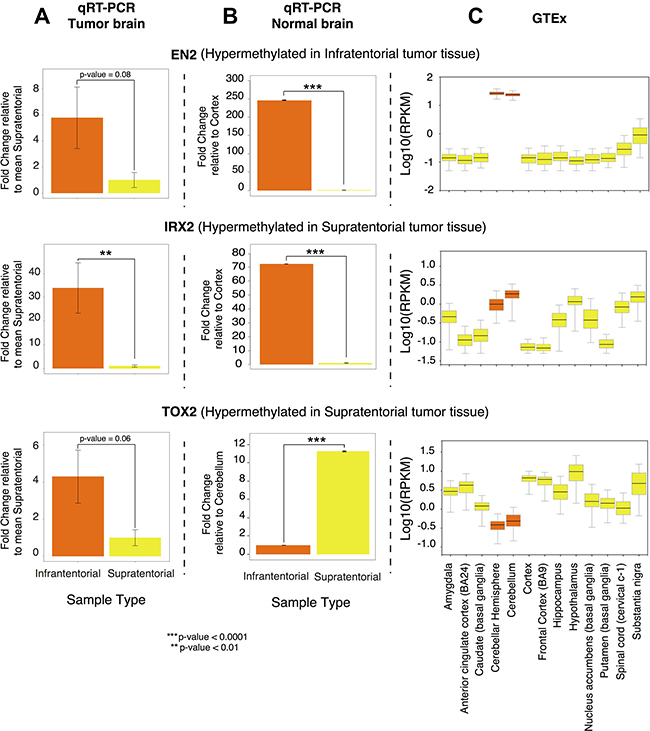
Figure 4: EN2, IRX2, TOX2 gene expression profile. (A) Differential expression obtained by qRT-PCR on the PA samples collected in the present study, calculated using the ΔΔCT method and expressed as fold change relative to the supratentorial mean expression value; (B) Differential expression obtained by qRT-PCR on commercially available normal brain RNA, calculated using the ΔΔCT method and expressed as fold change relative to the lowest expression value; (C) Gene expression in normal brain tissue, according to GTEx portal (Genotype-Tissue Expression portal). Expression value are shown in log10(RPKM) (Reads Per Kilobase of transcript per Million mapped reads), calculated from a gene model with isoforms collapsed to a single gene. In orange: supratentorial localization and related brain regions; in yellow: infratentorial localization and related brain regions.
We compared the expression levels of EN2 observed in our tumor samples with patterns of expression in commercially available human normal brain samples (Figure 4B) and in different normal brain sites using gene expression data retrieved from the GTExPortal, showing that its expression level in the tumoral samples is in line with that observed in the normal tissues (Figure 4C).
Identification of novel biomarkers
Since our prominent results emerged from the differential methylation analysis between the two PA localizations, we focused our validation process only on these results.
The list of genes validated is reported in Supplementary Tables 1 and 2.
We focused on the genes IRX2 and TOX2 to verify whether a differential DNA methylation may correlate with different gene expression profiles between the two tumoral localizations. Due to the limited amount of RNA available from our samples, six genes were selected based on 27K absolute mean differential methylation value greater or equal to the 10%. The feasibility of the assay design, that guaranteed reproducibility and reliability of the gene expression data, led to the selection of IRX2 and TOX2 for subsequent qRT-PCR analysis.
The IRX2 and TOX2 hypermethylation in the supratentorial PAs was validated (Figures 5, 6). In particular IRX2 showed a hypermethylation, apart from the region around the TSS, of a CpG island that spans the promoter region and the gene body (Figure 5); while TOX2 showed a promoter CpG island hypermethylation, except for the region around the TSS (Figure 6).
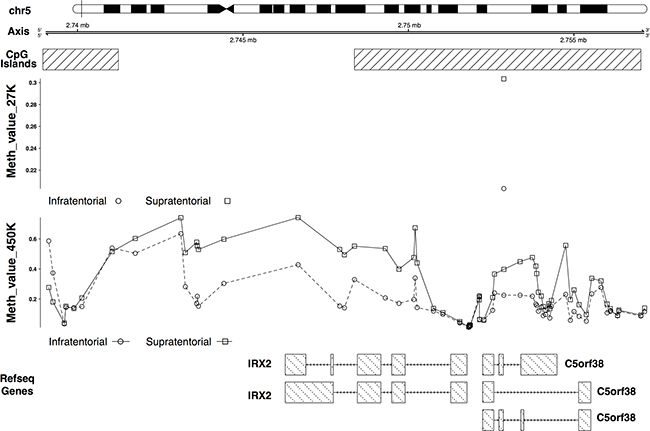
Figure 5: 27K/450K enrichment and comparison. CpG Islands found significantly altered in PAs analyzed in the present study (using the HumanMethylation27 beadchip), were compared and enriched in silico with PA data analyzed by Lambert and colleagues (HumanMethylation450K beadchip). Here is the example of the IRX2 gene.
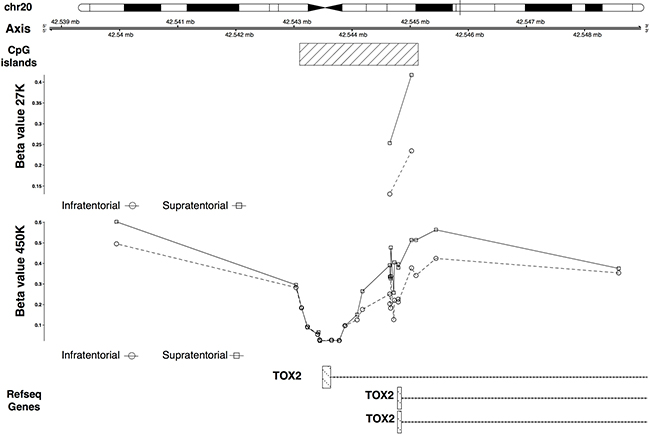
Figure 6: 27K/450K enrichment and comparison. CpG Islands found significantly altered in PAs analyzed in the present study (using the HumanMethylation27 beadchip), were compared and enriched in silico with PA data analyzed by Lambert and colleagues (HumanMethylation450K beadchip). Here is the example of the TOX2 gene.
qRT-PCR revealed a significantly decreased expression of IRX2 (Figure 4A) and almost significant of TOX2 (Figure 4A) (by nearly 35 fold and by about 4 fold respectively) in supratentorial compared to infratentorial PAs.
IRX2 and TOX2 gene expression levels in tumor samples (Figure 4A) were compared to commercially available human normal brain samples (Figure 4B) and to GTEx expression data observed in different normal brain sites (Figure 4C). The expression level of IRX2 in the tumor samples resulted in line with that observed in the normal brain sites. On the other hand, TOX2 expression level in the PA samples is in contrast to the gene expression level observed in the normal brain sites.
Prognostic value of the identified biomarkers
Since the results obtained showed a differential methylation and expression of TOX2 and IRX2 between supratentorial and infratentorial PAs, we decided to evaluate the putative prognostic implications of TOX2 and IRX2 expression using a web-tool called PROGgeneV2 [6] on in silico data. Patients were classified as high-expression or low-expression groups to generate Kaplan-Meier plots (Figure 7A, 7B) using gene expression data of adult LGG from TCGA [TCGA-LGG]. The results showed very significant differences in the survival rate between patients with different expression of TOX2 (Figure 7A) and IRX2 (Figure 7B).
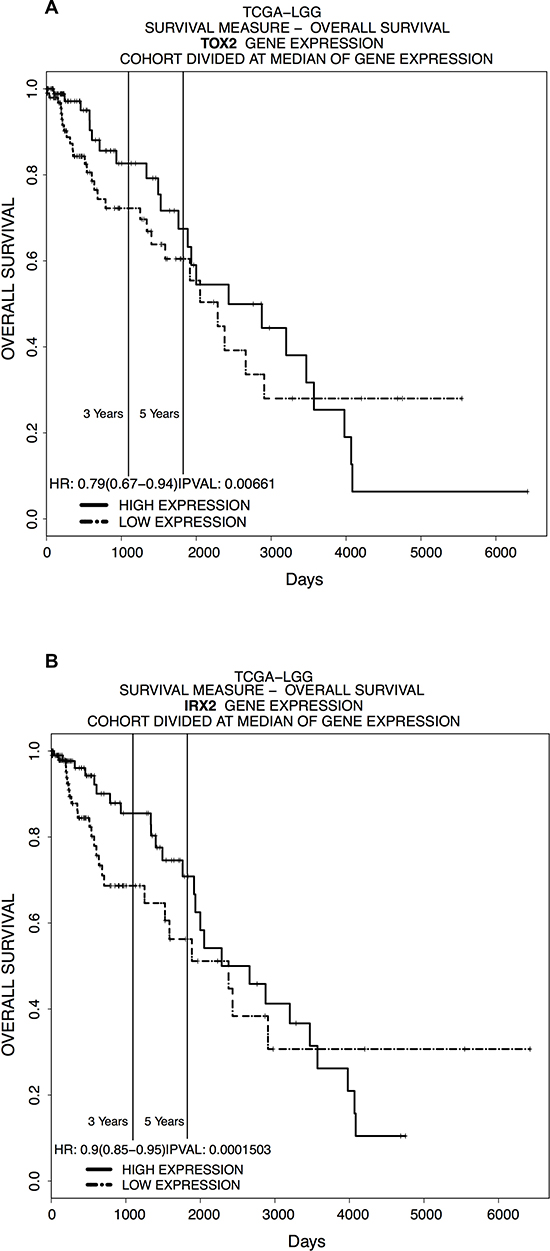
Figure 7: In silico LGG survival curves of patients classified by. (A) TOX2 and (B) IRX2 expression in the indicated dataset [TCGA-LGG] (x-axis: survival time in days; y-axis: overall survival). Samples were divided into high and low expression groups bifurcating at median expression value for mRNA expression.
DISCUSSION
DNA methylation plays a key role during embryogenesis and differentiation. Alterations in DNA methylation have been linked to several human diseases including gliomas.
In this study we performed the following differential methylation analyses in PAs: 1) tumors vs normal brain, 2) ≤3yrs vs >3yrs subgroups and 3) infratentorial vs supratentorial. In addition, we performed in silico functional and interaction analyses of differently methylated loci using IPA software. The results obtained suggest an involvement of different pathways depending on the specific analysis. As expected, by comparing the methylation pattern of tumor DNA vs non-neoplastic brain cells, the cellular and molecular circuits mainly represented included mechanisms of cell death, survival, and tumorigenesis.
On the other hand, IPA identified inflammatory response mechanisms and immune cell trafficking as the top cellular and molecular networks related to PA topography i.e. infratentorial vs supratentorial.
It is noteworthy that p53 signaling results to be involved at a very significant level (p-value = 4.35E-06), with 21 altered genes on 95, in the age groups comparison. Although previous studies have reported a lower TP53 mutations frequency in high grade glioma patients under the age of 3 years than older children, suggesting that there may be two distinct pathways involved in the tumorigenesis [7, 8], TP53 mutations have been rarely reported in PA [9]. Similarly, in our study, none of the tumor samples showed immunohistochemical expression of p53, which when mutated, accumulates in the nucleus due to prolonged half-life.
Among the genes differentially methylated between PA patients younger and older than 3 years, KL gene resulted hypermethylated in the >3yo subgroup. Interestingly, the promoter of this gene has been found to be methylated and consequently downregulated in other tumors [10–14].
These results highlighted specific brain-region and age-related methylation patterns, suggesting that different molecular pathways may be involved in the pathogenesis of PA.
This finding was supported by the identification of distinct gene expression [5, 15–20] and methylation profiles [5, 20, 21] between tumors having different localizations. Sharma et al. [16] described a specific gene expression pattern discriminating infratentorial and supratentorial PAs. They also observed that these signatures are specific of tumoral and normal astrocytes or neuronal stem cells from the same brain region, suggesting that these molecular patterns may be connected to the specific brain site where the tumor arises. The differentially expressed genes identified by Sharma and colleagues [16] are implicated in the development of the forebrain and the hindbrain. One of these genes, IRX2, was found differentially expressed [16, 18, 20] and differentially methylated between infratentorial and supratentorial PAs in our and other studies [5, 20]. In particular, Jeyapalan et al. [20] identified an intergenic CpG site associated to IRX2 that resulted to be differentially methylated between the two tumor groups; whereas we detected a differential methylation of a CpG island that spans the promoter region and part of the gene body of IRX2. In our sample set, IRX2 gene showed a hypermethylation and an expected downregulation in supratentorial PAs compared to the infratentorial PAs (Figure 4A), confirming the gene expression profile observed by the other studies [16, 18, 20]. The expression level of this gene was in line with that observed in the normal tissues (Figure 4B and Figure 4C), suggesting that its downregulation is probably more of a reflection of where the tumor develops rather than the onset of PA per se. In fact, IRX2 is implied in vertebrate embryos development and is expressed in the developing hindbrain. During normal development DNA methylation targets genes that are already repressed in order to facilitate gene repression instead of directly cause gene silencing [22]. Our results support the evidence that DNA methylation in cancer occurs in normally downregulated genes [23–26]. Hence, the expression of some genes seemed to be finely regulated by DNA methylation and, in agreement to the model proposed by Timp et al., these epigenetic alterations may disrupt the functions of genes that regulate the epigenome itself [27].
The possible involvement of IRX2 in cancer development is also supported by the fact that IRX2 may act as a metastasis suppressing protein since its low expression has been found to be correlated with less differentiated and more aggressive breast cancer tumors. Furthermore, it has been revealed that it may be a repressor of chemokines expression, thus its low expression levels may lead to a sustained chemokines expression and a consequent mobilization of tumoral cells [28].
Other members of the Iroquois (IRO/IRX) family, IRX1, IRX3 and IRX5 have been found differentially methylated [5, 20] and/or expressed [5, 16, 18, 20] between supratentorial and infratentorial PAs, suggesting that these genes may have an important role in specific location cancer development.
Another developmental gene, EN2, showed a differential methylation and expression between supratentorial and infratentorial PAs.
EN2 resulted to be hypermethylated and upregulated in the infratentorial PAs (Figure 4A). This result is in line with an unusual positive correlation, evidenced by Lambert et al., [5] between non-TSS based hypermethylation and gene expression (i.e: high methylation values- upregulation; low methylation values–downregulation), of genes showing a differential methylation within the gene body and/or in regions upstream/downstream (within 10 kb) of the genes.
Interestingly, the expression levels of EN2 in the normal cerebellar hemisphere is the highest among all brain sites according to commercially available RNA from human normal brain samples (Figure 4B) and to GTEx gene expression annotations (Figure 4C). EN2 is involved in the control of pattern formation during development of the central nervous system.
An interesting result of our study regards TOX2 gene that showed a differential methylation between supratentorial and infratentorial tumors with the exception of the region around the TSS of the longest isoform showing no significant difference between the two localizations. TOX2 was hypermethylated in supratentorial PAs and qRT-PCR revealed that it was also downregulated in this subgroup than infratentorial PAs (Figure 4A). This condition is in contrast to the gene expression level observed in the normal tissue according to commercially available RNA from human normal brain samples (Figure 4B) and to GTEx expression annotations (Figure 4C), suggesting its potential role as a tumoral biomarker.
This gene was found to be frequently hypermethylated in the 5′-end in a series of astrocytomas of different grades, including PA (grade I) [29]. Furthermore, by analyzing in silico methylation data from glioblastomas (GSE19391), we have been able to confirm that the methylation alteration near TOX2 gene is also present in high grade gliomas [29]. The methylation difference between glioblastomas and non-tumor tissues is about 40%, so even higher than that observed in PAs, both by our group and by Lambert et al. [5]. The in silico analysis of these high grade gliomas also allowed us to point out that TOX2 hypermethylation in glioblastomas seems to be independent from tumor localization and is present in both pediatric and adult age.
TOX2 was also found to be hypermethylated and consequently downregulated in breast and lung cancer [30]. This study showed that TOX2 knockdown modulates different molecular pathways such as tissue remodeling, inflammatory response and cell differentiation. The molecular function of this gene is still unknown although it has been suggested that it might be a putative transcriptional activator involved in the hypothalamo-pituitary-gonadal system such as the TOX2 ortholog (GCX-1), identified from a rat granulosa cell cDNA library [31].
Tessema and colleagues [30] have identified two transcript variants: var.5 and var.6. According to the aminoacid sequences deduced from these two transcripts, the isoform called var.5 presents a HMG box domain showing 100% homology with the HMG box domain of GCX-1, suggesting that TOX2 may be a transcriptional activator in humans. On the other hand, var.6 does not encode for the HMG box domain, thus this TOX2 isoform does not bind the DNA and may be a negative competitor of the other variants. In our qRT-PCR experiments, we designed an assay able to amplify all isoforms. It is known that most genes have downstream start sites within the gene bodies of the transcriptional units of the upstream promoters and methylation may be a mechanism for controlling alternative promoter usage [32]. Thus, it would be interesting to individually quantify the different isoforms and to study the possible impact of methylation alterations on alternative isoforms expression.
To explore whether IRX2 and TOX2 may also have an impact on tumor prognosis, we performed a survival analysis using a web-tool called PROGgeneV2. This tool allows to select a dataset containing gene expression data for a gene of interest. Since the unavailability of a specific dataset for pediatric PAs, the Kaplan-Meier plots (Figure 7A, 7B) were generated using gene expression data of adult LGG from TCGA [TCGA-LGG]. The results showed a significant difference in the survival rate between patients with different expression of TOX2 (Figure 7A) and IRX2 (Figure 7B), suggesting that these genes may be important predictive biomarkers of survival also in adult patients affected by different types of LGG gliomas.
Interestingly, gene ontology annotations related to the above mentioned genes include: sequence-specific DNA binding (EN2, and IRX2), chromatin DNA binding (TOX2), RNA polymerase II transcription factor binding (TOX2). EN2 and IRX2 contain a conserved DNA sequence encoding a homeodomain that specifically binds to DNA motifs. It has been established that the inhibition of homeobox genes by promoter CpGs island hypermethylation contributes to the inactivation of regulatory or DNA repair genes, concurring to tumorigenesis. Moreover, it has been recognized that homeobox hypermethylated genes in human neoplasms [33–38], including PA [5] overlapped with known Polycomb targets. Polycomb group proteins form multi-protein complexes that dynamically alter chromatin structure by modifying specific residues in histone tails and recruit DNA methyltransferases methylating DNA [39]. Polycomb-mediated repression is a principal mechanism by which HOX gene expression is tightly regulated during development [40]. Besides, Reddington et al. [41] speculate that DNA methylome reprogramming in cancer leads to an altered Polycomb binding landscape influencing gene expression regulation.
In conclusion, although we still do not functionally validate any of the identified genes as potentially relevant to the biology of PA, also because of the difficulty in culturing these lesions successfully, our results strongly suggest that PA may be related to the specific brain site where the tumor arises from region-specific cells of origin. Moreover, we found a specific topographical biomarkers (IRX2) confirming that different PAs segregate by tumor location. More interestingly, we identified TOX2 as a promising tumor biomarker, suggesting its possible role in gliomas development, with a differential expression in PAs with different brain localization and a more pronounced hypermethylation in glioblastomas. TOX2 is involved in the control of cell apoptosis, growth, metastasis and DNA repair and is frequently deregulated in a variety of human malignances, however the functional role in tumors remain unspecified, and needed for future investigations.
DNA methylation biomarkers with diagnostic, prognostic and predictive power have great potential to contribute to personalized medicine throughout life.
The use of appropriate DNA methylation biomarker panels will prove beneficial where the disease phenotype is quite heterogeneous. It is also expected that the genetic component of disease will be further revealed, which will subsequently allow the strengthening of biomarker panels by combining genetic and DNA methylation biomarkers.
METHODS
Tumor specimens
Frozen tissue of twenty cases (n = 20) of pediatric (≤18 y) pilocytic astrocytomas were collected as part of the Italian National Program of Centralization of Pediatric Brain Tumor.
Frozen tissue samples from temporal lobes of adult healthy individuals (n = 4) submitted to epilepsy routine examination, were also collected.
The tumor samples were collected fresh at the time of surgery. Portions of resected tumors were snap frozen in liquid nitrogen and stored at –80° C until use, and the rest of the tissue was formalin fixed and paraffin embedded for routine histopathology. Haematoxylin-eosin stained sections of each case were reviewed carefully before they were selected for DNA extraction. Tumor areas from these specimens had been carefully selected by a pathologist to contain 60–90% neoplastic cells. This procedure allow us to evaluate difference in methylation between each case without surrounding normal tissue.
Clinicopathological data was available for all cases, including tumor location (Table 1).
Table 1: Sample description
N |
Diagnosis |
Tumor location |
Sex |
Age |
|---|---|---|---|---|
1 |
PA |
Cerebellum (I) |
M |
17 |
2 |
PA |
Cerebellum (I) |
F |
7 |
3 |
PA |
Cerebellum (I) |
M |
12 |
4 |
PA |
Frontal lobe (S) |
F |
2 |
5 |
PA |
Frontal lobe (S) |
M |
1 |
6 |
PA |
Optic chiasm (S) |
M |
1 |
7 |
PA |
Cerebellum (I) |
F |
13 |
?8 8 |
PA |
Cerebral hemisphere (S) |
F |
7 |
9 |
PA |
Cerebellum (I) |
M |
11 |
10 |
PA |
Optic chiasm (S) |
M |
2 |
11 |
PA |
Cerebellum (I) |
F |
9 |
12 |
PA |
Temporal lobe (S) |
F |
10 |
13 |
PA |
Cerebellum (I) |
F |
3 |
14 |
PA |
Cerebellum (I) |
M |
11 |
15 |
PA |
Hypothalamus (S) |
M |
5 |
16 |
PA |
Cerebellum (I) |
M |
3 |
17 |
PA |
Cerebellum (I) |
M |
5 |
18 |
PA |
Hypothalamus (S) |
M |
3 |
19 |
PA |
Frontal lobe (S) |
F |
3 |
20 |
PA |
Hypothalamus (S) |
F |
1 |
PA: pilocytic astrocytomas.
I: infratentorial.
S: supratentorial.
Only the samples with a tumor cell content estimated to be ≥70% from histopathological assessment were included for molecular analysis.
Ethics approval and consent to participate
All procedures performed in studies involving human participants were in accordance with the ethical standards of the institutional and/or national research committee and with the 1964 Helsinki declaration and its later amendments or comparable ethical standards.
Informed consent was obtained from all individual participants included in the study.
DNA samples purification
To isolate DNA from fresh frozen tissue, we used a commercial kit, called “DNeasy Blood & Tissue Kit” from Qiagen. DNA samples were analyzed quantitatively and qualitatively through spectrophotometric reading, using NanoDrop, fluorometric reading, by using PicoGreen as DNA intercalator, and by electrophoresis in a 0.8% agarose gel.
Illumina infinium HumanMethylation27 BeadChips
20 PA samples and 4 control samples were analyzed using the Illumina Infinium HumanMethylation27 BeadChips according to the manufacturer’s instructions (Illumina, San Diego, USA Part#11322371 Rev. A).
DNA methylation analysis
Methylation data were visualized and analyzed using the GenomeStudio® software (Illumina). None of the samples were excluded following quality control steps assessed by bisulfite conversion, extension, staining, hybridization, target removal, negative and non-polymorphic control probes. Methylation levels [beta values (β)] were estimated as the ratio of signal intensity of the methylated alleles to the sum of methylated and unmethylated intensity signals of the alleles. The β values vary from 0 (no methylation) to 1 (100% methylation). CpG sites with a detection p-value > 0.05 were removed from analysis. Differential methylation levels (Δβ) between the groups of interest were calculated with the Illumina Custom model, as implemented in the Illumina GenomeStudio software, and DiffScores were computed. For a p-value of 0.05, DiffScore = ± 13; For a p-value of 0.01, DiffScore = ± 22; For a p-value of 0.001, DiffScore = ± 33. To account for multiple testing, the Illumina Custom Error Model with the False Discovery Rate (FDR) corrections was applied; we ran 1000 permutations and included FDR up to 20%.
The differential methylation probes were selected based on a DiffScore ≥ |22| and annotated according to the HumanMethylation450 (450K) manifest. The annotated probes on sex chromosome were excluded and only those present on a CpG Island were used for the subsequent analysis.
The corresponding CpG Islands were searched through the GSE44684 dataset [5] annotated according to the 450K, to perform the probe enrichment. This method (Figure 2) takes advantage of the wider coverage provided by the 450K to increase the number of probes for each significantly differently methylated CpG islands found with the HumanMethylation27 BeadChips. This allows, at the same time, an increase of the robustness of HumanMethylation27 results and their validation. The validation of our HumanMethylation27 results, based on the 450K data, was performed selecting those CpG Islands whose direction of methylation change was consistent between the two BeadChips. Furthermore, we established to select the CpG islands for which the percentage of probes, whose differential methylation value was greater or equal to the corresponding CpG island differential methylation mean value, was greater or equal to 30%. Only those CpG islands, with a mean absolute differential methylation value ≥ 0.05 and with at least 3 probes were considered. The list of genes validated is reported in Supplementary Tables 1 and 2.
The database NCBI Gene Expression Omnibus (GEO) portal (http://www.ncbi.nlm.nih.gov/geo/) was used to retrieve the in silico glioblastoma dataset under accession numbers GSE19391. For each CpG sites interrogated in the region of interest, processed data were used.
Bioinformatics
The Gene Set Enrichment Analysis (GSEA) of the significant differently methylated loci were conducted by the Ingenuity Pathway Analysis (IPA) Software (Ingenuity Systems, Redwood City, CA, USA; www.ingenuity.com) from which are derived the information on the pathways potentially involved.
Gene expression data of normal brain tissues were retrieved from the Genotype-Tissue Expression (GTEx) Project (http://www.GTExportal.org), which contains data from gene expression microarrays and RNA sequencing.
The analysis of PA survival was performed using the ProGgeneV2 Prognostic Database (http://www.compbio.iupui.edu/proggene/) [6]. The Kaplan-Meier survival plots were constructed on in silico data using low-grade glioma survival data from TCGA [TCGA-LGG].
qRT-PCR
RNA extraction from 3 supratentorial and 11 infratentorial tumor PA tissue samples stored in RNA later was performed using the RNeasy Mini Kit (Qiagen, Germany) following manufacturer’s instructions. Pooled normal brain total RNAs from different human brain areas were purchased from Clontech, in particular: Human Brain, Cerebellum Total RNA (636535) and Human Brain, Cerebral Cortex Total RNA (636561). Retro-transcription was performed starting from 1μg RNA/sample using the High Capacity Kit (Applied Biosystems, Carlsbad, CA, USA). Gene expression, conducted using ABI Prism 7500 Sequence Detection System (Applied Biosystems, Foster City, CA), was assessed by RT qPCR using SsoAdvanced™ Universal SYBR® Green Supermix (Bio-Rad) for each gene tested and for the endogenous TFRC. Supplementary Table 3 summarized primers used in this study to conduct qRT-PCR. Gene expression data were analyzed using the ΔΔCT method. Statistical analyses were done using R function “t.test”.
Author contributions
MA: study concept and design, samples and clinical data collection, analysis and interpretation of clinical data, drafting of the manuscript. AF: methylation data management and analyses, acquisition and analysis of qRT-PCR data, statistical analysis, bioinformatic analysis, drafting of the manuscript. EL: methylation, gene expression and in silico survival analysis, interpretation of data, drafting of the manuscript. LM: DNA extraction from tissue and stool samples, bisulfite treatment, DNA whole genome methylation assay, RNA extraction, acquisition of qRT-PCR data, genetic mutations screening. CZ: preliminary methylome data analysis. PS: Ingenuity Pathway Analysis. DG: methylation data management and analyses, supervision on statistical analysis and bioinformatic analysis. CC: acquisition and analysis of qRT-PCR data obtained in normal brain RNA samples. EB: acquisition, analysis and supervision of qRT-PCR data obtained in normal brain RNA samples. MB: supervision on DNA and RNA extraction, supervision on genetic mutations screening. AC: samples and clinical data collection, interpretation of data. FG: study concept and design, supervision on samples and clinical data collection, analysis and interpretation of clinical data, drafting of the manuscript. PZ: study concept and design, supervision on methylation and gene expression analysis, supervision on statistical analysis and bioinformatic analysis, analysis and interpretation of data, drafting of the manuscript. All Authors discussed the results and commented on the manuscript.
ACKNOWLEDGMENTS
We thank Dr. Rebecca Lewis Lalatta for kindly reviewing the grammar and syntax of the manuscript.
CONFLICTS OF INTEREST
None of the authors has conflicts of interest
FUNDING
This work was partially supported by grants from Fondazione Neuroblastoma to FG, Fondazione Banco di Sardegna, Regione Autonoma della Sardegna (CRP-79303) and Fondo per la Ricerca Locale (ex 60%), Università di Cagliari to PZ.
REFERENCES
1. Burkhard C, Di Patre PL, Schüler D, Schüler G, Yaşargil MG, Yonekawa Y, Lütolf UM, Kleihues P, Ohgaki H. A population-based study of the incidence and survival rates in patients with pilocytic astrocytoma. J Neurosurg. 2003; 98:1170–4. https://doi.org/10.3171/jns.2003.98.6.1170.
2. Jones DT, Hutter B, Jäger N, Korshunov A, Kool M, Warnatz HJ, Zichner T, Lambert SR, Ryzhova M, Quang DA, Fontebasso AM, Stütz AM, Hutter S, et al. Recurrent somatic alterations of FGFR1 and NTRK2 in pilocytic astrocytoma. Nat Genet. 2013; 45:927–32. https://doi.org/10.1038/ng.2682.
3. Zhang J, Wu G, Miller CP, Tatevossian RG, Dalton JD, Tang B, Orisme W, Punchihewa C, Parker M, Qaddoumi I, Boop FA, Lu C, Kandoth C, et al. Whole-genome sequencing identifies genetic alterations in pediatric low-grade gliomas. Nat Genet. 2013; 45:602–12. https://doi.org/10.1038/ng.2611.Whole-genome.
4. Gnekow AK, Falkenstein F, von Hornstein S, Zwiener I, Berkefeld S, Bison B, Warmuth-Metz M, Driever PH, Soerensen N, Kortmann RD, Pietsch T, Faldum A. Long-term follow-up of the multicenter, multidisciplinary treatment study HIT-LGG-1996 for low-grade glioma in children and adolescents of the German Speaking Society of Pediatric Oncology and Hematology. Neuro Oncol. 2012; 14:1265–84. https://doi.org/10.1093/neuonc/nos202.
5. Lambert SR, Witt H, Hovestadt V, Zucknick M, Kool M, Pearson DM, Korshunov A, Ryzhova M, Ichimura K, Jabado N, Fontebasso AM, Lichter P, Pfister SM, et al. Differential expression and methylation of brain developmental genes define location-specific subsets of pilocytic astrocytoma. Acta Neuropathol. 2013; 126: 291–301. https://doi.org/10.1007/s00401-013-1124.
6. Goswami CP, Nakshatri H. PROGgeneV2: enhancements on the existing database. BMC Cancer. 2014; 14:970.
7. Pollack IF, Hamilton RL, Finkelstein SD, Campbell JW, Martinez AJ, Sherwin RN, Bozik ME, Gollin SM. The relationship between TP53 mutations and overexpression of p53 and prognosis in malignant gliomas of childhood. Cancer Res. 1997; 57:304–9.
8. Pollack IF, Finkelstein SD, Burnham J, Holmes EJ, Hamilton RL, Yates AJ, Finlay JL, Sposto R; Children’s Cancer Group. Age and TP53 mutation frequency in childhood malignant gliomas: results in a multi-institutional cohort. Cancer Res. 2001; 61:7404–7.
9. Patt S, Gries H, Giraldo M, Cervos-Navarro J, Martin H, Jänisch W, Brockmöller J. p53 gene mutations in human astrocytic brain tumors including pilocytic astrocytomas. Hum Pathol. 1996; 27:586–9.
10. Gan L, Pan J, Chen S, Zhong J, Wang L. [DNA methylation of ZIC1 and KLOTHO gene promoters in colorectal carcinomas and its clinicopathological significance]. [Article in Chinese]. Zhejiang Da Xue Xue Bao Yi Xue Ban. 2011; 40:309–14.
11. Lee J, Jeong DJ, Kim J, Lee S, Park JH, Chang B, Jung SI, Yi L, Han Y, Yang Y, Kim K, Lim JS, Yang I, et al. The anti-aging gene KLOTHO is a novel target for epigenetic silencing in human cervical carcinoma. Mol Cancer. 2010; 9:109. https://doi.org/10.1186/1476-4598-9-109.
12. Pan J, Zhong J, Gan LH, Chen SJ, Jin HC, Wang X, Wang LJ. Klotho, an anti-senescence related gene, is frequently inactivated through promoter hypermethylation in colorectal cancer. Tumor Biol. 2011; 32:729–35. https://doi.org/10.1007/s13277-011-0174-5.
13. Rubinek T, Shulman M, Israeli S, Bose S, Avraham A, Zundelevich A, Evron E, Nili Gal-Yam E, Kaufman B, Wolf I. Epigenetic silencing of the tumor suppressor klotho in human breast cancer. Breast Cancer Res Treat. 2012; 133:649–57. https://doi.org/10.1007/s10549-011-1824-4.
14. Wang L, Wang X, Wang X, Jie P, Lu H, Zhang S, Lin X, Lam EK, Cui Y, Yu J, Jin H. Klotho is silenced through promoter hypermethylation in gastric cancer. Am J Cancer Res. 2011; 1:111–9.
15. Wong KK, Chang YM, Tsang YT, Perlaky L, Su J, Adesina A, Armstrong DL, Bhattacharjee M, Dauser R, Blaney SM, Chintagumpala M, Lau CC. Expression Analysis of Juvenile Pilocytic Astrocytomas by Oligonucleotide Microarray Reveals Two Potential Subgroups Expression Analysis of Juvenile Pilocytic Astrocytomas by Oligonucleotide Microarray Reveals Two Potential Subgroups. Cancer Res. 2005; 65: 76–84.
16. Sharma MK, Mansur DB, Reifenberger G, Perry A, Leonard JR, Aldape KD, Albin MG, Emnett RJ, Loeser S, Watson MA, Nagarajan R, Gutmann DH. Distinct genetic signatures among pilocytic astrocytomas relate to their brain region origin. Cancer Res. 2007; 67:890–900. https://doi.org/10.1158/0008-5472.CAN-06-0973.
17. Tchoghandjian A, Fernandez C, Colin C, El Ayachi I, Voutsinos-Porche B, Fina F, Scavarda D, Piercecchi-Marti MD, Intagliata D, Ouafik L, Fraslon-Vanhulle C, Figarella-Branger D. Pilocytic astrocytoma of the optic pathway: a tumour deriving from radial glia cells with a specific gene signature. Brain. 2009; 132:1523–35. https://doi.org/10.1093/brain/awp048.
18. Zakrzewski K, Jarząb M, Pfeifer A, Oczko-Wojciechowska M, Jarząb B, Liberski PP, Zakrzewska M. Transcriptional profiles of pilocytic astrocytoma are related to their three different locations, but not to radiological tumor features. BMC Cancer. 2015; 15:778. https://doi.org/10.1186/s12885-015-1810-z.
19. Bergthold G, Bandopadhayay P, Hoshida Y, Ramkissoon S, Ramkissoon L, Rich B, Maire CL, Paolella BR, Schumacher SE, Tabak B, Ferrer-Luna R, Ozek M, Sav A, et al. Expression profiles of 151 pediatric low-grade gliomas reveal molecular differences associated with location and histological subtype. Neuro Oncol. 2015; 17:1486–96. https://doi.org/10.1093/neuonc/nov045.
20. Jeyapalan JN, Doctor GT, Jones TA, Alberman SN, Tep A, Haria CM, Schwalbe EC, Morley IC, Hill AA, LeCain M, Ottaviani D, Clifford SC, Qaddoumi I, et al. DNA methylation analysis of paediatric low-grade astrocytomas identifies a tumour-specific hypomethylation signature in pilocytic astrocytomas. Acta Neuropathol Commun. 2016; 4:54. https://doi.org/10.1186/s40478-016-0323-6.
21. Sexton-Oates A, Dodgshun A, Hovestadt V, Jones DT, Ashley DM, Sullivan M, MacGregor D, Saffery R. Methylation profiling of paediatric pilocytic astrocytoma reveals variants specifically associated with tumour location and predictive of recurrence. Mol Oncol. 2017 Apr 7. https://doi.org/10.1002/1878-0261.12062. [Epub ahead of print].
22. Bird A. DNA methylation patterns and epigenetic memory. Genes Dev. 2002; 16:6–21. https://doi.org/10.1101/gad.947102.
23. Keshet I, Schlesinger Y, Farkash S, Rand E, Hecht M, Segal E, Pikarski E, Young RA, Niveleau A, Cedar H, Simon I. Evidence for an instructive mechanism of de novo methylation in cancer cells. Nat Genet. 2006; 38:149–53. https://doi.org/10.1038/ng1719.
24. Sproul D, Nestor C, Culley J, Dickson JH, Dixon JM, Harrison DJ, Meehan RR, Sims AH, Ramsahoye BH. Transcriptionally repressed genes become aberrantly methylated and distinguish tumors of different lineages in breast cancer. Proc Natl Acad Sci. 2011; 108:4364–9. https://doi.org/10.1073/pnas.1013224108.
25. Sproul D, Kitchen RR, Nestor CE, Dixon JM, Sims AH, Harrison DJ, Ramsahoye BH, Meehan RR. Tissue of origin determines cancer-associated CpG island promoter hypermethylation patterns. Genome Biol. 2012; 13:R84. https://doi.org/10.1186/gb-2012-13-10-r84.
26. Sproul D, Meehan RR. Genomic insights into cancer-associated aberrant CpG island hypermethylation. Brief Funct Genomics. 2013; 12:174–90. https://doi.org/10.1093/bfgp/els063.
27. Timp W, Feinberg AP. Cancer as a dysregulated epigenome allowing cellular growth advantage at the expense of the host. Nat Rev Cancer. 2013; 13:497–510. https://doi.org/10.1038/nrc3486.
28. Werner S, Stamm H, Pandjaitan M, Kemming D, Brors B, Pantel K, Wikman H. Iroquois homeobox 2 suppresses cellular motility and chemokine expression in breast cancer cells. BMC Cancer. 2015; 15:896–906. https://doi.org/10.1186/s12885-015-1907-4.
29. Wu X, Rauch TA, Zhong X, Bennett WP, Latif F, Krex D, Pfeifer GP. CpG Island hypermethylation in human astrocytomas. Cancer Res. 2010; 70:2718–27. https://doi.org/10.1158/0008-5472.CAN-09-3631.
30. Tessema M, Yingling CM, Grimes MJ, Thomas CL, Liu Y, Leng S, Joste N, Belinsky SA. Differential epigenetic regulation of TOX subfamily high mobility group box genes in lung and breast cancers. PLoS One. 2012; 7. https://doi.org/10.1371/journal.pone.0034850.
31. Kajitani T, Mizutani T, Yamada K, Yazawa T, Sekiguchi T, Yoshino M, Kawata H, Miyamoto K. Cloning and Characterization of Granulosa Cell High-Mobility Group (HMG)-Box Protein-1, a Novel HMG-Box Transcriptional Regulator Strongly Expressed in Rat Ovarian Granulosa Cells. Endocrinology. 2004; 145:2307–18. https://doi.org/10.1210/en.2003-1343.
32. Maunakea AK, Nagarajan RP, Bilenky M, Ballinger TJ, D’Souza C, Fouse SD, Johnson BE, Hong C, Nielsen C, Zhao Y, Turecki G, Delaney A, Varhol R, et al. Conserved role of intragenic DNA methylation in regulating alternative promoters. Nature. 2010; 466:253–7. https://doi.org/10.1038/nature09165.
33. Rauch T, Li H, Wu X, Pfeifer GP. MIRA-assisted microarray analysis,a new technology for the determination of DNA methylation patterns,identifies frequent methylation of homeodomain-containing genes in lung cancer cells. Cancer Res. 2006; 66:7939–47.
34. Ohm JE, McGarvey KM, Yu X, Cheng L, Schuebel KE, Cope L, Mohammad HP, Chen W, Daniel VC, Yu W, Berman DM, Jenuwein T, Pruitt K, et al. A stem cell-like chromatin pattern may predispose tumor suppressor genes to DNA hypermethylation and heritable silencing. Nat Genet. 2007; 39:237–42. https://doi.org/10.1038/ng1972.
35. Rauch T, Wang Z, Zhang X, Zhong X, Wu X, Lau SK, Kernstine KH, Riggs AD, Pfeifer GP. Homeobox gene methylation in lung cancer studied by genome-wide analysis with a microarray-based methylated CpG island recovery assay. Proc Natl Acad Sci U S A. 2007; 104:5527–32. https://doi.org/10.1073/pnas.0701059104.
36. Schlesinger Y, Straussman R, Keshet I, Farkash S, Hecht M, Zimmerman J, Eden E, Yakhini Z, Ben-Shushan E, Reubinoff BE, Bergman Y, Simon I, Cedar H. Polycomb-mediated methylation on Lys27 of histone H3 pre-marks genes for de novo methylation in cancer. Nat Genet. 2007; 39:232–6. https://doi.org/10.1038/ng1950.
37. Widschwendter M, Fiegl H, Egle D, Mueller-Holzner E, Spizzo G, Marth C, Weisenberger DJ, Campan M, Young J, Jacobs I, Laird PW. Epigenetic stem cell signature in cancer. Nat Genet. 2007; 39:157–8. https://doi.org/10.1038/ng1941.
38. Gal-Yam EN, Egger G, Iniguez L, Holster H, Einarsson S, Zhang X, Lin JC, Liang G, Jones PA, Tanay A. Frequent switching of Polycomb repressive marks and DNA hypermethylation in the PC3 prostate cancer cell line. Proc Natl Acad Sci U S A. 2008; 105:12979–84. https://doi.org/10.1073/pnas.0806437105.
39. Mills AA. Throwing the cancer switch: reciprocal roles of polycomb and trithorax proteins. Nat Rev Cancer. 2010; 10:669–82. https://doi.org/10.1038/nrc2931.
40. Soshnikova N, Duboule D. Epigenetic regulation of vertebrate Hox genes: a dynamic equilibrium. Epigenetics. 2009; 4:537–40.
41. Reddington JP, Sproul D, Meehan RR. DNA methylation reprogramming in cancer: Does it act by re-configuring the binding landscape of Polycomb repressive complexes? BioEssays. 2014; 36:134–40. https://doi.org/10.1002/bies.201300130.