
INTRODUCTION
The functional loss of p53 plays a very important role in oncogenesis [1, 2]. Reports have claimed that structural mutations in the TP53 gene were seen in 30 percent of whole breast cancer patients and 80 percent of triple-negative breast cancer patients [3, 4]. There is some evidence that TP53 structural mutation status is associated with worse overall and disease-free survival, but its predictive value is still debated [5–7]. Many TP53 structural mutations are missense mutations, and the function of each mutation was verified using a yeast system [8]. There is a limitation associated with evaluating p53 function based only on TP53 missense mutations, however, and several comprehensive analyses by next-generation sequencing (NGS) have revealed other key genes associated with the p53 pathway, epigenetic abnormalities and copy number alternations without TP53 missense mutation [9]. Because of these findings, a comprehensive p53 functional pathway assay should be established considering these abnormalities [10]. Previously, we developed TP53 signature, a gene expression profile composed of 33 genes including two housekeeping genes to predict TP53 structure [11]. TP53 signature can be used to classify breast cancer patients into wild type (TP53 signature WT type) or mutant type (TP53 signature MT type) based on the expression pattern of 33 genes. The TP53 status determined by TP53 signature does not completely match to the TP53 status defined by TP53 structural status. There were some samples without TP53 structural mutation in TP53 signature mutant type. Recent reports revealed TP53 signature could also predict prognosis of early-stage breast cancer more accurately than TP53 status determined by DNA sequencing or immunohistochemically examination. Uji et al. reported that TP53 signature was a powerful predictive prognostic indicator for ER-positive breast cancer rather than TP53 structural mutation detected by NGS, Sanger sequence method, and immunohistochemistry [12]. In addition, Lehmann et al. performed a meta-analysis of 31 validation datasets to assess the usefulness of 351 different signatures to predict prognosis and therapeutic effect. In this report, TP53 signature had a robust capacity for predicting prognosis in early-stage breast cancer compared to other gene expression profiles including Mammaprint and Oncotype DX [13], which have previously been used as gene expression profile panels to predict early-stage breast cancer in clinical situations [14–18].
To date, diagnostic systems for TP53 signature have been based on microarrays. Before the robust predictive ability of TP53 signature can be used in an ordinary clinical situation, a simple and low-cost diagnostic system for TP53 signature using formalin-fixed paraffin-embedded (FFPE) tissue samples is absolutely needed. The nCounter (Nanostring Technology, Washington, CA, USA) is a gene expression analysis machine which can analyze a maximum of 800 kinds of gene expression values at the same time without PCR reaction [19]. The Prosigna Assay, based on PAM50 gene signature, on the nCounter Analysis System has already been approved by the FDA. Developing a diagnostic system for TP53 signature using the nCounter would provide us with more accurate prognostic predictive ability for early breast cancer in actual clinical situations. At the same time, it is necessary to develop new therapeutic strategies for patients with poor prognosis as diagnosed by TP53 signature.
The first purpose of this study was to develop a diagnostic system for TP53 signature through an analysis of 223 FFPE breast cancer specimens using nCounter and to demonstrate the robust predictive ability of TP53 signature compared to other expression profiles by analyzing RNA-seq data. The second purpose of this study was to clarify the molecular biological background of TP53 signature using RNA-seq data of 153 breast cancer patients and TCGA public data [3].
RESULTS
Patients and samples for analysis
Figure 1 shows patients’ backgrounds. Of the 233 patients, 220 had FFPE samples and 153 had Fresh Frozen (FF) samples. All FFPE samples were analyzed by nCounter while FF samples were analyzed by RNA-seq. Patients with FFPE samples consisted of 30 learning cohort patients and 190 nCounter validation cohort patients. Among the 190 nCounter cohort patients, 174 patients had stage I or II cancer (nCounter validation cohort). Among the 153 FF patients (RNA-seq cohort), 132 patients had stage I or II cancer (RNA-seq validation cohort). There were 120 patients in the nCounter RNA-seq common cohort, with data analyzed by both nCounter and RNA-seq. We defined “nCounter learning cohort”, “nCounter validation cohort” and “nCounter RNA-seq common cohort”. (See materials and methods.)
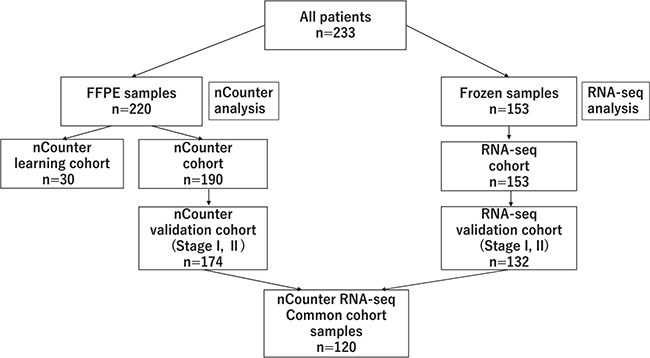
Figure 1: Details of the cohort, shows the flow chart of the breakdown of patients analyzed with nCounter and RNA-seq.
Development of TP53 signature for clinical use
Correlation between expression values from FFPE and FF samples by nCounter system
The previous reports of TP53 signature data were derived from microarray data using FF samples. In order to evaluate whether the data acquired through nCounter analysis from FF and FFPE were comparable, we examined correlations between the expression levels of the 31 genes comprising the TP53 signature in FF and FFPE samples. The gene-set used in this study is the same as gene-set used in original TP53 signature. Some reports have confirmed good correlation between the expression values of FFPE and FF samples [20]. Good correlations were observed between expression values from FFPE and FF samples as counted by nCounter (Supplementary Supplementary Figure 1). In all patients, Pearson’s correlation coefficient was over 0.9. This result showed that FFPE samples are suitable for use in diagnosis of TP53 signature with the nCounter system.
Cutoff value for TP53 signature status
The cutoff value for TP53 signature status as measured with the nCounter system was determined by analyzing samples from the 30 patients constituting the learning cohort. Fourteen patients had TP53 somatic mutations as detected by Sanger sequence (Supplementary Table 1). ROC curve was generated by plotting the relationship of the sensitivity and false positivity for TP53 status as determined by Sanger sequence at various candidate TP53 signature score cutoff values. AUC showed 0.9 (Supplementary Figure 2). When the cutoff value was at 0.78, the accuracy of TP53 status determination as confirmed by Sanger sequence was at its maximum. With a cutoff value of 0.78, sensitivity was 0.93, specificity 0.88, and accuracy 0.90. From this result, we identified the samples with TP53 signature score over 0.78 as belonging to the TP53 signature MT type and samples with TP53 signature score under 0.78 as belonging to the TP53 signature WT type.
Predictive performance of TP53 signature
TP53 signature risk score and TP53 signature status in nCounter validation cohort
Of the 190 patients analyzed by nCounter, 174 were stage I or II. Using nCounter expression data, the TP53 signature risk score of each sample was calculated, and TP53 signature status was determined. Sixty-five patients were diagnosed as TP53 signature MT type, and 110 patients as TP53 signature WT type. Table 1 shows the relation between TP53 signature status and patient clinical characteristics. A significant difference was observed between the two different TP53 signature groups with respect to ER, PR, HER2, tumor grade, histological type, need for postoperative adjuvant chemotherapy and need for postoperative adjuvant endocrine therapy. Specifically, there were significantly more patients with TP53 signature mutant type who received postoperative adjuvant chemotherapy, while there were significantly more patients with TP53 wild-type signature who received postoperative adjuvant endocrine therapy. No significant differences were observed between the two TP53 signature groups with respect to age, clinical stage, tumor size, and lymph node metastases (Table 1).
Table 1: Clinicopathological characteristics disaggregated by TP53 signature status
Total |
Mutant type |
Wild type |
|||||
|---|---|---|---|---|---|---|---|
No. of patients |
% |
No. of patients |
% |
No. of patients |
% |
P* |
|
Samples |
174 |
100 |
64 |
37 |
110 |
63 |
|
Age, years (median) |
26–98 (58.0) |
37–83 (58.5) |
26–98 (57.0) |
0.233 |
|||
pStage |
|||||||
I |
85 |
49 |
24 |
39 |
61 |
58 |
|
IIA |
59 |
34 |
28 |
43 |
31 |
28 |
|
IIB |
30 |
17 |
12 |
19 |
18 |
16 |
0.058 |
ER |
|||||||
Positive |
124 |
71 |
28 |
44 |
96 |
87 |
|
Negative |
50 |
29 |
36 |
56 |
14 |
13 |
<0.001 |
PgR |
|||||||
Positive |
95 |
54 |
16 |
25 |
79 |
72 |
|
Negative |
79 |
46 |
48 |
75 |
31 |
28 |
<0.001 |
HER2 |
|||||||
Positive |
16 |
9 |
12 |
19 |
4 |
4 |
|
Negative |
158 |
91 |
52 |
81 |
106 |
96 |
0.002 |
Pathological tumor size, cm |
|||||||
T1 |
112 |
64 |
39 |
61 |
73 |
66 |
|
T2 |
60 |
35 |
25 |
39 |
35 |
32 |
|
T3 |
2 |
1 |
0 |
0 |
2 |
2 |
0.374 |
Node |
|||||||
Positive |
55 |
32 |
25 |
39 |
30 |
27 |
|
Negative |
119 |
68 |
39 |
61 |
80 |
73 |
0.149 |
Grade |
|||||||
1 |
43 |
26 |
3 |
5 |
40 |
38 |
|
2 |
74 |
44 |
19 |
30 |
55 |
52 |
|
3 |
51 |
30 |
41 |
65 |
10 |
1 |
<0.001 |
Adjuvant chemotherapy |
|||||||
+ |
77 |
44 |
42 |
66 |
35 |
35 |
|
− |
97 |
56 |
22 |
34 |
75 |
65 |
<0.001 |
Adjuvant Endocrine therapy |
|||||||
+ |
123 |
71 |
25 |
39 |
98 |
89 |
|
− |
51 |
29 |
39 |
61 |
12 |
11 |
<0.001 |
Abbreviations: pStage, pathological stage; ER, estrogen receptor; PgR, progesterone receptor; HER2, human epidermal growth factor receptor type 2.
P*: Chi-square test was used for statistical analysis of patients' characteristics except for age.
Kruskal–Wallis test was used for statistical analysis of patients' age.
Survival analysis in the nCounter validation cohort
Patients with TP53 signature MT type showed worse relapse free survival (RFS) compared with TP53 signature WT type patients in the nCounter validation cohort (log-rank test, P = 0.002; Figure 2A). RFS of stage II was significantly shorter than that of stage I (log-rank test, P = 0.011; Figure 2A), and RFS of node-positive patients was shorter than that of node-negative patients (log-rank test, P = 0.022; Figure 2A). There was no significant difference of RFS related to other clinical factors. Univariate analysis showed that TP53 signature status, tumor stage, and lymph node metastasis were significantly associated with RFS (Table 2). On multivariate analysis, only TP53 signature status showed a significant association with RFS. These results indicated that TP53 signature status as determined using the nCounter system was an independent predictor of RFS.
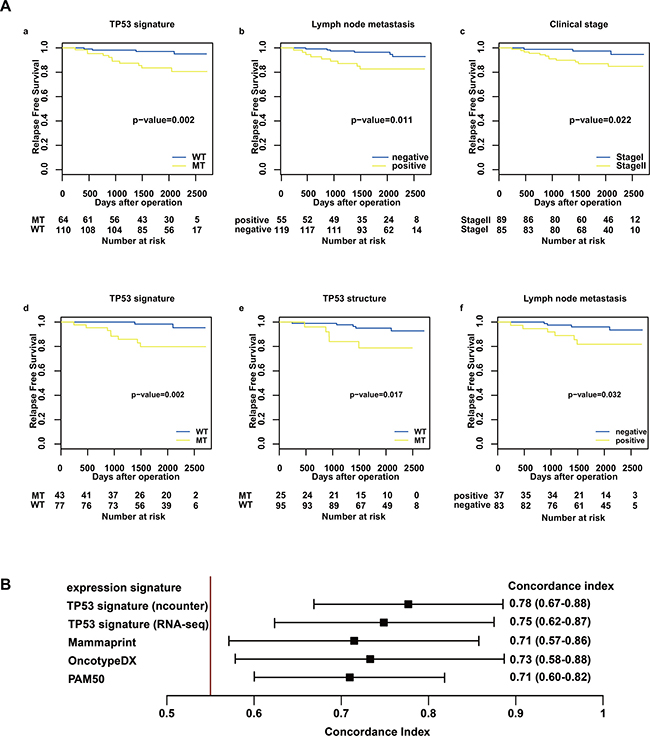
Figure 2: Relapse-free survival analysis in the nCounter validation cohort and concordance index for RFS and risk score. (A) shows RFS after operation stratified by TP53 signature status (a, d), TP53 structural status (e), stage (c), and lymph node status (b, f) using the Kaplan–Meier method. The differences between the curves of the two subgroups were assessed using the log-rank test. The results from the nCounter validation cohort are shown in a, b, and c, and the results from the nCounter and RNA-seq cohort are shown in d, e, and f. (B) shows concordance index for RFS and risk score. Predictive performance for RFS was compared among risk scores of the following gene expression profiles: TP53 signature, OncotypeDX, Mammaprint, and PAM50. The risk score of TP53 signature was calculated using count data from both nCounter and RNA-seq.
Table 2: Results of uni- and multivariate analysis (Cox proportional hazard model) showing correlation of RFS with clinicopathological factors in patients with breast cancer (nCounter validation cohort)
Variable |
Univariate |
||
|---|---|---|---|
HR |
95% CI |
p value |
|
TP53 status by signature (versus wild type) |
4.94 |
1.57–15.5 |
0.003 |
pStage (versus Stage I) |
3.94 |
1.11–13.9 |
0.018 |
Node (versus negative) |
3.49 |
1.24–9.82 |
0.017 |
Pathological tumor size (versus T1) |
1.68 |
0.61–4.64 |
0.322 |
Grade (versus 1–2) |
1.51 |
0.54–4.26 |
0.439 |
ER (versus positive) |
1.68 |
0.60–4.72 |
0.338 |
PgR (versus positive) |
2.47 |
0.84–7.24 |
0.088 |
HER2 (versus negative) |
1.54 |
0.35–6.80 |
0.590 |
Adjuvant chemotherapy (versus non-therapy) |
1.39 |
0.50–3.82 |
0.529 |
Adjuvant endocrinetherapy (versus non-therapy) |
0.84 |
0.29–2.45 |
0.747 |
Variable |
Multivariate |
||
HR |
95% CI |
p value |
|
TP53 status by signature (versus wild type) |
4.2 |
1.33–13.3 |
0.015 |
pStage (versus Stage I) |
3.15 |
0.88–11.3 |
0.078 |
Abbreviations: pStage, pathological stage; Node, lymph node metastasis; ER, estrogen receptor; PgR, progesterone receptor; HER2, human epidermal growth factor receptor type 2; HR, hazard ratio;CI, confidence interval.
Survival analysis in the nCounter RNA-seq common cohort
In a survival analysis of the nCounter RNA-seq common cohort, TP53 structural mutation data was added as a predictive factor alongside clinical factors and TP53 signature status. Of the 120 patients, 25 had TP53 structural mutation. On univariate analysis, TP53 signature status, TP53 structural mutation and lymph node metastasis were significantly associated with RFS (Table 3) (Figure 2A). On multivariate analysis, only the TP53 signature showed a significant association with RFS. There were three recurrent patients diagnosed as TP53 signature MT type without TP53 structural mutation. These results were consistent with previous reports that TP53 signature status was superior to TP53 status as defined by DNA-direct sequence to predict prognosis of breast cancer.
Table 3: Results of uni- and multivariate analysis (Cox proportional hazard model) showing correlation of RFS with clinicopathological factors in patients with breast cancer (nCounter RNAseq common cohort)
Variable |
Univariate |
||
|---|---|---|---|
HR |
95% CI |
p.value |
|
TP53 status by signature (versus wild type) |
7.71 |
1.64–36.3 |
0.003 |
TP53 status by structure (versus wild type) |
4.04 |
1.17–14.0 |
0.033 |
pStage (versus Stage I) |
3.67 |
0.78–17.3 |
0.067 |
Node (versus negative) |
3.64 |
1.03–12.9 |
0.043 |
Pathological tumor size ( versus T1) |
1.53 |
0.44–5.28 |
0.504 |
Grade (versus 1–2) |
2.42 |
0.70–14.0 |
0.170 |
ER (versus positive) |
1.70 |
0.17–2.10 |
0.424 |
PgR (versus positive) |
2.10 |
0.13–1.69 |
0.246 |
HER2 (versus negative) |
2.88 |
0.61–13.6 |
0.231 |
Adjuvant chemotherapy (versus non-therapy) |
0.51 |
0.14-1.80 |
0.286 |
Adjuvant endocrinetherapy (versus non-therapy) |
1.68 |
0.47-5.97 |
0.430 |
Variable |
Multivariate |
||
HR |
95% CI |
p.value |
|
TP53 status by signature (versus wild type) |
5.27 |
1.05–26.4 |
0.043 |
TP53 status by structure (versus wild type) |
3.52 |
0.97–12.7 |
0.055 |
Node (versus negative) |
2.43 |
0.66–8.92 |
0.182 |
Abbreviations: pStage, pathological stage; Node, lymph node metastasis; ER, estrogen receptor; PgR, progesterone receptor; HER2, human epidermal growth factor receptor type 2; HR, hazard ratio;CI, confidence interval.
Comparison of predictive performance between TP53 signature and other expression profiles
The risk scores for Mammaprint, OncotypeDX, PAM50, and TP53 signature were calculated using RNA-seq count data. The predictive performance of each risk score for RFS was compared with the concordance index. The results showed that the predictive performance of TP53 signature was superior to those of other expression profiles (Figure 2B). Furthermore, TP53 signature status as diagnosed by nCounter enables more accurate prediction than that as diagnosed by RNA-seq does (Figure 2B).
Molecular features of samples with TP53 signature MT
Molecular biological features of TP53 signature were investigated by analyzing TCGA data and RNA-seq data. First, somatic mutation genes frequently observed in samples with TP53 signature MT type were examined. One hundred and twenty-six mutation genes were seen across over six samples with TP53 signature MT type as determined according to the support vector machine (SVM) method. Of these 126 filtered genes, 78 were more frequently seen in the TP53 signature MT type than in the WT type (Figure 3A, Supplementary Table 2). Gene Ontology (GO) enrichment analysis of these 78 genes revealed that many of them were related to the GO terms “DNA repair”, (e.g., BRCA1 and RB1), “microtubule-based process”, (e.g., KIF and DNAH family) or “chromosome organization” (e.g., CENPF, HUWE1) (Supplementary Table 3). Next, somatic mutations frequently seen in the group with TP53 signature MT type but without TP53 somatic mutation were identified. In this cohort, many of the genes were related to the GO terms “DNA repair” (e.g., ERCC6, HUWE1, BRCA2, and CUL4B), “regulation of cellular macromolecule biosynthetic process” (e.g., ATRX, BRCA2, RB1, CUL4B, and TPR) or “nucleic acid metabolic process” (Supplementary Tables 4, 5). Analysis using TP53 signature status as determined according to the clustering method showed similar results (Supplementary Table 2).
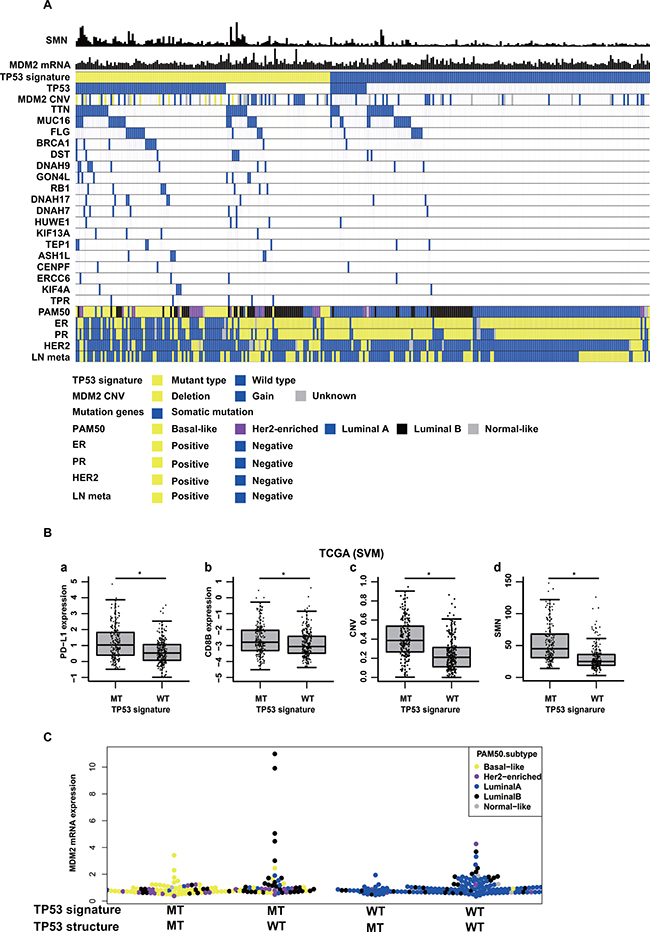
Figure 3: Molecular back ground of TP53 signature in TCGA data. (A) shows somatic mutation numbers (SMN), MDM2 mRNA expression values, TP53 signature status, TP53 somatic mutation status, MDM2 copy number variation (CNV), mutation genes, PAM50 subtypes, ER status, PR status, Her2 status, and Lymph node metastasis status (LN meta) in TCGA data. The shown patients in this figure are breast cancer patients with stage I or II. (B) shows comparison of (a) PD-L1 expression, (b) CD8B expression, (c) CNV, and (d) Somatic mutation number (SMN) between TP53 signature status in TCGA data. TP53 signature status was determined according to the support vector machine method (SVM). (C) shows MDM2 mRNA expression levels among following four subtypes; TP53 signature MT type with TP53 somatic mutation, TP53 signature MT type without TP53 somatic mutation, TP53 signature WT type with TP53 somatic mutation, TP53 signature WT type without TP53 somatic mutation.
Although somatic mutation call using RNA-seq was still challenging, we investigated whether a result similar to that of the TCGA data analysis would be obtained in analysis of our clinical breast cancer samples. We found that, in fact, similar results were obtained (data not shown).
Secondly, PD-L1 and CD8B mRNA expression values, copy number variance (CNV), and somatic mutation number (SMN) were compared between the TP53 signature status groups as defined according to the SVM method using TCGA microarray data. Both PD-L1 and CD8B mRNA expression values were higher in TP53 signature MT type than in TP53 signature WT type (Figure 3B). In addition, CNV and SMN were also higher in samples with TP53 signature MT type than in those with TP53 signature WT type. The same results were obtained when TP53 signature was defined according to the clustering method (data not shown). In RNA-seq data of clinical samples, there was no significantly difference in CD8B expression value between TP53 signature status, but PD-L1 mRNA expression value was higher in TP53 signature MT type than in TP53 signature WT type (data not shown).
Finally, TP53 signature statuses as determined by nCounter were compared among intrinsic subtypes. The intrinsic subtype of each sample in the nCounter RNA-seq common cohort was determined using RNA-seq count data. All samples in the luminal A subtype were TP53 signature WT type. Half of the samples in the luminal B subtype were TP53 signature MT type. Many samples in the basal and Her2 enriched subtypes were TP53 signature MT type (Supplementary Table 6). The same analysis was performed using TCGA microarray data, and similar results were obtained (Supplementary Table 6). In TP53 signature MT type, almost all samples with basal type had TP53 structural mutation, and many samples with luminal B were without TP53 structural mutation (Figure 3A). Some samples diagnosed as TP53 signature MT type without TP53 structural mutation showed overexpression of MDM2, and these samples were luminal B type (Figure 3A, 3C). Almost all samples diagnosed as TP53 signature WT type with TP53 structural mutations were luminal A type.
DISCUSSION
Although TP53 signature is a strong predictor for early-stage breast cancer, all previous studies on TP53 signature have been performed using comprehensive expression data from FF tissue samples. In this study, we proved that risk score of TP53 signature status could be calculated using FFPE specimens rather than FF tissue samples, and that TP53 signature status from FFPE samples was a robust predictive prognostic factor independent of clinicopathologic factors. In addition, TP53 signature status as diagnosed by our system has strong predictive power compared with other expression profiles. The TP53 signature-based diagnostic system that we developed in this study is expected to be useful in clinical situations for reasons of not only predictive performance but also simplicity, cost, and reproducibility.
Other expression profiles used in clinical settings were developed based on prognostic outcomes. It is interesting that TP53 signature also has a predictive prognostic value, although TP53 signature was developed based on biological characteristics of p53 functional abnormality.
In order to clarify the reason why TP53 signature has predictive prognostic value, we set out to reveal the precise molecular backgrounds of samples with poor prognosis as diagnosed by TP53 signature. We reanalyzed TCGA data of 526 breast cancer patients and found that the total CNV and SMN were higher in samples with TP53 signature MT type than in those with TP53 signature WT type. Gene ontology of the 22 upregulated genes among the TP53 signature genes revealed that these genes were related to genome and chromosomal stability, being associated with “nuclear chromosome segregation”, “mitotic sister chromatid segregation”, “microtubule cytoskeleton organization”, “spindle organization”, “regulation of cyclin-dependent protein kinase activity” and “mitotic spindle checkpoint” (data not shown). Furthermore, BRCA1, RB1 mutation, and other gene mutations rarely reported in breast cancer but relating to DNA repair or chromosomal instability were found in samples with TP53 signature MT type along with TP53 gene mutation. These results indicated that the risk score of TP53 signature is an index of chromosomal or genome instability.
The presence of high levels of MDM2 in tumor cells decreases their ability to activate p53 [21]. We found that samples with overexpression of MDM2 were diagnosed with TP53 signature MT type, although these samples did not show TP53 structural mutation. This result shows that TP53 signature can evaluate TP53 function comprehensively with or without TP53 structural mutations. Several reports have suggested that not only mutations in the TP53 gene itself but also structural abnormality in other molecules related to the pathway is the mechanism underlying tolerance to DNA-damaging drugs [22–24]. These reports indicate that there is a limit to the efficacy of molecular functional analysis performed only based on structural mutations and a need for comprehensive biological functional analysis. TP53 signature is a new functional assay system that satisfies this requirement.
As explained above, TP53 signature status is a classification indicating genomic and chromosomal instability. Treatment decisions for breast cancer patients are typically based on the oncodriver genes that constitute the treatment targets, and intrinsic subtype is used to classify patients with regard to treatment target. Among the intrinsic subtypes, however, the basal-like subtype is considered to have no clear molecular treatment target. Our data showed that almost all patients with basal-like subtype belonged to the TP53 signature MT type. This result indicates that the basal subtype group is characterized by high genomic and chromosomal instability. Our data also showed that there were some patients with genomic and chromosomal instability in the luminal B and Her2-enriched subgroups. In patients with Luminal B type, about a half of them were TP53 signature MT type. Some Luminal B type patients with TP53 signature MT type did not show TP53 structural mutations. This result showed that there might be other mechanisms except for TP53 structural mutation to obtain chromosomal and genome instability in luminal B type patients. In the TCGA data, 75 patients were diagnosed as Luminal B type, of which 8 were deceased. Seven of these eight patients were diagnosed as TP53 signature MT type. These results showed that breast cancer patients could be classified in more detail using TP53 signature in addition to intrinsic subtype classification, and suggested that the prognosis of patients with TP53 signature MT type is poor with or without molecular target oncodriver genes because of genomic instability. The development of new treatment strategies for patients with genomic instability will improve prognosis of breast cancer patients.
Recently, treatments with immune checkpoint inhibitors have led to good outcomes in many type of cancers [25–28]. In some studies, tumor mutational load [29, 30] , chromosomal instability [31], intensity of CD8+ T cell infiltrates [32, 33] and intratumoral PD-L1 expression [34, 35] have been reported as biomarkers for responsiveness to immune checkpoint inhibitors. In our study, the molecular features of breast cancer samples with TP53 signature MT type were consistent with these biomarkers for responsiveness to immune checkpoint inhibitors. These results indicate that the TP53 signature has a potential predictive value for responsiveness to immune checkpoint inhibitors. Indeed, Tolaney et al. reported in a phase 1b/2 study that eribulin mesylate in combination with pembrolizumab led to a high response rate (33%, 95% CI: 19.5–48.1%) in patients with metastatic triple-negative breast cancer [36], of which basal subtype breast cancer accounts for the majority of cases. As mentioned in our study, almost all basal subtype breast cancer patients were TP53 signature MT type. To date, no clinical trials treating breast cancer patients with immune check point inhibitors as adjuvant therapy have been reported. To prove our hypothesis that the TP53 signature has a potential predictive value for responsiveness to immune checkpoint inhibitors, future prospective study or a retrospective sample analysis associated with a clinical trial using immune checkpoint inhibitors should be conducted.
Taken together, we developed a powerful diagnostic system based on TP53 signature that is suitable for clinical use. TP53 signature appears to be an index of chromosomal and genomic instability and to have potential predictive value for responsiveness to immune checkpoint inhibitors. The diagnostic system based on TP53 signature developed in this study will help in prognostic assessment, therapeutic decision-making, and treatment optimization in patients with breast cancer.
MATERIALS AND METHODS
Patient cohorts and samples (Figure 1)
Learning cohort
This study was approved by the Ethics Committee at the Tohoku University Hospital. We analyzed 30 patients’ FFPE samples, a set which we called the “nCounter learning cohort,” to determine the cutoff value for diagnosis of TP53 signature status using nCounter. None of this cohort had received chemotherapy or endocrine therapy preoperatively. The same cohort had been used in our previous microarray-based study [11], and TP53 status had been identified in all samples by means of TP53 DNA-direct sequencing.
Validation cohort
The validation cohort was a prospective breast cancer case series from Hoshi General Hospital and Miyagi Cancer Center from September 2007 to October 2010. Written informed consent for the study was obtained from all patients. None of the patients received had chemotherapy or endocrine therapy preoperatively. A part of each surgical specimen of breast cancer was stored as FF tissue, and the remainder was stored as FFPE tissue. Among the patients enrolled in this study, patients with ductal carcinoma in situ, those with unknown histology or those with squamous cell carcinoma were excluded from the analysis. Among the validation cohort, we called the samples analyzed by nCounter only the “nCounter cohort” (n = 190) and cases analyzed by RNA-seq the “RNA-seq cohort” (n =153). From within these cohorts, we selected the curatively resected patients with stage I–II breast cancer and called them the “nCounter validation cohort” (n = 174) and the “RNA-seq validation cohort” (n = 132). Samples that were in both the “nCounter validation cohort” and the “RNA-seq validation cohort” were grouped in an “nCounter RNA-seq common cohort” (n = 120).
RNA extraction
Glass slide specimens with 10-μm thick sections of FF and FFPE tissue blocks were prepared. Tumor cells were collected from FF tissue or FFPE tissue by macrodissection in reference to an HE-stained specimen. Total RNA was extracted from FF tissue or FFPE tissue using an RNeasy mini kit (Qiagen, Valencia, CA, USA) or an RNeasy FFPE kit (Qiagen), respectively.
Gene expression analysis by nCounter
A set of thirty-six genes including five internal control genes was used as the TP53 signature gene set for nCounter. Primers for each of these 36 genes were designed. In accordance with the manufacturer’s instructions, we measured the expression values of the 36 genes using nCounter with 200 ng of total RNA extracted from each FF or FFPE sample.
Comparison of expression data of FFPE and FF samples by nCounter system
Five patients with both FFPE and FF samples were randomly selected, and expression data of these patients’ samples were measured using the nCounter system. We compared expression data of FFPE with that of FF samples in these five patients by Pearson’s product moment correlation coefficient.
Gene expression analysis by RNA-seq
RNA quality was monitored using the 2200 TapeStation system (Agilent Technologies, Santa Clara, CA, USA). Sequencing libraries were generated using the TruSeq RNA Library Prep kit (Illumina Inc., San Diego, CA, USA) according to the manufacturer’s directions. Sequencing was performed on the Illumina HiSeq2500 platform (Illumina) in rapid mode. Raw image files were processed using the Illumina pipeline for basecalling with default parameters. On average, we obtained 50 million 50-bp-long paired-end reads from the RNA-seq. RNA-seq reads were aligned using STAR2 against the hg19 reference genome [37] . On average, we could align 98% of the reads. Raw expression data was calculated as simple read counts for the exon regions by featurecounts [38].
Somatic mutation call by RNA-seq
Somatic mutation call using RNA-seq data was performed according to the following two steps. First, the SNP call for RNA-seq data was performed using the Genome Analysis Tool kit (GATK version 3.6). Next, we defined the SNP, of which a few were reported in the database as somatic mutations. In brief, each sequenced read was aligned against the human reference genome (hg19) by STAR2, and duplicate-read removals were performed using Picard (version 2.6.0). Splitting reads in splicing site fields were performed using the SplitNCigarReads program, base quality score recalibration using the BaseRecalibrator program, and variant discovery using the Haplotype caller program. All programs were run according to the GATK tool kit. Annotation information was attached to all variants using ANNOVAR (version 20160201), and variants were filtered using the SNP databases 1000g2015aug_eas and esp6500. We identified the base substitutions, the proportion of which was under 1 percent in both SNP databases; the read count of the base substitutions as somatic mutations was over 20 (DP > 20). To determine TP53 somatic mutations accurately, we checked all samples visually using Integrative Genomics Viewer.
Risk score and TP53 signature status
Risk score of TP53 signature was calculated using count data of nCounter or RNA-seq according to the following formula.
Risk score of TP53 signature = (sum of counts of 22 genes that were upregulated in tumors with TP53 mutation) / (sum of counts of 9 genes that were downregulated in tumors with TP53 mutation)
We used the learning cohort to determine the cutoff value for TP53 signature status, because TP53 status according to Sanger sequence was known for all patients in this cohort. The cutoff value of TP53 signature score for TP53 signature status was determined to maximize accuracy of TP53 status according to Sanger sequence, and an ROC curve was drawn. TP53 status was determined using only TP53 signature score by the nCounter system, because all samples in the nCounter learning cohort were analyzed only by the nCounter system. In the RNA-seq cohort, on the other hand, only risk score was calculated and cutoff value for TP53 signature status was not determined, because TP53 status according to Sanger sequence was not known in this cohort. TP53 signature status was considered to be mutant type (TP53 signature MT type) when the risk score was higher than the cutoff value, and wild type (TP53 signature WT type) when the risk score was lower than the cutoff value. R package “ROCR” was used to draw the ROC curve and calculate the area under the curve (AUC) [39].
Statistical analysis using clinical information
The association between the various clinicopathological parameters and TP53 signature status as determined using the nCounter system was evaluated using the chi-square test or the Kruskal–Wallis exact test. RFS rates were calculated according to the Kaplan–Meier method and evaluated by the log-rank test. RFS was defined as the period from the date of operation to the date of recurrence. Univariate and multivariate analysis of various parameters for the prediction of recurrences was conducted using the Cox proportional hazards model. Regardless of the statistical test performed, differences with P < 0.05 were considered statistically significant. In the nCounter RNA-seq common cohort, TP53 structural mutation data was added to clinical factors and TP53 signature status as a predictive factor. All static analysis was conducted using R ver3.25.
Comparison of TP53 signature with other gene expression profiles
Risk scores of Mammaprint, OncotypeDX, and PAM50 were calculated using RNA-seq count data from the nCounter RNA-seq common cohort. R package, genefu version 2.6.0 was used to calculate risk scores [40]. Predictive performances for RFS were compared using risk scores ofTP53 signature, Mammaprint, OncotypeDX, and PAM50. Concordance index calculated using the R package survcomp was used to compare predictive performance [41]. Intrinsic subtype by PAM50 was defined using genefu version 2.6.0 with the RNA-seq count data [40].
Molecular biological features of TP53 signature
Diagnosis of TP53 signature status and intrinsic subtype from TCGA data
All TCGA data was retrieved from cbioportal (http://www.cbioportal.org/study?id=brca_tcga_pub).
Five hundred and twenty-six patients’ normalized microarray expression data, exome sequence data, copy number alternation data, and clinical information data were analyzed. Expression values of the 31 genes that constitute TP53 signature were obtained from normalized microarray data. TP53 signature status for TCGA data was determined by two methods. The first was the hierarchal clustering method, an unsupervised classification method. All 526 samples were divided into two clusters by hierarchal clustering. Samples of the cluster that consisted predominantly of samples with TP53 somatic mutation were identified as TP53 signature MT type. Samples of the other cluster were identified as TP53 signature WT type. The second was the linear SVM method, a supervised classification method. A total of 100 patients, 50 with TP53 somatic mutation and 50 without, were randomly selected as a training set. TP53 signature genes’ expression values and TP53 somatic mutation status of training set samples were used to build a model to predict presence of TP53 somatic mutation by the linear SVM method. The linear SVM model was built using the R package kernlab [42]. TP53 signature statuses of the 426 samples remaining in this study after the 100-sample training set was excluded were determined according to this SVM model.
Intrinsic subtype by PAM50 was defined using TCGA microarray expression data. Intrinsic subtype of each TCGA sample was defined by the R package genefu version 2.6.0 [40].
Somatic mutations in TP53 signature
To reveal somatic mutation genes in TP53 signature, we performed the following analysis. First, somatic mutation genes found in more than five patients in the TP53 signature MT group were selected. Next, Fisher’s exact test was conducted to compare the occurrence rates of each selected gene between the TP53 signature MT type group and the TP53 signature WT type group. P value under 0.05 was considered indicative of a statistically significant difference.
In addition, to reveal the difference in somatic mutation genes between the TP53 signature MT type without TP53 somatic mutation group and the TP53 signature WT type without TP53 somatic mutation group, Fisher’s exact test was conducted to compare somatic mutations between these two groups, and p value under 0.05 was considered indicative of a statistically significant difference.
A similar analysis was performed using RNA-seq expression data from clinical specimens.
Copy number variance and total somatic mutation number analysis
The differences in CNV and SMN were compared between the different TP53 signature status groups. Of the patients classified by the two methods, patients with CNV and SMN analysis data were used in this analysis (485 samples by the clustering method, 391 samples by the SVM method). The differences in CNV and SMN between the TP53 signature groups were compared by the Mann-Whitney test.
Comparison of PD-L1, CD8B mRNA expression level between TP53 signature MT and WT groups
Expression values of PD-L1 and CD8B obtained from TCGA microarray data were compared between the TP53 signature status groups. Expression values of both PD-L1 and CD8B were compared between TP53 signature status groups by Wilcox test.
Gene ontology enrichment analysis
GO enrichment analysis was performed using David ver6.7 [43, 44]. In a function annotation chart obtained from DAVID, GO term with p value under 0.1 was considered indicative of a statistically significant difference.
Abbreviations
FFPE; formalin-fixed paraffin-embedded, FF; Fresh Frozen, NGS; next-generation sequencing, RFS; relapse free survival, AUC; area under the curve, SVM; support vector machine, CNV; copy number variance, SMN; somatic mutation number, GO; Gene ontology
Author contributions
SY performed research, analyzed data and wrote the paper, KM performed bioinformatic analysis, YI performed research, TN, YK, TI, NO provided samples and clinical information, YN wrote and edited the paper. ST, CI, SK designed and performed research, analyzed data and wrote the paper.
ACKNOWLEDGMENTS
We obtained helpful advice from members of MEXTʼs Promotion Plan for the Platform of Human Resource Development for Cancer project working in graduated school of Juntendo University.
CONFLICTS OF INTEREST
S.T. received grant support from Merck Serono. C.I. received grant support from Mochida, Kyowa-Kirin, Eizai, Chugai, Tsumura, Novartis, Merck- Serono, Daiichi-Sankyo, Takeda, Nihon-Kayaku, Yakult, Taiho, Ono, Astellas, Asahikasei-Parma, Kissei, Bristol. S.K. received grant support from Novartis, Chugai, Taiho, and Merck- Serono. All remaining authors have no conflicts of interest.
FUNDING
The Joint Research Program of Joint Usage/Research Center at the Institute of Development, Aging and Cancer, Tohoku University. (S.Y, S.K),
Grants-in-Aid from the Ministry of Education, Culture, Sports, Science, and Technology of Japan (S. T),
REFERENCES
1. Fischer M. Census and evaluation of p53 target genes. Oncogene. 2017; 36:3943–3956. https://doi.org/10.1038/onc.2016.502.
2. Muller PAJ, Vousden KH. p53 mutations in cancer. Nat Cell Biol. 2013; 15:2–8.
3. Cancer Genome Atlas Network. Comprehensive molecular portraits of human breast tumours. Nature. 2012; 490:61–70. https://doi.org/10.1038/nature11412.
4. Shah SP, Roth A, Goya R, Oloumi A, Ha G, Zhao Y, Turashvili G, Ding J, Tse K, Haffari G, Bashashati A, Prentice LM, Khattra J, et al. The clonal and mutational evolution spectrum of primary triple-negative breast cancers. Nature. 2012; 486:395–9. https://doi.org/10.1038/nature10933.
5. Borresen-Dale AL. TP53 and breast cancer. Hum Mutat. 2003; 21:292–300. https://doi.org/10.1002/humu.10174.
6. Malamou-Mitsi V, Gogas H, Dafni U, Bourli A, Fillipidis T, Sotiropoulou M, Vlachodimitropoulos D, Papadopoulos S, Tzaida O, Kafiri G, Kyriakou V, Markaki S, Papaspyrou I, et al. Evaluation of the prognostic and predictive value of p53 and Bcl-2 in breast cancer patients participating in a randomized study with dose-dense sequential adjuvant chemotherapy. Ann Oncol. 2006; 17:1504–11. https://doi.org/10.1093/annonc/mdl147.
7. Olivier M, Langerod A, Carrieri P, Bergh J, Klaar S, Eyfjord J, Theillet C, Rodriguez C, Lidereau R, Bieche I, Varley J, Bignon Y, Uhrhammer N, et al. The clinical value of somatic TP53 gene mutations in 1,794 patients with breast cancer. Clin Cancer Res. 2006; 12:1157–67. https://doi.org/10.1158/1078-0432.ccr-05-1029.
8. Kato S, Han SY, Liu W, Otsuka K, Shibata H, Kanamaru R, Ishioka C. Understanding the function-structure and function-mutation relationships of p53 tumor suppressor protein by high-resolution missense mutation analysis. Proc Natl Acad Sci U S A. 2003; 100:8424–9. https://doi.org/10.1073/pnas.1431692100.
9. Leroy B, Ballinger ML, Baran-Marszak F, Bond GL, Braithwaite A, Concin N, Donehower LA, El-Deiry WS, Fenaux P, Gaidano G, Langerod A, Hellstrom-Lindberg E, Iggo R, et al. Recommended Guidelines for Validation, Quality Control, and Reporting of TP53 Variants in Clinical Practice. Cancer Res. 2017; 77:1250–60. https://doi.org/10.1158/0008-5472.can-16-2179.
10. Olivier M, Hollstein M, Hainaut P. TP53 Mutations in Human Cancers: Origins, Consequences, and Clinical Use. Cold Spring Harbor Perspectives in Biology. 2010; 2: a001008. https://doi.org/10.1101/cshperspect.a001008.
11. Takahashi S, Moriya T, Ishida T, Shibata H, Sasano H, Ohuchi N, Ishioka C. Prediction of breast cancer prognosis by gene expression profile of TP53 status. Cancer Sci. 2008; 99: 324–32. https://doi.org/10.1111/j.1349-7006.2007.00691.x.
12. Uji K, Naoi Y, Kagara N, Shimoda M, Shimomura A, Maruyama N, Shimazu K, Kim SJ, Noguchi S. Significance of TP53 mutations determined by next-generation “deep” sequencing in prognosis of estrogen receptor-positive breast cancer. Cancer Lett. 2014; 342:19–26. https://doi.org/10.1016/j.canlet.2013.08.028.
13. Lehmann BD, Ding Y, Viox DJ, Jiang M, Zheng Y, Liao W, Chen X, Xiang W, Yi Y. Evaluation of public cancer datasets and signatures identifies TP53 mutant signatures with robust prognostic and predictive value. BMC Cancer. 2015; 15:179. https://doi.org/10.1186/s12885-015-1102-7.
14. Cardoso F, van't Veer LJ, Bogaerts J, Slaets L, Viale G, Delaloge S, Pierga JY, Brain E, Causeret S, DeLorenzi M, Glas AM, Golfinopoulos V, Goulioti T, et al. 70-Gene Signature as an Aid to Treatment Decisions in Early-Stage Breast Cancer. N Engl J Med. 2016; 375:717–29. https://doi.org/10.1056/NEJMoa1602253.
15. van 't Veer LJ, Dai H, van de Vijver MJ, He YD, Hart AA, Mao M, Peterse HL, van der Kooy K, Marton MJ, Witteveen AT, Schreiber GJ, Kerkhoven RM, Roberts C, et al. Gene expression profiling predicts clinical outcome of breast cancer. Nature. 2002; 415:530–6. https://doi.org/10.1038/415530a.
16. Buyse M, Loi S, van’t Veer L, Viale G, Delorenzi M, Glas AM, d’Assignies MS, Bergh J, Lidereau R, Ellis P, Harris A, Bogaerts J, Therasse P, et al. Validation and clinical utility of a 70-gene prognostic signature for women with node-negative breast cancer. J Natl Cancer Inst. 2006; 98:1183–92. https://doi.org/10.1093/jnci/djj329.
17. Carlson JJ, Roth JA. The impact of the Oncotype Dx breast cancer assay in clinical practice: a systematic review and meta-analysis. Breast Cancer Res Treat. 2013; 141:13–22. https://doi.org/10.1007/s10549-013-2666-z.
18. Sparano JA, Paik S. Development of the 21-gene assay and its application in clinical practice and clinical trials. J Clin Oncol. 2008; 26:721–8. https://doi.org/10.1200/jco.2007.15.1068.
19. Geiss GK, Bumgarner RE, Birditt B, Dahl T, Dowidar N, Dunaway DL, Fell HP, Ferree S, George RD, Grogan T, James JJ, Maysuria M, Mitton JD, et al. Direct multiplexed measurement of gene expression with color-coded probe pairs. Nat Biotechnol. 2008; 26:317–25. https://doi.org/10.1038/nbt1385.
20. Reis PP, Waldron L, Goswami RS, Xu W, Xuan Y, Perez-Ordonez B, Gullane P, Irish J, Jurisica I, Kamel-Reid S. mRNA transcript quantification in archival samples using multiplexed, color-coded probes. BMC Biotechnol. 2011; 11: 46. https://doi.org/10.1186/1472-6750-11-46.
21. Chène P. Inhibiting the p53–MDM2 interaction: an important target for cancer therapy. Nat Rev Cancer. 2003; 3:102–9.
22. Knappskog S, Chrisanthar R, Lokkevik E, Anker G, Ostenstad B, Lundgren S, Risberg T, Mjaaland I, Leirvaag B, Miletic H, Lonning PE. Low expression levels of ATM may substitute for CHEK2 /TP53 mutations predicting resistance towards anthracycline and mitomycin chemotherapy in breast cancer. Breast Cancer Res. 2012; 14: R47. https://doi.org/10.1186/bcr3147.
23. Lonning PE, Knappskog S. Mapping genetic alterations causing chemoresistance in cancer: identifying the roads by tracking the drivers. Oncogene. 2013; 32:5315–30. https://doi.org/10.1038/onc.2013.48.
24. Knappskog S, Lonning PE. P53 and its molecular basis to chemoresistance in breast cancer. Expert Opin Ther Targets. 2012; 16:S23–30. https://doi.org/10.1517/14728222.2011.640322.
25. Reck M, Rodriguez-Abreu D, Robinson AG, Hui R, Csoszi T, Fulop A, Gottfried M, Peled N, Tafreshi A, Cuffe S, O’Brien M, Rao S, Hotta K, et al. Pembrolizumab versus Chemotherapy for PD-L1-Positive Non-Small-Cell Lung Cancer. N Engl J Med. 2016; 375:1823–33. https://doi.org/10.1056/NEJMoa1606774.
26. Herbst RS, Baas P, Kim DW, Felip E, Perez-Gracia JL, Han JY, Molina J, Kim JH, Arvis CD, Ahn MJ, Majem M, Fidler MJ, de Castro G Jr, et al. Pembrolizumab versus docetaxel for previously treated, PD-L1-positive, advanced non-small-cell lung cancer (KEYNOTE-010): a randomised controlled trial. Lancet. 2016; 387:1540–50. https://doi.org/10.1016/s0140-6736(15)01281-7.
27. Ribas A, Puzanov I, Dummer R, Schadendorf D, Hamid O, Robert C, Hodi FS, Schachter J, Pavlick AC, Lewis KD, Cranmer LD, Blank CU, O’Day SJ, et al. Pembrolizumab versus investigator-choice chemotherapy for ipilimumab-refractory melanoma (KEYNOTE-002): a randomised, controlled, phase 2 trial. Lancet Oncol. 2015; 16:908–18. https://doi.org/10.1016/s1470-2045(15)00083-2.
28. Robert C, Schachter J, Long GV, Arance A, Grob JJ, Mortier L, Daud A, Carlino MS, McNeil C, Lotem M, Larkin J, Lorigan P, Neyns B, et al. Pembrolizumab versus Ipilimumab in Advanced Melanoma. N Engl J Med. 2015; 372:2521–32. https://doi.org/10.1056/NEJMoa1503093.
29. Rizvi NA, Hellmann MD, Snyder A, Kvistborg P, Makarov V, Havel JJ, Lee W, Yuan J, Wong P, Ho TS, Miller ML, Rekhtman N, Moreira AL, et al. Cancer immunology. Mutational landscape determines sensitivity to PD-1 blockade in non-small cell lung cancer. Science. 2015; 348:124–8. https://doi.org/10.1126/science.aaa1348.
30. Chan TA, Wolchok JD, Snyder A. Genetic Basis for Clinical Response to CTLA-4 Blockade in Melanoma. N Engl J Med. 2015; 373:1984. https://doi.org/10.1056/NEJMc1508163.
31. Davoli T, Uno H, Wooten EC, Elledge SJ. Tumor aneuploidy correlates with markers of immune evasion and with reduced response to immunotherapy. Science. 2017; 355. https://doi.org/10.1126/science.aaf8399.
32. Tang H, Wang Y, Chlewicki LK, Zhang Y, Guo J, Liang W, Wang J, Wang X, Fu YX. Facilitating T Cell Infiltration in Tumor Microenvironment Overcomes Resistance to PD-L1 Blockade. Cancer Cell. 2016; 29:285–96. https://doi.org/10.1016/j.ccell.2016.02.004.
33. Dong ZY, Wu SP, Liao RQ, Huang SM, Wu YL. Potential biomarker for checkpoint blockade immunotherapy and treatment strategy. Tumour Biol. 2016; 37:4251–61. https://doi.org/10.1007/s13277-016-4812-9.
34. Herbst RS, Soria JC, Kowanetz M, Fine GD, Hamid O, Gordon MS, Sosman JA, McDermott DF, Powderly JD, Gettinger SN, Kohrt HE, Horn L, Lawrence DP, et al. Predictive correlates of response to the anti-PD-L1 antibody MPDL3280A in cancer patients. Nature. 2014; 515:563–7. https://doi.org/10.1038/nature14011.
35. Shukuya T, Carbone DP. Predictive Markers for the Efficacy of Anti-PD-1/PD-L1 Antibodies in Lung Cancer. J Thorac Oncol. 2016; 11:976–88. https://doi.org/10.1016/j.jtho.2016.02.015.
36. Tolaney S, Savulsky C, Aktan G, Xing D, Almonte A, Karantza V, Diab S. Phase 1b/2 study to evaluate eribulin mesylate in combination with pembrolizumab in patients with metastatic triple-negative breast cancer. European Journal of Cancer. 72:S16. https://doi.org/10.1016/S0959-8049(17)30131-4.
37. Dobin A, Davis CA, Schlesinger F, Drenkow J, Zaleski C, Jha S, Batut P, Chaisson M, Gingeras TR. STAR: ultrafast universal RNA-seq aligner. Bioinformatics. 2013; 29: 15–21. https://doi.org/10.1093/bioinformatics/bts635.
38. Liao Y, Smyth GK, Shi W. featureCounts: an efficient general purpose program for assigning sequence reads to genomic features. Bioinformatics. 2014; 30:923–30. https://doi.org/10.1093/bioinformatics/btt656.
39. Sing T, Sander O, Beerenwinkel N, Lengauer T. ROCR: visualizing classifier performance in R. Bioinformatics. 2005; 21:3940–1. https://doi.org/10.1093/bioinformatics/bti623.
40. Gendoo DM, Ratanasirigulchai N, Schroder MS, Pare L, Parker JS, Prat A, Haibe-Kains B. Genefu: an R/Bioconductor package for computation of gene expression-based signatures in breast cancer. Bioinformatics. 2016; 32:1097–9. https://doi.org/10.1093/bioinformatics/btv693.
41. Schroder MS, Culhane AC, Quackenbush J, Haibe-Kains B. survcomp: an R/Bioconductor package for performance assessment and comparison of survival models. Bioinformatics. 2011; 27:3206–8. https://doi.org/10.1093/bioinformatics/btr511.
42. Scharl T, Grün B, Leisch F. Mixtures of regression models for time course gene expression data: evaluation of initialization and random effects. Bioinformatics. 2010; 26:370–7. https://doi.org/10.1093/bioinformatics/btp686.
43. Huang da W, Sherman BT, Lempicki RA. Systematic and integrative analysis of large gene lists using DAVID bioinformatics resources. Nat Protoc. 2009; 4:44–57. https://doi.org/10.1038/nprot.2008.211.
44. Huang da W, Sherman BT, Lempicki RA. Bioinformatics enrichment tools: paths toward the comprehensive functional analysis of large gene lists. Nucleic Acids Res. 2009; 37:1–13. https://doi.org/10.1093/nar/gkn923.