
INTRODUCTION
Mammals encode approximately 600 proteins harboring a Really Interesting New Gene (RING) zinc finger domain [1]. Many of these proteins are ubiquitin E3 ligases, which mediate the covalent attachment of the post-translational modifier-protein ubiquitin to lysine residues in target proteins, thereby altering their localization, activity, stability, or function. Conceptually, RING proteins facilitate these reactions by binding both a ubiquitin-loaded E2 conjugase enzyme through its RING domain, as well as a substrate through another domain, and bringing them in close proximity for ubiquitin transfer onto the substrate to occur [1].
Two proportionally sized loops protruding from the RING domain zinc-finger are essential for binding of E2 enzymes, and hence E3 activity of RING proteins [1]. Some RING proteins have disproportionally sized loops and are therefore often unable to bind E2 enzymes, and as such unable to function as direct E3 ligases [2]. The two most extreme RING loops are found in the two closely related paralogs Tripartite Motif protein 41 (TRIM41) and TRIM52 [3]. These RING proteins are extreme in i) the size of their RING domain -especially loop 2 of 139 aa in TRIM52 compared to an average of 13 aa in most other RING proteins-, and ii) the amino acid composition of loop 2: ~35% aspartate and glutamate [3].
TRIM proteins have been implicated in regulation of many different cellular processes including cancer cell proliferation or resistance from cell death [4]. Phylogenetic analysis has indicated that TRIM52 has arisen in eutherian mammals through partial gene duplication of just the RING and Bbox domains of TRIM41, which contains all conserved domains of most other typical TRIM proteins: RING-Bbox-Coiled Coil-B30.2 [3]. Subsequently, many mammals have lost or pseudogenized the TRIM52 gene, whereas it has been maintained in primates and Old-World monkeys [3]. Together, these findings indicate that TRIM52 is dispensable in many mammals for development and essential homeostatic processes. Yet, primates and Old World monkeys have maintained a protein-coding TRIM52 gene, suggesting that it plays a biological role in these species.
Various residues in TRIM52 have been under positive selection pressure, which has previously prompted the speculation that it may be involved in anti-viral defense. However, unlike some other TRIM family members, TRIM52 did not confer any resistance against lenti- and retroviral infection [4].
Thus far, the biological functions of TRIM41 and TRIM52 have remained relatively poorly investigated. TRIM41 has been reported to target various Protein Kinase C (PKC) isoforms for degradation in a ubiquitin- and proteasome-dependent manner [5, 6], yet the effect of this regulation on cell function remains unclear. In contrast, TRIM52 function has only been studied in over-expression experiments, which have suggested i) a putative antiviral function by targeting the NS2A protein of Japanese encephalitis virus for proteasomal degradation [7], and ii) a putative cellular function in activation of the pro-inflammatory NFκB response [8].
However, endogenous TRIM52 protein expression, as well as its importance for human cell homeostasis under conditions of TRIM52 ablation had not been previously investigated. The fact that the human TRIM52 gene has arisen recently in evolution by gene duplication of TRIM41, and has been lost or pseudogenized in various other mammalian species suggested it to be unlikely that TRIM52 would be required for basic cellular functions. Yet, in contrast, recent analysis of several genome-wide ablation screening studies has suggested that TRIM52 may be essential for optimal proliferation or survival of some cancer cell lines [9, 10], but not others [9, 11]. Together, these data suggest that proper expression of the TRIM52 gene could be required for efficient proliferation or viability only in certain genetic cancer cell backgrounds. Identifying genes which fit this concept of genetic context-dependent fitness in cancer cells is of particular interest as they are promising targets for tumor-specific therapy [12]. In the current study, we tested the specific hypothesis that TRIM52 is important for cancer cell fitness in a context-specific manner.
We report here that TRIM52 mRNA is expressed to moderate levels in all tested human cell lines. TRIM52 ablation by inducible shRNAs significantly diminished the cell numbers of two glioblastoma cell lines by compromising their cell cycle progression in a p53-dependent manner. Together, our findings point to a non-redundant TRIM52 function that is required for optimal proliferation in certain cancer cell lines.
RESULTS
TRIM52 protein is lowly expressed in divergent cancer cell lines
Requirement for cellular functions of the endogenous TRIM52 protein had remained completely uncharacterized. Hence, in this study we set out to determine its importance for cellular fitness. RT-qPCR analysis had indicated that TRIM52 mRNA is expressed to similar, moderate levels in various commonly used human cancer cell lines (approximately eight RT-qPCR cycles above the detection limit; data not shown), suggesting it was feasible to expect detectable amounts of TRIM52 protein. To investigate TRIM52 expression and the effect of its ablation, U87MG glioblastoma cells were stably transduced with doxycycline (dox)-inducible lentiviral constructs encoding either non-targeting (NT) or TRIM52-targeting (T52) shRNAs in the artificial 3′-UTR of GFP [13] (Supplementary Figure 1A). TRIM52 mRNA expression was consistently decreased by ≥90% by two independent TRIM52-targeting shRNAs upon dox-treatment, but not two independent non-targeting controls (Supplementary Figure 1B). Moreover, the knockdown was specific for TRIM52, as the mRNA level of its closest paralog -TRIM41-, and the levels of two lncRNAs encoded in adjacent loci (TRIM52-AS1 and CTC338M12.4) remained unchanged under these conditions (Supplementary Figure 1C).
Subsequent analysis of TRIM52 protein by Western blot (WB) using a mAb showed that the ~50 kDa product detected in cells expressing non-targeting shRNAs, was reduced to nearly undetectable levels upon specific TRIM52-knockdown (Figure 1A). Together, these data indicate that TRIM52 protein is specifically detected using this mAb.
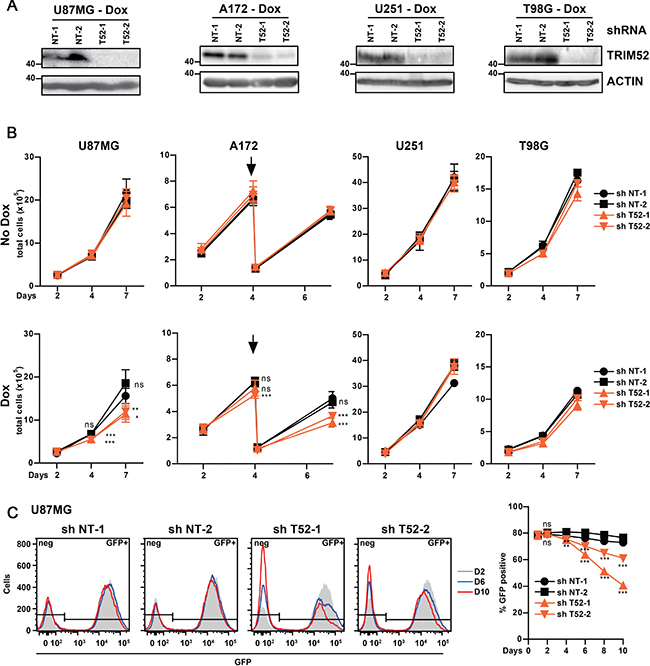
Figure 1: TRIM52 ablation reduces cellular fitness in a subset of glioblastoma cell lines. U87MG, A172, U251 or T98G glioblastoma cells stably transduced with dox-inducible shRNA vectors were seeded at a density of 1 × 10⁵ cells/well, and treated with dox. (A) TRIM52 protein expression was analyzed by western blot. (B) Total cells were counted 2, 4 and 7 days after seeding. A172 cells reached confluency at day 4, and were thus passaged once at a fixed ratio (1:5, indicated by arrow). Pooled data from two independent experiments (mean ± SD, n = 5–6; student’s t-test was performed compared to NT-1 control: *p > 0.05; **p > 0.01; ***p > 0.001). (C) U87MG cells stably transduced with dox-inducible shRNA vectors were mixed with WT cells (80% shRNA cell lines, 20% WT cells), and passaged every two days at a fixed ratio of 1:2 in the presence of dox. GFP fluorescence intensity (left panel) and percentage GFP positive cells (right panel) were measured by flow cytometry. Representative of at least three independent experiments. Data represent mean ± SD, n = 3; student’s t-test were calculated compared to non-targeting shRNAs: *p > 0.05; **p > 0.01; ***p > 0.001).
TRIM52 ablation reduces cancer cell fitness in a cell context-dependent manner
To investigate the requirement of TRIM52 for optimal cell growth and survival, we first set out to investigate whether TRIM52 reduction would impose a change in cellular fitness. To this end, a panel of eight human cancer cell lines of different genetic make-up and tissue origin (Supplementary Table 1) was stably transduced with dox-inducible lentiviral shRNA constructs as described above. This setup enabled maintaining stable cell lines without the risk of out-selecting cells with decreased cellular fitness.
shRNA expression was dox-induced in polyclonal cell pools for each shRNA, and directly compared to their non-induced counterparts. Subsequently, total cell numbers were counted at increasing days post-induction with dox. TRIM52 knockdown significantly reduced the cell numbers of U87MG and A172 glioblastoma cell lines, but not the other two glioblastoma lines tested (Figure 1B), even though TRIM52 protein expression was equally reduced in all four glioblastoma cell lines (Figure 1A), and efficient knockdown was maintained throughout all days of the experiment (Supplementary Figure 1D). TRIM52 targeting in all the other tested cell lines did also not significantly reduce total cell numbers (Supplementary Figure 2A). Together, these data show that TRIM52 knockdown reduces growth fitness in some cancer cell lines, and thus indicate that TRIM52 expression provides a fitness advantage in a cell-context dependent manner. Moreover, the observed cell fitness phenotype was not fully penetrant for any particular cancer- or tissue-type, suggesting that rather the cell-specific genetic make-up determines whether TRIM52 targeting confers a decrease in fitness.
Subsequently, a complementary direct competition assay was used to compare growth fitness in one of the cell lines sensitive to TRIM52 knockdown (U87MG; Figure 1C), and in one insensitive (HeLa; Supplementary Figure 2B–2C). In this assay, non-transduced wild-type (WT) cells were mixed in a 20%:80% ratio with cells harboring inducible TRIM52-targeting or non-targeting shRNAs. Subsequently, these cells were treated with dox, which induces both shRNA and GFP expression, allowing us to distinguish them from WT cells. The percentage of GFP-positive cells was followed by flow cytometry during cell growth as a measure for competitive fitness. shRNA-expressing cells with reduced fitness compared to WT cells are predicted to be depleted from the culture, presenting as a reduction in the percentage of GFP-positive cells. Since TRIM52-targeted and WT cells were co-cultured in the same dish in this assay, any differences in proliferation are cell-autonomous and cannot stem from differences in factors released into the cell culture medium.
The percentage of U87MG cells expressing TRIM52 shRNAs was significantly reduced in the course of ten days of mixed culture, whereas cells expressing non-targeting shRNAs were not (Figure 1C). Likewise, the percentage of HeLa cells expressing TRIM52-targeting constructs remained unchanged (Supplementary Figure 2B–2C), in line with the results from the cell counting experiments (Supplementary Figure 2A). Moreover, the GFP mean fluorescence intensity in TRIM52-targeting shRNA expressing U87MG cells moderately decreased over time (Figure 1C), suggesting that preferentially cells expressing the highest shRNA levels were out-competed. These results are in agreement with the previous cell counting assays (Figure 1B), and show that TRIM52 depletion is detrimental for growth fitness in a cell-autonomous and cell context-dependent manner.
Subsequent analysis of protein lysates of several patient-derived glioblastoma lines, and human stem cell-derived cerebral organoids, demonstrated that TRIM52 protein was expressed in ten out of thirteen analyzed samples, albeit at varying relative levels (Supplementary Figure 2D). Expression of TRIM52 was relatively high in U87MG and A172 cells, whereas we could not detect TRIM52 protein in lysates from three patient-derived GBM lines (Supplementary Figure 2D). From these data, we conclude that TRIM52 protein is widely expressed and could contribute to proliferation in GBM cells. However, the fact that TRIM52 knockdown affected A172 cells but not T98G cells (Figure 1B), even though TRIM52 protein levels in these cell lines are comparable (Supplementary Figure 2D), indicates that expression levels per se do not determine the importance of TRIM52 for optimal cell fitness.
TRIM52 ablation reduces tumor growth in a mouse xenograft model
Next, we investigated whether TRIM52 is required for optimal tumor growth in a U87MG xenograft mouse model. To allow in vivo bioluminescence imaging (BLI) as a measure for tumor size, a vector constitutively expressing firefly luciferase (Fluc) was stably integrated in U87MG cells with dox-inducible non-targeting, or TRIM52-targeting shRNAs.
Subsequently, these cells were subcutaneously implanted into the flanks of athymic nude mice (Figure 2A). Dox was provided in the drinking water to sustain GFP and shRNA expression, after which tumor growth was analyzed weekly by whole body BLI. At twelve days post-implantation (p.i.) Fluc levels could be reliably measured, yet there were no significant changes between cells expressing non-targeting and TRIM52-targeting shRNAs (Figure 2A). Subsequently, the non-targeted tumors robustly grew in size between day 18 and 31 p.i., which was paralleled by a strong increase in Fluc values. In contrast, the Fluc signal from TRIM52-targeted tumors was significantly lower at these time points (~4-fold; Figure 2A, and 2B), indicating that TRIM52-knockdown diminishes tumor growth.
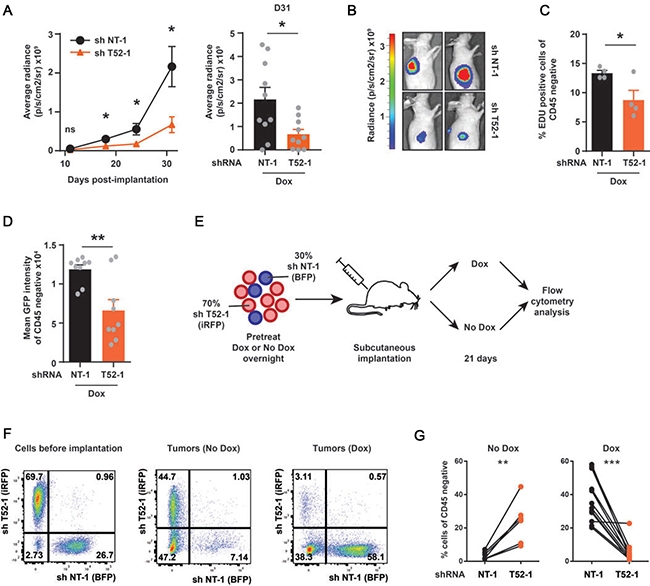
Figure 2: TRIM52 ablation reduces cancer cell proliferation and tumor formation in a U87MG xenograft model in vivo. U87MG cells stably harboring inducible non-targeting or TRIM52- targeting shRNA constructs were transduced with constructs encoding firefly luciferase (Fluc). Cells were pretreated with dox for 24 h and subcutaneously injected in the flanks of athymic nude mice. Mice were fed dox via drinking water for the duration of the experiment. (A) Bioluminescence imaging (BLI) was performed at indicated time points for all mice, and average radiance measured for each tumor. (Plotted are mean ± SEM. *p < 0.05, two-tailed Mann-Whitney U test; n = 10–12 tumors). (B) Representative BLI images from 27 days p.i. (C) At 31 d p.i. mice were injected with EdU for 2 h. Tumors were harvested and the percentage of EdU-positive cells was determined by flow cytometry. CD45-positive infiltrating immune cells were excluded. (Plotted are mean ± SEM. * p < 0.05, unpaired, two-tailed t-test; n = 4 tumors) (D) GFP fluorescence of control tumors or TRIM52 knockdown tumors was determined by flow cytometry. (Plotted are mean ± SEM. **p < 0.01, unpaired, two-tailed t-test; n = 9 tumors) (E) Schematic outline of in vivo competition experiment. U87MG cells expressing iRFP and harboring dox-inducible TRIM52 shRNAs, or expressing BFP and harboring non-targeting shRNAs were mixed in a 70%–30% ratio. This cell mixture was pretreated with dox overnight or left untreated before subcutaneous implantation into flanks of athymic nude mice. Dox was provided in the drinking water for the duration of the experiment in the on-dox group. At 21 d p.i. single cell suspensions of harvested tumors were analyzed by flow cytometry for iRFP and BFP. (F) Representative FACS plots, and (G) quantification of CD45-negative cells are depicted (Plotted are mean ± SEM. ** p > 0.01, *** p > 0.001, paired two-tailed t-test; n = 6 tumors for no-dox animal, n = 12 for dox-treated animals).
Next, proliferation of tumor cells was analyzed using the thymidine analogue 5-ethynyl-2’-deoxyuridine (EdU), which is incorporated into the DNA during S phase in proliferating cells. For this, tumor-bearing mice were injected with EdU for two hours, after which their tumor cells were analyzed by flow cytometry. In non-targeting shRNA expressing tumors, ~13% of the tumor cells were labeled with EdU. However, in TRIM52-targeted tumors, only ~7% of the cells were EdU positive, which is indicative of diminished cellular proliferation (Figure 2C).
Lastly, we determined by flow cytometry whether TRIM52-targeted tumors had reduced GFP -and thus shRNA- expression (Supplementary Figure 1A), indicative of out-selection of tumor cells with the strongest TRIM52 knockdown as seen in cell culture (Figure 1C). Consistent with this, the MFI of TRIM52-targeted tumors was reduced by approximately 50% compared to their non-targeting counterparts (Figure 2D). Together, these results show that TRIM52 ablation reduces tumor growth in vivo, which is consistent with our cell culture results (Figure 1B and 1C).
In a complementary experiment, cellular fitness of TRIM52-targeted and non-targeted U87MG cells was compared in a direct competition assay in vivo. For this, U87MG cells harboring dox-inducible TRIM52-targeting shRNAs were stably transduced with a lentiviral construct constitutively expressing iRFP, whereas non-targeted cells received an equivalent BFP vector (Figure 2E). These cells were mixed in a 70%:30% ratio, and subsequently implanted into athymic nude mice (Figure 2E). For this experiment, mice were either dox-fed to sustain shRNA expression, or not as controls.
Twenty-one days p.i., the percentage of iRFP-positive and BFP-positive cells in tumors was analyzed by flow cytometry and compared to percentages at the time of implantation (Figure 2F). CD45-positive infiltrating leukocytes from the mouse host were excluded from analyses, yet in all tumors a substantial fraction of all CD45-negative cells were neither iRFP, nor BFP positive. These cells are most likely murine fibroblasts which form part of the tumor, as well as U87MG cells which have lost iRFP or BFP expression.
In tumors derived from non-dox treated animals, the ratio of TRIM52-targeting cells and non-targeting shRNA cells resembled the situation before implantation with approximately 2.5 fold more iRFP-positive cells than BFP-positive cells (Figure 2F, 2G; left panel). In contrast, in tumors derived from dox-fed animals the majority of cells was BFP-positive (non-targeting shRNA cells), whereas only a small fraction of cells still expressed iRFP (TRIM52 knockdown cells; Figure 2F, and 2G; right panel). This further demonstrates that upon TRIM52 shRNA expression, U87MG cells have a selective disadvantage in vivo.
Taken together, these data show that TRIM52 is required for efficient tumor formation and cancer cell proliferation in a U87MG xenograft model. In line with this, cells with high TRIM52-targeting shRNA expression are preferentially lost during tumor formation, indicating that TRIM52 ablation confers a selective disadvantage in vivo.
TRIM52 ablation increases the percentage of cells in G0 and G1 cell cycle stages, consistent with reduced growth speed
The reduced cell numbers of TRIM52-targeted U87MG and A172 cells in cell culture (Figure 1B) could have resulted from decreased cell proliferation, and/or increased cell death. To specifically test these two possibilities, first the effect of TRIM52 knockdown on cell cycle distribution was investigated by widely-used cellular DNA content measurement [14]. TRIM52 knockdown consistently increased the percentage of U87MG (Figure 3A, and Supplementary Figure 3A) and A172 (Figure 3B, and Supplementary Figure 3B) cells in G0/G1 and reduced the percentage in S-phase, whereas non-targeting controls did not introduce any substantial differences in cell cycle distribution. These data consistently indicate that TRIM52 knockdown results in an increased fraction of cells in the G0/G1 cell cycle stages, indicative of a reduced proliferation speed. These data are consistent with the reduced EdU incorporation in TRIM52-targeted tumors in vivo (Figure 2C).
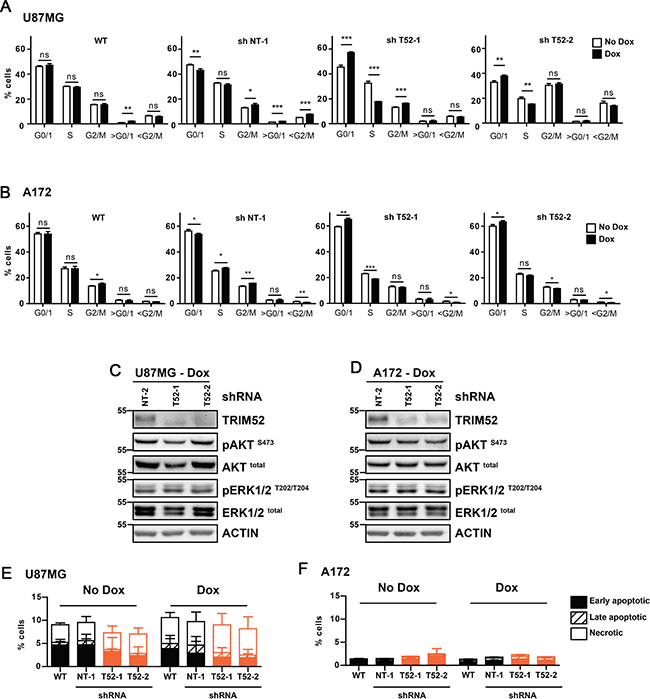
Figure 3: TRIM52 knockdown increases the accumulation in G0/1 cell cycle phase. (A, B) U87MG (A) or A172 (B) cells stably transduced with dox-inducible shRNA vectors were treated with dox, DNA was stained with propidium iodide, and DNA content was measured by flow cytometry. Data are representative of at least two independent experiments. Mean ± SD, n = 3; student’s t-test were calculated compared to non-dox treated cells per cell line: *p > 0.05; **p > 0.01; ***p > 0.001. (C, D) Western blot analysis of U87MG cells (C) and A172 cells (B) treated with dox. (E, F) U87MG (E) or A172 (F) cells as described in a. were stained with MitoStatus Red (polarized mitochondria), and propidium iodide (dead cells), and analyzed by flow cytometry. Percentages of early apoptotic (solid bars), late apoptotic (crossed bars) and necrotic cells (empty bars) were quantified. Data are representative of at least two independent experiments.
It has been reported that TRIM52 over-expression can activate NFκB [8, 15]. Since NFκB is one of the central cellular regulators of survival and proliferation [16], we investigated whether TRIM52 knockdown affects NFκB activation. TRIM52 knockdown in U87MG cells did not affect NFκB dual-luciferase reporter induction under steady-state conditions, nor did it significantly change TNF-induced reporter activation (Supplementary Figure 3C). In complementary experiments, NFκB activation was measured by phosphorylation, and subsequent degradation of its cytoplasmic inhibitor IκBα. In line with the results from the dual-luciferase reporter assay, the kinetics of TNF-induced IκBα phosphorylation (Supplementary Figure 3D; peak at 5 min.), and subsequent degradation (Supplementary Figure 3D; peak at 15 min.) were comparable in U87MG cells expressing a non-targeting control shRNA or TRIM52-targeting shRNAs. In sum, these data indicate that the effects of TRIM52 ablation on cell proliferation are not the result of changes in NFκB activation.
Growth factor signaling dependent on ERK and AKT kinases is critical for cell cycle progression [17, 18]. Therefore, we investigated whether TRIM52 knockdown affects activation by phosphorylation of these kinases, and thereby diminishes proliferation. TRIM52 ablation in U87MG and A172 cells did neither reproducibly affect total levels of ERK and AKT, nor their phosphorylation (Figure 3C, 3D), suggesting that the observed growth defects are likely independent of these signaling pathways, or the result of defects down-stream of ERK and AKT.
Next, we set out to investigate whether in addition to a defect in proliferation, an increase in cell death contributed to the decreased cellular fitness of TRIM52 knockdown cells. To this end, mitochondrial integrity was measured using Mitostatus Red dye. This dye accumulates in healthy mitochondria, yet is lost upon loss of inner mitochondrial membrane potential during apoptosis, necrosis, and oxidative stress. Under the same growth conditions during which TRIM52 ablation reduced U87MG cellular fitness, both non-induced and dox-induced cells contained between 88–92% live (Mitostatus Red-positive) cells (Figure 3E, and Supplementary Figure 3E). Similarly, non-targeting and TRIM52-targeting shRNAs maintained the same 88–92% healthy cells in U87MG cells (Figure 3E). In A172 cells, similar results were obtained with ~98% live cells under all observed conditions (Figure 3F, and Supplementary Figure 3F), indicating that differential cell survival did not substantially contribute to the observed differences in cellular fitness.
Glioblastoma cells often have go-or-grow characteristics; i.e. slowly proliferating cells are migrating more [19]. Since the two cell lines in which TRIM52 ablation caused a growth disadvantage (U87MG and A172) are both of glioblastoma origin, we addressed whether TRIM52 knockdown affects cell migration using a trans-well assay.
Serum addition in the bottom compartment of a Boyden chamber substantially increased cell migration from the upper compartment by ~12 fold (Supplementary Figure 3G; from 5 cells to 60 cells per field of view), showing that the assay per se worked as expected. Nevertheless, cells expressing TRIM52-targeting shRNAs migrated to the same extent as their counterparts expressing non-targeting shRNAs in both the absence and presence of serum as a chemo-attractant (Supplementary Figure 3G), indicating that TRIM52-ablation did not affect cell migration.
In sum, we conclude from these combined data that TRIM52-ablation reduces cellular fitness in a cell context-dependent manner, which results predominantly from decreased cell cycle progression and hence proliferation.
TRIM52 knockdown induces global mRNA changes consistent with altered glucose metabolism responses, but cellular glycolysis and oxidative phosphorylation rates are not affected
To understand which cellular pathways are directly or indirectly affected by TRIM52 knockdown and may underlie the observed proliferation differences, changes in mRNA abundance were compared by mRNAseq between U87MG cells expressing non-targeting, or TRIM52-targeting shRNAs. To this end, mRNA was harvested in biological duplicates at five days after shRNA induction by dox. This represents an early time point at which growth defects were detected (Figure 1B).
Subsequent analysis was performed to identify mRNAs with significantly different expression in each replicate of both individual TRIM52-targeting shRNAs relative to their non-targeting counterparts. Using these conditions, a total of 278 mRNAs were identified as differentially expressed, of which 148 were up-regulated, and 130 were down-regulated in TRIM52 knockdown cells (Figure 4A, and nd Supplementary Table 2).
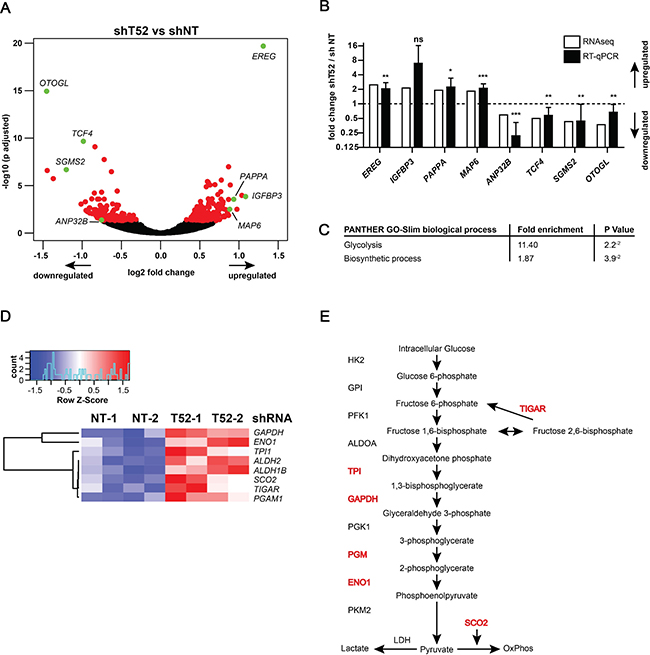
Figure 4: TRIM52 knockdown cells have a glucose metabolism-related gene signature. U87MG cells stably transduced with dox-inducible shRNA vectors were treated in duplicates with dox for 5 days; differential expression was analyzed by mRNAseq. (A) Volcano plot showing log2 fold change (TRIM52 knockdown compared to non-targeting controls) plotted against –log10 adjusted p-value. Red dots indicate genes with p > 0.05; green dots indicate genes whose expression was subsequently analyzed by RT-qPCR. (B) RT-qPCR analysis in independent samples of a selected set of differentially regulated genes (indicated in green in panel a.). Gene expression was normalized to expression in non-targeting controls. Data represent samples from two independent experiments pooled; mean ± SD, n = 6; student’s t-test was performed relative to non-targeting controls: *p > 0.05; **p > 0.01; ***p > 0.001) (C) Gene Ontology analysis of all 278 differentially regulated genes analyzed by PANTHER GO-Slim; Bonferroni correction applied for p-value calculation to correct for multiple testing. (D) Heatmap of differentially regulated glucose metabolism genes. (E) Schematic of the canonical glycolysis pathway. Genes differentially expressed upon TRIM52 knockdown are indicated in red.
Subsequently, a subset of differentially expressed mRNAs identified by mRNAseq was analyzed by RT-qPCR to determine reproducibility by an independent method. This validation set included genes with low, medium, and highest differential expression (Figure 4A, genes indicated in green). RT-qPCR analysis of the mRNAseq samples, and independently generated biological replicates showed reproducible differential expression of both up- and down-regulated genes (Figure 4B).
Next, Gene Set Enrichment Analysis (GSEA) was used to identify biological processes by Gene Ontology (GO) terms that were over- or under-represented in the set of identified genes. This identified “Glycolysis” (11.4-fold enrichment, p = 0.02) and “Biosynthetic Process” (1.9-fold enrichment, p = 0.04) as putatively affected biological processes (Figure 4C). Subsequent mapping of differentially expressed genes in the glucose metabolism pathway, indeed confirmed that genes encoding for enzymes involved in various stages of this pathway were up-regulated upon TRIM52 ablation (Figure 4D, 4E, and Supplementary Figure 4).
It should be noted that none of these glucose metabolism genes were among the most-differentially expressed, and mostly clustered in the bottom 60% of increased genes. Similar GO analyses with only the most-changed genes, or separating up- and down-regulated genes did not identify any additional pathways (not shown).
Based on these observations, we next investigated whether TRIM52 ablation affects glycolysis or oxidative phosphorylation, and thereby contributes to the reduced proliferation rate of these cells. To this end, extracellular acidification rates (ECAR) were determined as a measure of glycolysis, and oxygen consumption rates (OCR) as a measure of oxidative phosphorylation.
Under steady state growth conditions, which resulted in decreased U87MG growth by TRIM52 knockdown, OCR were comparable in cells expressing non-targeting and TRIM52-targeting shRNAs (Figure 5A; time point 0). This indicates that TRIM52 ablation did not result in substantial changes in basal respiration. Subsequently, different electron transport chain uncouplers were sequentially injected into the assay plate to measure whether ATP-linked respiration, maximal respiratory capacity, and respiratory reserve differed between cells (Figure 5A). Although the different uncouplers changed the OCR rates as expected, U87MG cells expressing different tested shRNAs all had comparable dynamically changed OCR rates (Figure 5A, and Supplementary Figure 5A), indicating that there are no major differences between them in oxidative phosphorylation.
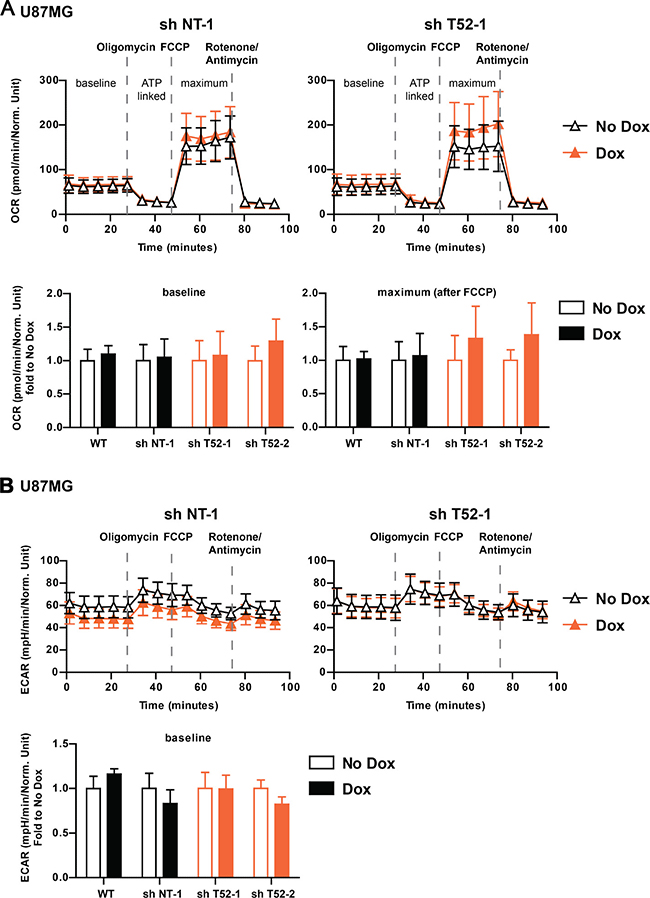
Figure 5: TRIM52 knockdown does not affect Oxygen Consumption Rate (OCR) and Extracellular Acidification Rate (ECAR). (A, B) U87MG cells stably transduced with dox-inducible shRNA vectors were treated with dox for 4 days, and seeded into Seahorse bio-analyzer analysis plates. Measurements were carried out for up to 90 min. At indicated time points, oligomycin, FCCP or rotenone/antimycin A were injected into the wells. (A) Oxygen consumption rate (OCR) was measured and normalized to protein content. Fold basal (bottom left panel) and maximum (bottom right panel) OCR is displayed (n = 8–11). (B) Extracellular acidification rate (ECAR) was measured and normalized to protein content. Fold basal (bottom panel) ECAR is displayed (n = 8–11).
Parallel ECAR determination of the different shRNA expressing cells, also indicated no major differences in basal lactate production (Figure 5B, and Supplementary Figure 5B), and hence glycolytic rates. Moreover, forced maximum glycolytic rates by blocking oxidative phosphorylation with oligomycin were also similar between all tested cell lines (Figure 5B, and Supplementary Figure 5B). From these combined data, we conclude that TRIM52 knockdown does not substantially alter glycolysis or oxidative phosphorylation rates, and that it is unlikely that the observed changes in cellular proliferation upon TRIM52 ablation stem from alterations in cellular energy production.
TRIM52 ablation reduces cell proliferation in a p53-dependent manner
We noticed that the GBM cell lines sensitive to TRIM52 ablation (U87MG and A172; Figure 1B) are homozygous WT for TP53 (the gene encoding the p53 tumor suppressor; Supplementary Table 1), whereas the insensitive lines are homozygous mutant (non-functional; Supplementary Table 1). Since activated p53 can inhibit cell cycle progression [28], we reasoned that TRIM52 ablation may reduce proliferation in a p53-dependent manner. This was further supported by the observation that two well-characterized p53-dependent genes (TIGAR and SCO2; Figure 4D) were up-regulated by TRIM52 knockdown.
To investigate whether p53 is required for reduced proliferation in TRIM52 knockdown cells, we performed a competition epistasis experiment in which TP53 was simultaneously targeted in the same cells as TRIM52 (Figure 6A). This was achieved by transducing the TRIM52 knockdown cells with an mCherry-expressing retroviral vector encoding TP53-targeting or non-targeting shRNAs. Subsequently, TRIM52 knockdown was induced by dox (which also drives GFP expression; Supplementary Figure 1A), after which the relative abundance of cells with the various shRNAs was analyzed by flow cytometry.
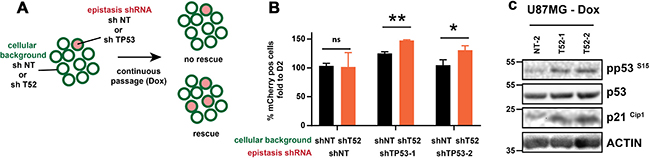
Figure 6: TP53 ablation rescues proliferation of TRIM52 knockdown cells. (A) Overview of experimental setup. (B) U87MG cells stably harboring dox-inducible TRIM52-targeting or non-targeting shRNAs were stably transduced at low transduction efficiency with vectors expressing mCherry as well as a non-targeting, or one of two TP53-targeting shRNAs. Cells were cultured in the presence of dox for 11 days, after which the percentage of mCherry-positive cells was analyzed by flow cytometry. Values are plotted relative to the percentage mCherry positive cells at day 2 post-induction with dox. (C) U87MG cells stably harboring dox-inducible TRIM52-targeting or non-targeting shRNAs were treated with dox. At day 7 post-induction whole cell lysates were analyzed by WB using the indicated antibodies.
As expected, expression of a non-targeting shRNA in TRIM52-knockdown cells or control cells did not significantly change their abundance in the mixed culture (Figure 6B). In contrast, ablation of TP53 with two independent shRNAs significantly increased their proportion in the cell pool relative to TP53 knockdown in cells in which TRIM52 was not targeted (Figure 6B). Together, these results indicate that TRIM52 ablation decreases U87MG proliferation in a p53-dependent manner. In agreement with this observation, WB analysis showed that the level of activated p53 (pSer15) and one of its major targets, the cyclin-dependent kinase inhibitor p21Cip1, were increased by TRIM52 ablation (Figure 6C), whereas the total levels of p53 remained unchanged.
In conclusion, the data in this study show that TRIM52 expression is required for optimal cell cycle progression in U87MG and A172 glioblastoma cell lines, whereas it is dispensable for optimal growth of various other tested cancer cells lines. This suggests that this recently evolved protein is required for optimal proliferation depending on the genetic context of individual cancer cell lines. We identified p53 as such a factor, although it remains to be determined whether other factors affect TRIM52-dependent phenotypes, and how TRIM52 controls proliferation at the molecular level.
DISCUSSION
For optimal proliferation, evasion of cell death and adaptation to the tumor-environment, many cancer cells rely on factors otherwise dispensable for cell growth under physiological conditions [12]. Here we specifically showed that TRIM52 provides a fitness advantage in two glioblastoma cell lines, but not in several other cancer cell lines.
The fact that the TRIM52 gene has been acquired recently in evolution, and again was lost or pseudogenized in many mammals suggests that it likely does not play a role in any essential processes in normal cells. However, this has not been formally tested, and will be experimentally addressed in future studies. Given that both cell lines that did have a proliferation phenotype (U87MG and A172) are brain-derived, it will be important to include various primary human brain cell types in these experiments. Moreover, one of the noteworthy points of TRIM52 evolution is that it was acquired in mouse and rat independently of the primate TRIM52 gene. Hence, it will be of interest to test whether ablation of e.g. mouse Trim52 affects glioblastoma cell proliferation.
Since the TRIM52 gene arose as a partial gene duplication of TRIM41, it could be that their encoded proteins regulate each other’s expression or function. In fact, yeast-two-hybrid data has suggested that both proteins can physically interact [20]. Our analyses in TRIM52 knockdown cells demonstrated that TRIM41 mRNA expression remained unaltered. This indicates that the observed proliferation effects did not result from influencing TRIM41 mRNA expression. Moreover, TRIM41 has been reported to mediate degradation of various PKC isoforms, including the widely expressed PKCα [5], which themselves regulate cancer cell proliferation under various conditions. Our preliminary data suggest that TRIM52 knockdown does not affect PKCα levels, indicating that the observed proliferation differences are likely independent of functional cross-talk with TRIM41, although at this point we cannot rule out effects on other, undiscovered TRIM41-dependent processes.
In knockdown studies it is important to ensure that observed phenotypes are dependent on shRNA expression, and specific for the intended mRNA target. In this study dox addition per se minimally influenced the experimental read-out in all assays, while specifically reducing proliferation in cells harboring TRIM52-targeting constructs, but not non-targeting shRNAs. Moreover, two independent shRNAs, targeting different parts of the TRIM52 mRNA both yielded the same phenotype, attesting to their specificity and making it unlikely that the observed effects are the result of off-targets.
Currently it remains unclear i) how TRIM52 influences cell cycle progression at a molecular level, and ii) whether TRIM52 plays a role in non-cancer cells. The results from this study have provided the means to address these questions in the future.
Proliferation in many glioblastoma lines is highly dependent on EGFR signaling through AKT and ERK pathways. Although these signaling molecules regulate growth factor dependent proliferation, they also control a plethora of other metabolism and cell death dependent functions. One of the noteworthy differences between the U87MG and A172 cells, compared to the other tested glioblastoma lines, is that they both are homozygous WT for TP53 (the gene encoding p53), while carrying homozygous inactivated PTEN alleles. Both of these genes have been implicated as important factors regulating energy metabolism through mTORC complexes, growth factor signaling, and oncogene expression in many tumors [21–23]. As such, they are likely candidates to contribute to the cell-specific effect of TRIM52 knockdown on proliferation. In line with this notion, simultaneous TP53 knockdown rescued proliferation in TRIM52 knockdown cells, indicating that TRIM52 knockdown decreased proliferation in U87MG cells in a p53-dependent manner.
However, TRIM52 ablation in LNCaP prostate cancer cells (also wt TP53, and mutant PTEN) did not affect proliferation in these cells. This indicates that a combination of homozygous WT p53 and mutant PTEN alleles may not be sufficient to explain the lack of a proliferation phenotype in this cell line, and suggests that other factors are involved.
It is noteworthy that of the tested cell lines, the two with a proliferation defect in TRIM52-ablated cells are of glioblastoma origin, indicating TRIM52 may regulate proliferation in a genetic context that is glioma-, or brain-specific. In this regard, p53 and PTEN have been shown to determine glioma stem/progenitor cell renewal and differentiation [24], which could ultimately affect proliferation speed. Many glioblastoma cell lines (e.g. U87MG) can form neurospheres under specific culture conditions [25], yet the percentage in regular culture conditions as used in this study will predominantly favor non-neurosphere (two-dimensional) growth. We have not observed any obvious differences in the low percentage of spontaneous neurosphere formation in TRIM52-knockdown cells at this point, suggesting that differences in neurosphere formation may not underlie the proliferation defect. Nevertheless, we plan to investigate this in follow-up studies under controlled cell culture conditions favoring neurosphere formation.
In addition to differentiation, the effect of TRIM52 ablation on proliferation could also result from differences in cells that have exited cell cycle (e.g. quiescent cells in G0). Our analysis showed that TRIM52 knockdown increases the percentage of cells in G0/G1, but it was not possible with the used staining to distinguish between these two cell cycle states. Attempts to distinguish between these two, by staining for the widely-used proliferation marker Ki67, have been inconclusive. Thus, our analyses indicate that thus far there is no clear correlation between TRIM52 knockdown and changes in quiescence.
It is important to mention that TRIM52 function had previously only been addressed in over-expression experiments, which had suggested a role of TRIM52 in NFκB activation. In our experiments, TRIM52 knockdown affected NFκB activation neither under resting, nor cytokine-stimulated conditions, indicating that differential NFκB activity does not underlie the proliferation defect in TRIM52-knockdown cells. Although this could mean that TRIM52 only regulates NFκB activity at high expression levels, it could also suggest that this may be cell-type specific, or that functional redundancy exists.
Lastly, we set out to identify pathways affected by TRIM52 knockdown using mRNAseq. Overall, TRIM52 ablation resulted in relatively moderate changes in gene expression. Nevertheless, both manual curation and automated GO analysis consistently identified various glucose metabolism genes to be up-regulated in both TRIM52-targeted cell lines, compared to non-targeting controls. Nevertheless, we could not detect differences in actual oxidative phosphorylation or glycolysis, suggesting that TRIM52 ablation does not substantially alter these processes, and hence are unlikely to be responsible for the observed differences in proliferation.
One should keep in mind that the changes in glucose metabolism genes may represent an indirect effect that is independent of the altered proliferation, or is not reflected at the protein level. Moreover, it is important to note that neither the rate limiting enzyme in glycolysis (Phosphofructokinase-1 [26]), nor any of the glucose transporters [27] (GLUT) were differentially regulated by TRIM52 knockdown. This may indicate that the glucose metabolism gene signature could be reflective of changes in an upstream pathway or factor controlling their expression, rather than a cause for altered proliferation.
In line with our data indicating that TRIM52 knockdown diminishes proliferation in a p53-dependent manner (Figure 6), many metabolic genes are controlled by p53. In particular the up-regulated TIGAR and SCO2 mRNAs are specific p53 targets [28], suggesting that part of the differential mRNAseq profile may stem from p53 dysregulation. Future work will be focused on elucidating the effect of TRIM52 on other key transcription factors controlling these glycolysis genes [29], and the effects of TRIM52 ablation in conditions of external p53 activation such as by the DNA damage response [28]. Together, these approaches will ultimately contribute to unraveling how TRIM52 controls proliferation at the molecular level.
In summary, here we report that TRIM52 is required for optimal proliferation in a cell context-dependent manner. Our data show that in some cell lines p53 may be an important factor determining TRIM52-dependent biological output. Although the exact molecular mechanism by which TRIM52 does so has remained elusive, this study shows that this evolutionary non-conserved protein could be a target for combinatorial gene disruption approaches in certain cancer types. Moreover, these data have provided the first steps for more detailed work to understand how TRIM52 controls proliferation at a molecular level.
MATERIALS AND METHODS
Cells
U87MG, A172 and U251 cells were a kind gift from Prof. Wolfgang Sattler (Medical University Graz); HCT116 cells were a kind gift from Prof. Manuela Baccarini (MFPL, University of Vienna); T98G cells were a kind gift from Dr. Ulrich Elling (IMBA, Vienna); DU145 cells were a kind gift from Prof. Gerda Egger (Medical University of Vienna); K562 cells were a kind gift from Dr. Andreas Brachner (University of Vienna). K562 and DU145 cell lines were cultured in RPMI (Sigma, R7388) supplemented with 10% fetal calf serum (FCS; Sigma, F7524) and 1% Penicillin-Streptomycin (Sigma, P4333). All other international cell lines were cultured in high glucose DMEM (Sigma, D6429) supplemented with 10% FCS and 1% Penicillin-Streptomycin. Patient-derived cell models were established from surgical specimens as previously described [30]. All primary cell models (BTL53, BTL1376, BTL1529, BTL2175, BTL2176, BTL2177, VBT12, VBT25, VBT72) were derived from glioblastoma multiforme (GBM) specimens [13]. After establishment, primary cell lines were cultured in RPMI 1640 medium supplemented with 10% FCS without antibiotics. The study was approved by the local ethic committees and all patients have given written informed consent for further use of the tumor material. Cerebral organoids were a kind gift from Veronica Krenn and Jürgen Knoblich (IMBA, Vienna) and were generated as previously described [31]. All cells were cultured at 37° C and 5% CO2 in a humidified incubator.
Generation of stable cell lines by lentiviral transduction
For lentivirus-like particle (VLP) production, HEK-293T cells were seeded at ~20% confluency into 6-well clusters. The next day, cells were transfected as previously described [32] with 454.5 ng pSPAX2-GagPol plasmid, 454.5 ng mini genome and 91 ng VSV-G plasmid using polyethyleneimine (PEI) as transfection reagent (Polysciences, 23966-2). Two days post transfection, recipient cells were seeded to ~20% confluency into 6-well clusters. Three days after transfection, VLP-containing supernatants were harvested from producer cells and filtered through a 0.45 μM filter (Sarstedt, 83.1826). Supernatants were diluted 1:5 with full growth media containing 8 μg/ml Polybrene (Millipore, TR-1003-G). Media from recipient cells were replaced with VLP-containing media. Three days after transduction, cells were selected using 3 μ/ml Puromycin (Fisher, 10296974) for at least three days and kept under Puromycin selection.
shRNA mediated knockdown
The retroviral LENC plasmid for stable shRNA expression was a kind gift from Johannes Zuber (IMP, Vienna Austria) and has been previously described [13]. pLT3-GEPIR plasmid for dox-inducible shRNA expression (a kind gift from Johannes Zuber (IMP, Vienna Austria)), as well as cloning strategy was described previously [13]. In brief, shRNAs were ordered as 97 bp oligos (IDT) which contain the optimized miR-E backbone as well as gene-specific shRNA regions. DNA was amplified by standard PCR using the following primers (F: 5′- tacaatactcgagaaggtatattgctgttgacagtgagcg-3′; R: 5′- ttagatgaattctagccccttgaagtccgaggcagtaggca – 3′). PCR products were cloned into pLT3-GEPIR plasmid using EcoRI (NEB) and XhoI (NEB) restriction enzymes and successful cloning was confirmed by Sanger sequencing (Eurofins genomics), using 5′-tgtttgaatgaggcttcagtac-3′ primer. shRNA target sequences were: TRIM52-1: 5′-atacgatgaggacgaagatgaa-3′; TRIM52-2: 5′-ccaagaccaagatgacgatgaa-3′; NT-1 (targeting Renilla luciferase): 5′-taggaattataatgcttatcta; NT-2 (previously described in [33]): 5′-cctaaggttaagtcgccctcgc-3′; TP53-1: 5′-actggaagactccagtggtaat-3′; TP53-2: 5′- tggaggatttcatctcttgtat-3′. To induce shRNA expression, cells were treated with 2 μg/ml dox (Sigma-Aldrich; D9891) for 4 days unless stated otherwise.
Animal studies
All animal experiments were carried out in agreement with the ethical animal license protocol in accordance with the current laws of Austria, approved by the Bundesministerium für Wissenschaft und Forschung, Austria (Permit number BMWFW 66.015/0010-WF/v/3b/2017). 6–12 week-old, sex-matched in-house bred MF-1 Nu/Nu mice were used for animal experiments. To track differences in tumor growth, 2.5 × 10⁶ tumor cells pre-treated with dox for 24 h were injected subcutaneously in a 1:1 mixture of PBS/Matrigel (Corning, #356237). For the in vivo competition assay, 3.5 × 10⁶ dox-pretreated cells were injected. To sustain shRNA-mediated knockdown, mice received dox (2 mg/ml; Sigma, D9891) in the drinking water. Tumor formation and outgrowth was tracked by bioluminescence imaging (BLI) of luciferase-labelled tumor cells. In brief, isoflurane-anesthetized mice were injected with D-luciferin (150 mg/kg) and imaged with an IVIS spectrum Xenogen machine (Perkin Elmer). Bioluminescence analysis was performed using Living Image software, version 4.4.
Flow cytometry analysis of tumors
To generate single cell suspensions, tumors were minced and digested with 1mg/ml collagenase A (Roche, 10103586001) in PBS, for 1.5 h at 37° C. Cells were washed with PBS containing 5mM EDTA and 1% bovine serum albumin (BSA), dislodged and passed through a 100 μM cell strainer (Corning, 431752). For subsequent flow-cytometry analysis, cells were treated with anti-mouse Fc-block CD16/32 antibody (2.4G2 BD) in PBS containing 5mM EDTA and 1% BSA for 10 min on 4° C. Cells were stained with murine CD45-PeCy7 antibody (BD 30-F11 1:500) for 30 min. Expression of GFP, iRFP and BFP was analyzed on CD45 negative cells. For experiments involving EdU, mice were injected intraperitoneally with 50 mg/kg EdU, after 2 hours tumors were collected, single cell suspensions were generated as described above and further processed according to the manufacturer’s protocol (Click-iT Plus EdU Flow cytometry Pacific Blue Assay kit, Invitrogen #C10636). Samples were analyzed on a FACS Fortessa (BD Biosciences).
Antibodies
For Western blots the following antibodies were used at the indicated dilutions. Actin (Sigma, A2103, 1:1000); AKT (CST, 9272, 1:1000); pAKT-S473 (CST, 9271, 1:1000); ERK1/2 (CST, 9102, 1:1000); pERK1/2-T202/T204 (CST 9101, 1:1000); HA-epitope (Abcam, ab137838, 1:1000); IκBα (CST, 4812, 1:1000); pIκBα-S32/36 (CST, 9246, 1:1000) ); p21Cip1 (Abcam, ab7960, 1:1000); p53 (CST, #2524, 1:1000); pp53-S15 (CST, #9284 P, 1:1000); TRIM52 (clone A4; Santa Cruz Biotechnologies sc-398954, 1:250); anti-rabbit-IgG-HRP (CST, 7074S); anti-mouse IgG-HRP (CST 7076S, 1:4000).
Cell counting
Cells were seeded at 1 × 10⁵ cells/well in 6-well clusters unless indicated otherwise, in media containing dox (2 μg/ml) or not. At indicated time points, supernatants from cells were harvested to collect non-adherent cells, whereas adherent cells were washed once with PBS and trypsinized (Sigma T4049). Cells were resuspended in their cognate supernatants. Then, cells were counted using a CASY cell counter (Innovatis, TTC-2KA-2037).
Apoptosis and viability determination
Cells were co-stained with MitoStatus Red (BD, 564697) and Propidium Iodide (BD 556463). MitoStatus Red was added at a final concentration of 66.6 nM to cells and incubated at 37° C/5% CO2 in the dark for 30 min. Supernatants were collected; adherent cells were trypsinized and resuspended in their cognate supernatants to retain non-adherent cells. Cells were washed twice with FACS buffer (PBS, 1% BSA, 5 mM EDTA) and resuspended in 200 μl FACS buffer containing 1.25 μg/ml Propidium Iodide and incubated for 10 min. at 4° C in the dark. Cells were analyzed by flow cytometry using the APC (MitoStatus red) and PE (PI) channels.
Cell cycle analysis
Stable inducible knockdown cells were treated with dox for 4 days. Subsequently, cells were seeded at 5 × 10⁵ cells/10 cm dish and were allowed to proliferate for another 48h. Subsequently, cells were trypsinized and resuspended in serum-free DMEM. Cells were washed once and resuspended in 100 μl cold PBS. Cells were fixed and permeabilized by dropwise addition of 300 μl ice-cold ethanol (absolute) and incubated at –20° C for at least 1 h. Cells were spun and washed once with PBS and resuspended in staining buffer (PBS containing 1% BSA, 5 mM EDTA, Propidium Iodide (SBT, sc-3541), 100 μg/ml RNAseA (Sigma, R5503)) and incubated at room temperature for 10 min to allow RNA degradation. PI fluorescence was measured in the PE channel (linear) of a FACS Fortessa (BD). Data was analyzed using FlowJo v10.0.7 using the Watson pragmatic model [34].
Competition assay
Competition assays were performed as previously described [35]. In brief, cells stably transduced with pLT3-GEPIR plasmids containing TRIM52-targeting or non-targeting shRNAs (80%) were mixed with WT cells (20%), media was supplemented with dox (2 μg/ml). The following day, GFP fluorescence intensity and percentage GFP-positive cells were measured by flow cytometry. Cells were split every two days in the presence of dox in a 1:2 ratio (U87MG) or 1:5 ratio (HeLa), respectively, and GFP signal was measured by flow cytometry. For the TP53 epistasis assay, U87MG cells stably transduced with pLT3-GEPIR plasmids containing TRIM52-targeting or non-targeting shRNAs were additionally transduced at low percentage with retroviruses stably expressing mCherry as well as a non-targeting or one of two TP53-targeting shRNAs. Cells were cultured in the presence of dox (2 μg/ml) for eleven days, after which the percentage of mCherry-positive cells was analyzed by flow cytometry.
Metabolic flux measurements
Oxygen consumption rate (OCR) and extracellular acidification rate (ECAR) were determined on a Seahorse XFe96 Analyzer (Agilent) using the Seahorse XF Cell Mito Stress test kit (Agilent, 103015-100). In brief, U87MG cells were treated with dox (2 μg/ml) for 4 days to induce knockdown. Subsequently, cells were seeded in DMEM (Sigma, D6429) supplemented with 10% FCS and 1% Penicillin-Streptomycin at 1 × 10⁵ cells/well into Seahorse XF cell Culture Microplates (Agilent 102601-100) and cultured overnight. One hour prior to the assay, media was changed to XF Base Medium (Agilent 102353-100) containing glucose (10 mM), sodium pyruvate (1 mM) and L-glutamine (2 mM). The assay was run according to the manufacturer’s instructions and OCR and ECAR were measured for 95 min. After 27, 47 and 73 min, Oligomycin (1 μM), Carbonyl cyanide-p-trifluoromethoxyphenylhydrazone (FCCP, 1 μM) and Rotenone/Antimycin A (500 nM) were subsequently injected into wells, respectively. Raw data was analyzed using Wave Desktop Software (Agilent, version 2.0) and exported and graphed in GraphPad Prism (GraphPad Software, version 7.0a).
mRNAseq analysis
U87MG cells harboring dox-inducible non-targeting shRNAs or TRIM52-targeting shRNAs were treated with dox (2 μg/ml) in biological duplicates for 5 days. GFP-positive cells were sorted by flow cytometry using a FACS Aria (BD). 1 × 10⁶ cells were lysed using Trizol reagent (Fisher 15596-018) and total RNA was isolated as recommended. RNA quality was determined by NanoDrop (Thermo Fisher) and Bioanalyzer chip (Agilent, 5067-1511). Subsequently, 1μg of RNA was used for polyA enrichment and Next Generation Sequencing (NGS) library preparation using a SENSE mRNA-Seq library prep kit V2 (Lexogen, 001.24) according to the manufacturer’s recommendations. The library was subjected to high-throughput sequencing single-end 50 bp on an Illumina HiSeq 2500 platform at the NGS unit of the Vienna BioCenter Core Facilities (VBCF) (http://vbcf.ac.at). The reads obtained from the instrument were base called using the instrument manufacturer’s base calling software. Demultiplexing was performed using Illumina2bam (http://gq1.github.io/illumina2bam/). The reads were aligned against the Homo sapiens reference genome (UCSC hg19 release) with STAR version 2.5.1b using the 2-pass alignment mode and reads mapping to ribosomal RNAs were removed. We obtained more than 80% uniquely mapped reads in each sample. After alignment, the reads were associated with known genes based on annotations derived from UCSC and the number of reads aligned within each gene was counted using the HTSeq tool (version 0.5.4p3). Counts were normalized using the TMM normalization method of the edgeR R/Bioconductor package (R version 3.3.1, Bioconductor version 3.3). Differential expression analysis was performed using Deseq2 (v. 1.10.1) on data normalized to effective library size using an adjusted p-value cutoff of 0.05 as previously described [36]. mRNAseq data are available under GEO accession number GSE107932.
Statistical analyses
GraphPad Prism was used to calculate statistics.Two-tailed student’s t-test, two-tailed Mann Whitney U test, and one-way ANOVA were performed as indicated in the figure legends. In this study, a p-value of < 0.05 was considered statistically significant. All values are represented as mean ± SD unless otherwise indicated.
Abbreviations
ATP: Adenosine triphosphate; AKT: AKT Serine/Threonine Kinase 1; BFP: Blue fluorescent protein; ECAR: Extracellular acidification rate; GFP: Enhanced green fluorescent protein; ERK: Extracellular signal-regulated kinase; Dox: Doxycycline; GBM: Glioblastoma multiforme; GO: Gene ontology; GSEA: Gene Set Enrichment Analysis; IκBα: Inhibitor of κB; iRFP: Infra-red fluorescent protein; lncRNA: Long non-coding RNA; mAb: Monoclonal antibody; NFκB: Nuclear factor κB; NS2A: Non-structural protein 2A; NT: Non-targeting shRNA; OCR: Oxygen consumption rate; PI: Propidium iodide; PKC: Protein kinase C; PTEN: Phosphatase and tensin homolog; RING: Really Interesting New Gene; RT-qPCR: Reverse transcription, quantitative polymerase chain reaction; shRNA: Short-hairpin RNA; T52-1/T52-2: TRIM52-targeting shRNA; TNF: Tumor necrosis factor; TP53: Tumor protein p53; TRIM: Tripartite motif protein; UTR: Untranslated region.
Author contributions
SB was involved in planning and experimental work for all aspects of the study. BA, MS, LH, AL, LG, IK, SS, were involved in planning and experimental work for part of the study. WB, AB, and ACO were involved in planning and conception of part of the study. GAV was involved in planning and conception of all aspects of the study. GAV wrote the manuscript.
ACKNOWLEDGMENTS
We thank Manuela Baccarini and Luisa Cochella for feedback on the manuscript. Glioblastoma cell model establishment was kindly performed by Sabine Spiegl-Kreinecker (Neuromed Campus, Kepler University Clinic, Linz) and Daniela Lötsch (Institute of Cancer Research, Medical University of Vienna). We thank Sasha Mendjan and Axel Pilz for their technical expertise and help for culturing human ES cell lines (IMBA, Vienna, Austria). We are grateful to Veronica Krenn and Jürgen Knoblich (IMBA, Vienna, Austria) for providing human cerebral organoid material. We thank Johannes Zuber (IMP, Vienna, Austria) for providing lenti- and retroviral vectors and advice on their use.
CONFLICTS OF INTEREST
The authors declare no competing financial interests.
FUNDING
S. Benke was supported by a Uni:Docs fellowship of the University of Vienna. W. Berger was supported by the Jubiläumsfonds of the Austrian National Bank (project number 16130). A. Bergthaler was supported by the Austrian Academy of Sciences. G.A. Versteeg was supported by stand-alone grants #30231 and #30415, and the ‘Signaling Mechanisms in Cellular Homeostasis’ doctoral program, all funded by the Austrian Science Foundation (FWF). Basic research at the IMP is supported by Boehringer Ingelheim GmbH and the Austrian Research Promotion Agency (FFG).
REFERENCES
1. Deshaies RJ, Joazeiro CA. RING domain E3 ubiquitin ligases. Annu Rev Biochem. 2009; 78:399–434. https://doi.org/10.1146/annurev.biochem.78.101807.093809.
2. Alvarez SE, Harikumar KB, Hait NC, Allegood J, Strub GM, Kim EY, Maceyka M, Jiang H, Luo C, Kordula T, Milstien S, Spiegel S. Sphingosine-1-phosphate is a missing cofactor for the E3 ubiquitin ligase TRAF2. Nature. 2010; 465:1084–8. https://doi.org/10.1038/nature09128.
3. Malfavon-Borja R, Sawyer SL, Wu LI, Emerman M, Malik HS. An evolutionary screen highlights canonical and noncanonical candidate antiviral genes within the primate TRIM gene family. Genome Biol Evol. 2013; 5:2141–54. https://doi.org/10.1093/gbe/evt163.
4. Watanabe M, Hatakeyama S. TRIM proteins and diseases. J Biochem (Tokyo). 2017; 161:135–44. https://doi.org/10.1093/jb/mvw087.
5. Chen D, Gould C, Garza R, Gao T, Hampton RY, Newton AC. Amplitude control of protein kinase C by RINCK, a novel E3 ubiquitin ligase. J Biol Chem. 2007; 282:33776–87. https://doi.org/10.1074/jbc.M703320200.
6. Yang W, Xia Y, Cao Y, Zheng Y, Bu W, Zhang L, You MJ, Koh MY, Cote G, Aldape K, Li Y, Verma IM, Chiao PJ, et al. EGFR-induced and PKCε monoubiquitylation-dependent NF-κB activation upregulates PKM2 expression and promotes tumorigenesis. Mol Cell. 2012; 48:771–84. https://doi.org/10.1016/j.molcel.2012.09.028.
7. Fan W, Wu M, Qian S, Zhou Y, Chen H, Li X, Qian P. TRIM52 inhibits Japanese Encephalitis Virus replication by degrading the viral NS2A. Sci Rep. 2016; 6: 33698. https://doi.org/10.1038/srep33698.
8. Fan W, Liu T, Li X, Zhou Y, Wu M, Cui X, Chen H, Qian P. TRIM52: A nuclear TRIM protein that positively regulates the nuclear factor-kappa B signaling pathway. Mol Immunol. 2017; 82:114–22. https://doi.org/10.1016/j.molimm.2017.01.003.
9. Hart T, Chandrashekhar M, Aregger M, Steinhart Z, Brown KR, MacLeod G, Mis M, Zimmermann M, Fradet-Turcotte A, Sun S, Mero P, Dirks P, Sidhu S, et al. High-Resolution CRISPR Screens Reveal Fitness Genes and Genotype-Specific Cancer Liabilities. Cell. 2015; 163:1515–26. https://doi.org/10.1016/j.cell.2015.11.015.
10. Wang T, Birsoy K, Hughes NW, Krupczak KM, Post Y, Wei JJ, Lander ES, Sabatini DM. Identification and characterization of essential genes in the human genome. Science. 2015; 350:1096–101. https://doi.org/10.1126/science.aac7041.
11. Blomen VA, Májek P, Jae LT, Bigenzahn JW, Nieuwenhuis J, Staring J, Sacco R, van Diemen FR, Olk N, Stukalov A, Marceau C, Janssen H, Carette JE, et al. Gene essentiality and synthetic lethality in haploid human cells. Science. 2015; 350:1092–6. https://doi.org/10.1126/science.aac7557.
12. O’Neil NJ, Bailey ML, Hieter P. Synthetic lethality and cancer. Nat Rev Genet. 2017; 18:613–23. https://doi.org/10.1038/nrg.2017.47.
13. Fellmann C, Hoffmann T, Sridhar V, Hopfgartner B, Muhar M, Roth M, Lai DY, Barbosa IA, Kwon JS, Guan Y, Sinha N, Zuber J. An optimized microRNA backbone for effective single-copy RNAi. Cell Rep. 2013; 5:1704–13. https://doi.org/10.1016/j.celrep.2013.11.020.
14. Crowley LC, Chojnowski G, Waterhouse NJ. Measuring the DNA Content of Cells in Apoptosis and at Different Cell-Cycle Stages by Propidium Iodide Staining and Flow Cytometry. Cold Spring Harb Protoc. 2016; 2016: pdb.prot087247. https://doi.org/10.1101/pdb.prot087247.
15. Uchil PD, Hinz A, Siegel S, Coenen-Stass A, Pertel T, Luban J, Mothes W. TRIM protein-mediated regulation of inflammatory and innate immune signaling and its association with antiretroviral activity. J Virol. 2013; 87:257–72. https://doi.org/10.1128/JVI.01804-12.
16. Shostak K, Chariot A. EGFR and NF-κB: partners in cancer. Trends Mol Med. 2015; 21:385–93. https://doi.org/10.1016/j.molmed.2015.04.001.
17. McCubrey JA, Steelman LS, Chappell WH, Abrams SL, Wong EW, Chang F, Lehmann B, Terrian DM, Milella M, Tafuri A, Stivala F, Libra M, Basecke J, et al. Roles of the Raf/MEK/ERK pathway in cell growth, malignant transformation and drug resistance. Biochim Biophys Acta. 2007; 1773:1263–84. https://doi.org/10.1016/j.bbamcr.2006.10.001.
18. Liu T, Ren D, Zhu X, Yin Z, Jin G, Zhao Z, Robinson D, Li X, Wong K, Cui K, Zhao H, Wong ST. Transcriptional signaling pathways inversely regulated in Alzheimer’s disease and glioblastoma multiform. Sci Rep. 2013; 3: 3467. https://doi.org/10.1038/srep03467.
19. Xie Q, Mittal S, Berens ME. Targeting adaptive glioblastoma: an overview of proliferation and invasion. Neuro-Oncol. 2014; 16:1575–84. https://doi.org/10.1093/neuonc/nou147.
20. Woodsmith J, Jenn RC, Sanderson CM. Systematic analysis of dimeric E3-RING interactions reveals increased combinatorial complexity in human ubiquitination networks. Mol Cell Proteomics. 2012; 11: M111.016162. https://doi.org/10.1074/mcp.M111.016162.
21. Levine AJ, Puzio-Kuter AM. The control of the metabolic switch in cancers by oncogenes and tumor suppressor genes. Science. 2010; 330:1340–4. https://doi.org/10.1126/science.1193494.
22. Ekshyyan O, Anandharaj A, Nathan CA. Dual PI3K/mTOR inhibitors: does p53 modulate response? Clin Cancer Res. 2013; 19:3719–21. https://doi.org/10.1158/1078-0432.CCR-13-1291.
23. Puzio-Kuter AM. The Role of p53 in Metabolic Regulation. Genes Cancer. 2011; 2:385–91. https://doi.org/10.1177/1947601911409738.
24. Zheng H, Ying H, Yan H, Kimmelman AC, Hiller DJ, Chen AJ, Perry SR, Tonon G, Chu GC, Ding Z, Stommel JM, Dunn KL, Wiedemeyer R, et al. p53 and Pten control neural and glioma stem/progenitor cell renewal and differentiation. Nature. 2008; 455:1129–33. https://doi.org/10.1038/nature07443.
25. Bleau AM, Hambardzumyan D, Ozawa T, Fomchenko EI, Huse JT, Brennan CW, Holland EC. PTEN/PI3K/Akt pathway regulates the side population phenotype and ABCG2 activity in glioma tumor stem-like cells. Cell Stem Cell. 2009; 4:226–35. https://doi.org/10.1016/j.stem.2009.01.007.
26. Boscá L, Corredor C. Is phosphofructokinase the rate-limiting step of glycolysis? Trends Biochem Sci. 9:372–3. https://doi.org/10.1016/0968-0004(84)90214-7.
27. Kawauchi K, Araki K, Tobiume K, Tanaka N. p53 regulates glucose metabolism through an IKK-NF-kappaB pathway and inhibits cell transformation. Nat Cell Biol. 2008; 10:611–8. https://doi.org/10.1038/ncb1724.
28. Vousden KH, Lane DP. p53 in health and disease. Nat Rev Mol Cell Biol. 2007; 8:275–83. https://doi.org/10.1038/nrm2147.
29. Yeung SJ, Pan J, Lee MH. Roles of p53, MYC and HIF-1 in regulating glycolysis - the seventh hallmark of cancer. Cell Mol Life Sci. 2008; 65:3981–99. https://doi.org/10.1007/s00018-008-8224-x.
30. Spiegl-Kreinecker S, Pirker C, Marosi C, Buchroithner J, Pichler J, Silye R, Fischer J, Micksche M, Berger W. Dynamics of chemosensitivity and chromosomal instability in recurrent glioblastoma. Br J Cancer. 2007; 96:960–9. https://doi.org/10.1038/sj.bjc.6603652.
31. Lancaster MA, Knoblich JA. Generation of cerebral organoids from human pluripotent stem cells. Nat Protoc. 2014; 9:2329–40. https://doi.org/10.1038/nprot.2014.158.
32. Versteeg GA, Rajsbaum R, Sánchez-Aparicio MT, Maestre AM, Valdiviezo J, Shi M, Inn KS, Fernandez-Sesma A, Jung J, García-Sastre A. The E3-ligase TRIM family of proteins regulates signaling pathways triggered by innate immune pattern-recognition receptors. Immunity. 2013; 38:384–98. https://doi.org/10.1016/j.immuni.2012.11.013.
33. Sarbassov DD, Guertin DA, Ali SM, Sabatini DM. Phosphorylation and regulation of Akt/PKB by the rictor-mTOR complex. Science. 2005; 307:1098–101. https://doi.org/10.1126/science.1106148.
34. Watson JV, Chambers SH, Smith PJ. A pragmatic approach to the analysis of DNA histograms with a definable G1 peak. Cytometry. 1987; 8:1–8. https://doi.org/10.1002/cyto.990080101.
35. Lee DF, Su J, Sevilla A, Gingold J, Schaniel C, Lemischka IR. Combining competition assays with genetic complementation strategies to dissect mouse embryonic stem cell self-renewal and pluripotency. Nat Protoc. 2012; 7:729–48. https://doi.org/10.1038/nprot.2012.018.
36. Anders S, McCarthy DJ, Chen Y, Okoniewski M, Smyth GK, Huber W, Robinson MD. Count-based differential expression analysis of RNA sequencing data using R and Bioconductor. Nat Protoc. 2013; 8:1765–86. https://doi.org/10.1038/nprot.2013.099.