
INTRODUCTION
Cancer represents the second leading cause of morbidity worldwide. GLOBOCAN 2012 estimated 14.1 million new cancer cases and 8.2 million cancer deaths occurred in 2012 across the globe. Among these, colorectal cancer (CRC) comprises the third most common cancer with 1.4 million new cases and was responsible for 693,900 deaths in 2012, with higher mortality rate in males compared to females [1, 2]. The most common treatment for localized CRC is surgical removal; however, patients with CRC often presented with metastatic disease or exhibit high probability of developing disseminated disease during their lifetime [3]. Consistent with this, the leading cause of CRC mortality is the failure of most therapies in patients with metastatic disease. To reduce mortality from CRC, it is therefore important to develop novel approaches based on the cellular and molecular phenotyping of CRC. Notably, our previous study has revealed multiple deregulated signalling pathways in CRC and suggested targeting those networks as a potential therapeutic strategy for CRC [4].
Treatment choices for patients with CRC assume homogeneity in tumour mass; therefore it is plausible that conventional chemotherapy and radiotherapy sometimes fail in tumour eradication. Alternatively, several studies have demonstrated that solid tumours including CRC exhibit cellular heterogeneity [5, 6], which may reflect different origin of cells at the time of tumour origination [7]. Furthermore, recently the presence within solid tumours of a minor subset of cells termed cancer stem-like cells (CSCs) or tumour-initiating cells (TICs), which exhibit self-renewal and differentiation capabilities, has been demonstrated and suggested to be responsible for tumour maintenance, metastasis and drug resistance [6, 8, 9]. Although normal tissue stem cells (SCs) and CSCs share certain characteristics, they exhibit significant differences in their differentiation potential and their microenvironmental niches [10, 11].
A number of surface markers e.g. CD133 (prominin-1), CD44, and CD29 have been reported as potential markers for different types of CSCs [8]; however, these CD antigens also exist on normal stem cells and thus are of low specificity [12, 13]. In particular, aldehyde dehydrogenase 1 (ALDH1) has been reported as a marker for CSCs in a number of cancers [14, 15]. While there are three different isoforms for ALDH1 (ALDH1A1, ALDH1A2, and ALDH1A3), ALDH1 activity is predominantly attributed to ALDH1A1 isotype [11]. ALDH1A1-expressing CSCs from breast, lung, head and neck squamous cancer, possess tumour-initiating capabilities, suggesting a role in supporting tumour proliferation and maintenance [16–18]. The relevance of CSCs in cancer has been demonstrated in studies aimed at targeting CSC subpopulations and their signalling pathways [6, 9, 19]. In one study, patients with rectal adenocarcinoma (n = 64) who received preoperative radiochemotherapy showed high expression levels of different CSC markers—CD44, LGR5, CD166, and ALDH1—by immunostaining; additionally, in a Cox proportional hazards multiple regression model, ALDH1 independently predicted poor prognosis in patients with CRC who received radiochemotherapy [20].
Although CSCs have been identified in many different types of solid tumours, the identity of ALDH+ CSCs and their molecular signature as well as their clonogenic and drug resistance properties are poorly characterized. In the current study, we utilized fluorescence activated cell sorting (FACS) and isolated the ALDH1+ and ALDH1− populations from the SW403 CRC cell model, characterised their molecular and functional phenotype, and subsequently validated these in additional CRC cell models. Our data identified several preferentially activated signalling pathways in ALDH1+ cells related to drug resistance with potential therapeutic implications that correlated with CRC prognosis.
RESULTS
Functional and molecular characterisation of an ALDH+ population in CRC SW403 cells.
We employed the SW403 cell line as a cell model for CRC and assessed the expression of several colorectal CSC-associated markers [8] (Supplementary Figure 1). The cells exhibited heterogeneous expression of ALDH (7%), LGR5 (4%), and CD90 (3%), whereas CD133 (99%), EpCAM (100%), CD44 (100%), and CD29 (100%) were expressed by the whole cell population. The SW403 cells were CD24− (0%). The frequency of the ALDH+ population in SW403 cells was determined using an Aldefluor assay. As shown in Figure 1A, approximately 7% of the cells were ALDH+, which decreased to <1% in the presence of diethylaminobenzaldehyde (DEAB) (an ALDH inhibitor). Subsequently, we sorted both ALDH+ and ALDH− cell fractions using FACS. The purity of sorted cells was analysed by Aldefluor assay, which revealed more than 99% purity in the ALDH+ fraction, whereas the sorted ALDH− fraction showed minimal ALDH activity of <1.4% (Figure 1B). Further analysis demonstrated that the percentage of proliferating cells was higher in ALDH+ cells (day 6: 154% vs 100% and day 10: 124% vs 100%) compared to ALDH− cells, p < 0.0005 (Figure 1C). This decrease in relative proliferation rate between day 10 and day 6 could possibly be attributed to the re-expression of ALDH by ALDH- fraction in culture (Supplementary Figure 2). Concordantly, the number of colonies formed in the ALDH+ fraction was higher than that observed in the ALDH– fraction (Figure 1D and 1E). Taken together, our data demonstrated higher proliferation and clonogenic capability of the ALDH+ cells. We observed significant increase in a number of stem cell associated gene markers: KL4, BAX, PCNA, SMOC2, KITLG, NANOG, KLF5, and BST and decrease in the expression of CD133, CDH1, SOX4, and SOX2 in ALDH+ compared to ALDH− cells (Supplementary Figure 3). The expression of PLAU, SNAI1, BMI1, and LGR5 did not show significant change in ALDH+ compared to ALDH− cells.
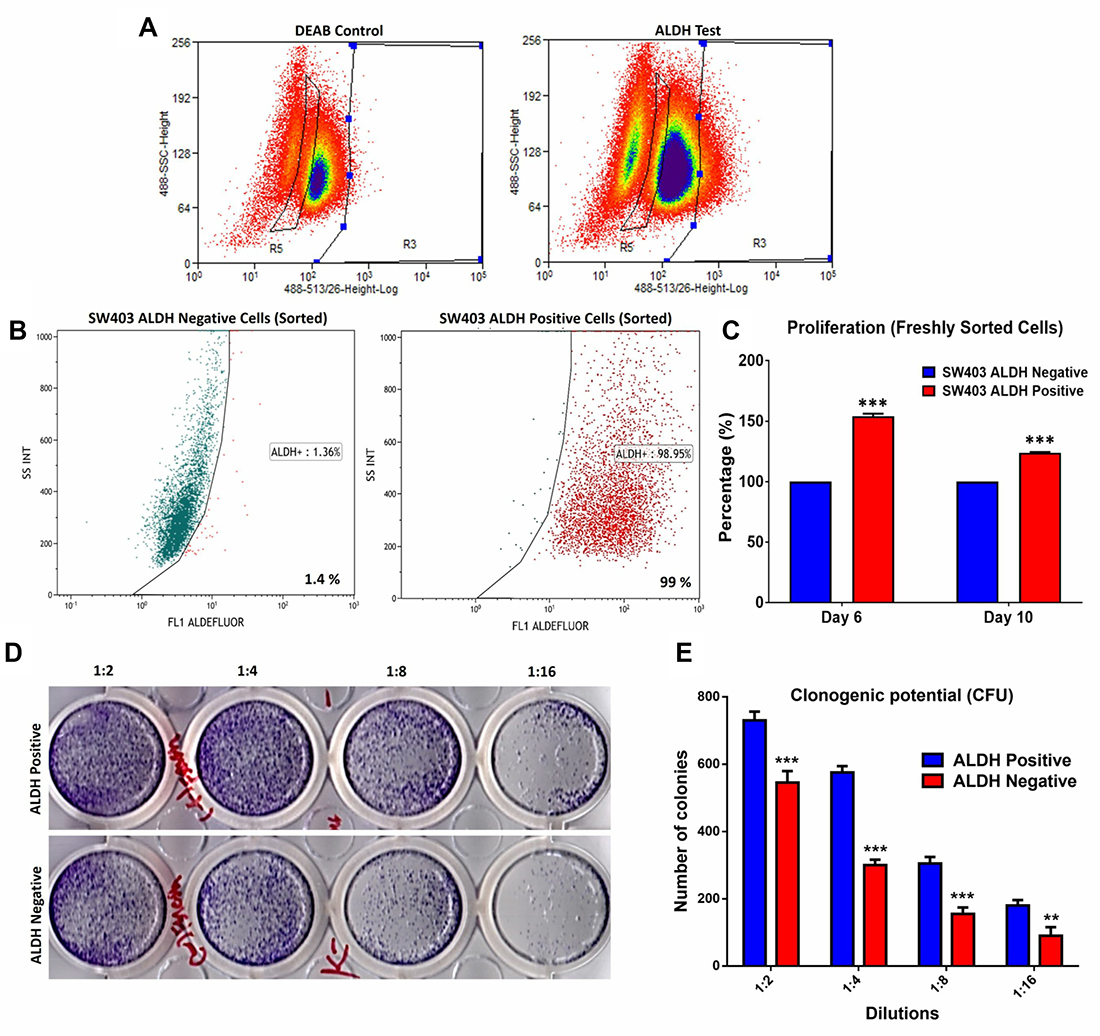
Figure 1: Proliferation and clonogenic potential of colorectal cancer ALDH+ cells. (A) Frequency of ALDH+ cells in the SW403 CRC model measured using the Aldefluor® assay and flow cytometry. The shift of fluorescence defined the population in R3 (Right panel) presenting positive ALDH1 activity and in R5 presenting Negative ALDH1 activity. The highly positive sub-population (~5%) and ALDH− cells were collected using the Astrios® cell sorter. (B) Purity assessment was performed on sorted ALDH+ positive and negative subpopulations using the Aldefluor assay where the percentage of ALDH+ was ~99% compared to the negative fraction ~1.4%. (C) Proliferation of ALDH+ positive cells compared to ALDH− cells over time. (D and E) Clonogenic assay showing marked increase in the colony forming capability of ALDH+ compared to ALDH− cells. Plates were stained with Diff-Quik stain set on day 10. Wells are representative of two independent experiments for each condition. (e) The two-tailed t-test was used to compare different groups. **p < 0.005; ***p < 0.0005.
Global gene expression profiling reveals a distinct molecular profile of ALDH+ cells
We subsequently performed global mRNA expression profiling comparing ALDH+ to ALDH− cells. As shown in Figure 2A, hierarchical clustering based on differentially expressed mRNAs revealed clear separation of ALDH+ from ALDH− cells. We observed 1015 up-regulated and 1906 downregulated transcripts in ALDH+ cells compared to ALDH− cells (Supplementary Table 1). The distribution of the top 20 enriched pathways for the up-regulated genes in ALDH+ cells is shown in Figure 2B. Among the highly enriched pathways were: DNA damage and oxidative stress response, MAPK, FAK, and Wnt signalling, and pluripotency. The expression levels of a selected group of genes related to Cell cycle, DNA damage, oxidative stress, Wnt and apoptosis pathways including CDC25B, CCND3, ATM, TP53AIP1, SOD3, CYP1A1, and POU5F1 were validated using quantitative reverse transcription polymerase chain reaction (qRT-PCR) analysis (Figure 2C).
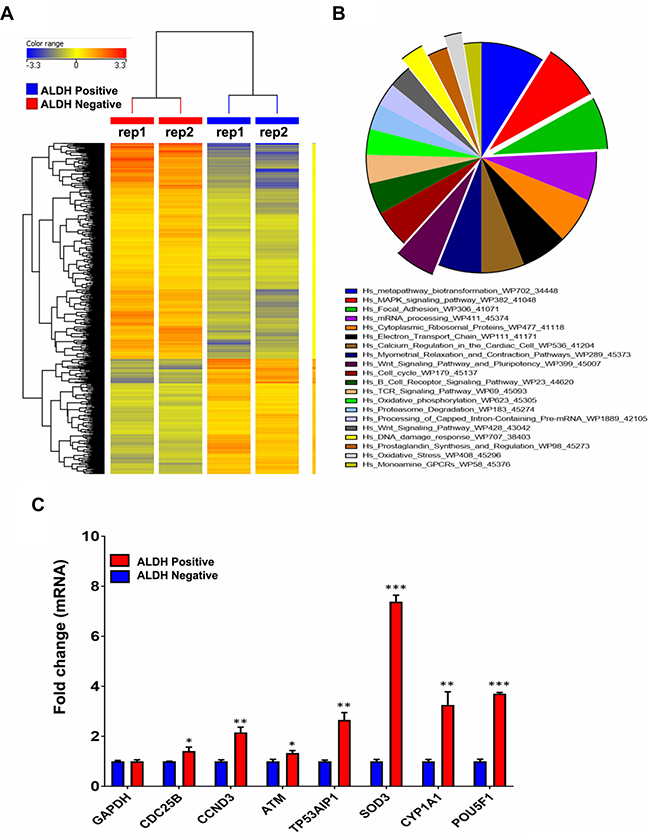
Figure 2: Preferential activation of multiple signalling pathways in ALDH+ cells. (A) Hierarchical clustering of ALDH+ vs ALDH− subpopulations based on differentially expressed mRNA levels. Each column represents one replica and each row represents a transcript. Expression level of each gene in a single sample is depicted according to the colour scale. (B) Pie chart illustrating the distribution of the top 20 pathways designations for the differentially expressed genes in ALDH+ cells. The pie size corresponds to the number of matched entities. (C) Expression levels of selected genes from the microarray data were validated using qRT-PCR in ALDH1+ compared to ALDH− cells. Data are presented as the means ± S.D, n = 3. *p < 0.05; **p < 0.005; ***p < 0.0005.
ALDH+ cells exhibit enhanced resistance to 5-Fluorouracil (5-FU) drug treatment
Microarray data revealed enrichment in DNA damage and oxidative stress response pathways in ALDH+ cells; thus, we hypothesized that ALDH+ cells exhibit enhanced resistance to 5-FU, a chemotherapeutic drug frequently used to treat patients with CRC. 5-FU treatment of SW403 cells led to a dose-dependent increase in the percentage of ALDH+ cells from 7% in controls to 24% at a concentration of 12.5 μM (Figure 3A and 3B). In addition, as shown in Figure 3C, the acridine orange/ethidium bromide (AO/EtBr) assay revealed a higher percentage of cell death (apoptosis and necrosis) in the ALDH1− compared to the ALDH1+ fraction in the SW403 model in response to 5-FU (1.25 and 2.5 μM) treatment. To extrapolate our findings to additional colorectal cancer cell models, a panel of colorectal cancer cell lines: COLO320, HT29, HCT116, and SW620 were exposed to different concentrations of 5-FU for 5 days at a concentration of 6.2 and 12.5 μM and the percentages of ALDH+ cells were determined using the Aldefluor assay. As shown in Figure 4A and 4B, significant increases in the percentages of ALDH+ population were observed in the HCT116 (Control: 22%; 6.2 μM: 22.5%; 12.5 μM: 32%) and SW620 (Control: 4%; 6.2 μM: 8%; 12.5 μM: 8%) cells, whereas there were no significant changes in the percentage of ALDH+ population within the COLO320 and HT29 models following 5-FU treatment. Therefore, it is plausible that 5-FU treatment targets mainly the ALDH− population, which leads to an increase in the ALDH+ fraction post-treatment.
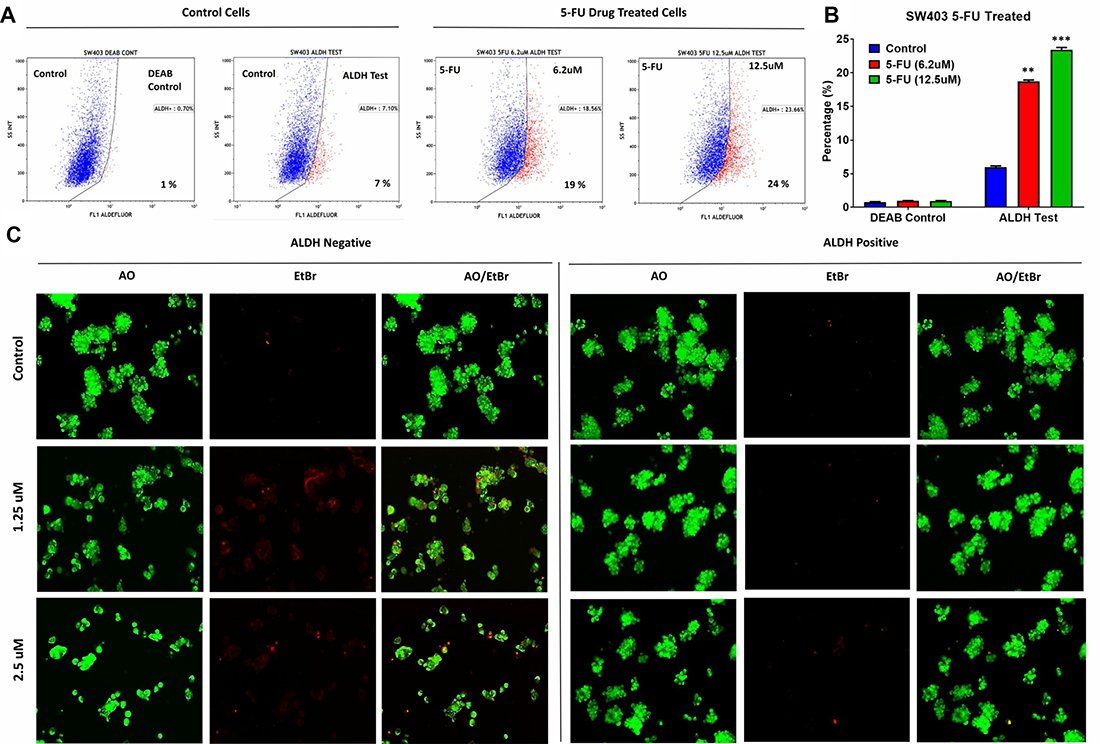
Figure 3: ALDH+ cells show enhanced resistance to 5-fluorouracil. (A) Unsorted SW403 cells were exposed to 5-FU for 5 days, and subsequently the frequencies of ALDH+ cells were assessed using the Aldefluor assay, which revealed a dose-dependent increase in the proportion of ALDH+ cells (Control (7%), 5-Fu treated at 6.2 μM (19%), 12.5 μM (24%), and 25 μM (22%)), respectively. Experiments were normalized to the respective DEAB controls. (B) Quantification of the percentages of ALDH+ cells from (a). The two-tailed t-test was used to compare different treatment groups. **p < 0.005.; ***p < 0.0005. (C) Representative fluorescence images of sorted ALDH+ and ALDH− subpopulations [± different concentration (1.25 μM and 2.5 μM) 5-fluorouracil]. Cells were stained with acridine orange/ethidium bromide to detect apoptotic (cells with green condensed chromatin) and necrotic cells (red).
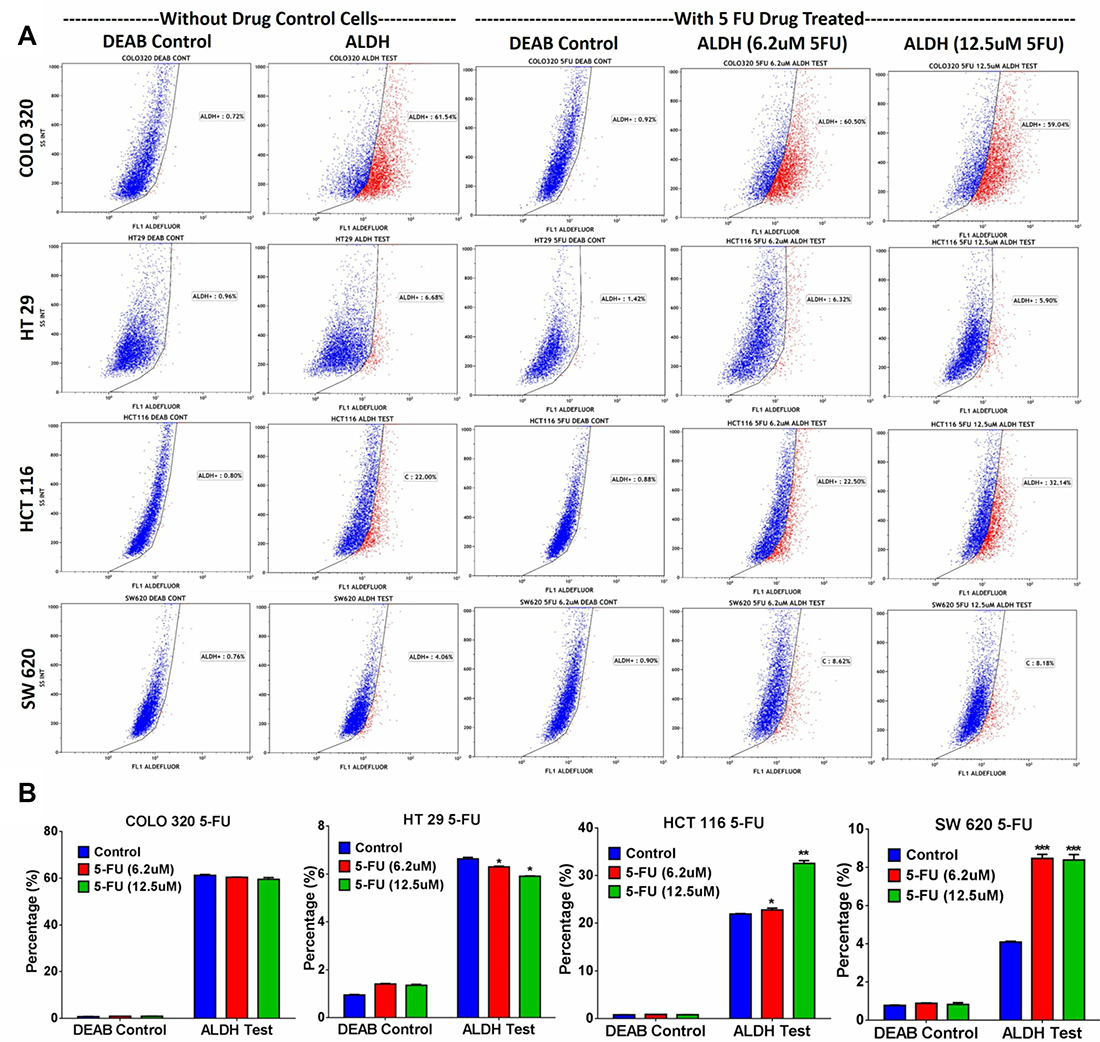
Figure 4: ALDH+ fraction is more resistant to 5-FU in multiple CRC models. Drug sensitivity and enrichment analysis of ALDH+ populations in different CRC cell lines. (A) Different adenocarcinoma clones of CRC cell lines (COLO320, HT29, HCT116, and SW620) were treated with 5-FU for 5 days using different concentrations (6.2 μM and 12.5 μM), and subsequently the cells were stained with the Aldefluor assay to determine the frequencies of ALDH+ cells in 5-FU treated vs non-treated cells. Experiments were normalized with respective DEAB controls. (B) The two-tailed t-test was used to compare different treatment groups. *p < 0.05; **p < 0.005; ***p < 0.0005.
Inhibition of MAPK and FAK signalling pathways reduces the ALDH1+ cell fraction in the SW403 cell line
In addition to DNA damage and oxidative stress pathways, ALDH+ cell molecular signature revealed significant enrichment in genes within the MAPK and FAK signalling pathways (Figure 2B). Illustration of the FAK and MAPK pathways are shown with matched entities highlighted in Supplementary Figures 4 and 5, respectively. These data suggested a plausible role for MAPK and FAK signalling pathways in maintaining the ALDH+ population. SW403 cells were treated with MAPK (5 μM; PD98059) and FAK (5 μM; PF573228) small molecule inhibitors, and the ALDH1+ cell fraction was determined on day 5 post-treatment. As shown in Figure 5A and 5B, significant decreases in the ALDH1+ population were observed in both MAPK (1%) and FAK (3.4%) inhibitor-treated cells, compared to the dimethyl sulphoxide (DMSO) control (7%), suggesting a role for these two pathways in maintaining the CRC ALDH+ population. Whether MAPK/FAK inhibition promotes ALDH+ cell death or reduced ALDH expression remains to be investigated.
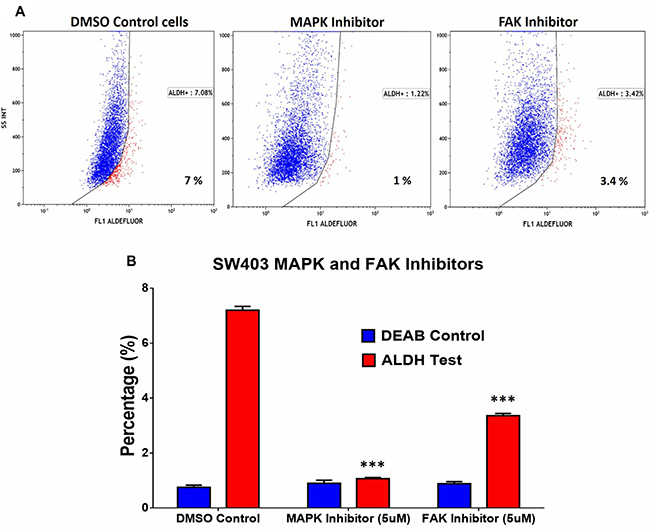
Figure 5: Pharmacological inhibition of MAPK and FAK significantly abrogates the ALDH+ population in the SW403 CRC model. (A) Inhibition of MAPK ((5 μM, PD98059; Sigma; middle panel) or FAK ((5 μM, PF-573228; Sigma; right panel) for 5 days reduces the proportion of ALDH+ cells in the SW403 model. (B) Quantitative analysis of the frequencies of ALDH+ cells from (a). The two-tailed t-test was used to compare the treatment group with the respective control. ***p < 0.0005.
ALDH1+ cells are more resistant to oxidative stress compared to ALDH1− cells
Hydrogen peroxide (H2O2) is a non-radical reactive oxygen species (ROS) that can activate nuclear transcription factors, such as NF-κB, p53, and AP-1 leading to the induction of pro-apoptotic or inhibitor of survival proteins [21]. The oxidative stress pathway is illustrated with matched entities highlighted in Figure 6A. As we found that the oxidative stress pathway was one of the top enriched pathways in ALDH1+ cells (Figure 2B), we examined the effect of ROS on the ALDH+ cell fraction in SW403 cells following exposure to H2O2 (50 μM) for 5 days. Our data revealed a significant increase in the ALDH+ fraction (14% ALDH+) compared to the control cells (7% ALDH+), suggesting that ALDH+ cells are more capable of surviving ROS-mediated oxidative stress (Figure 6B).
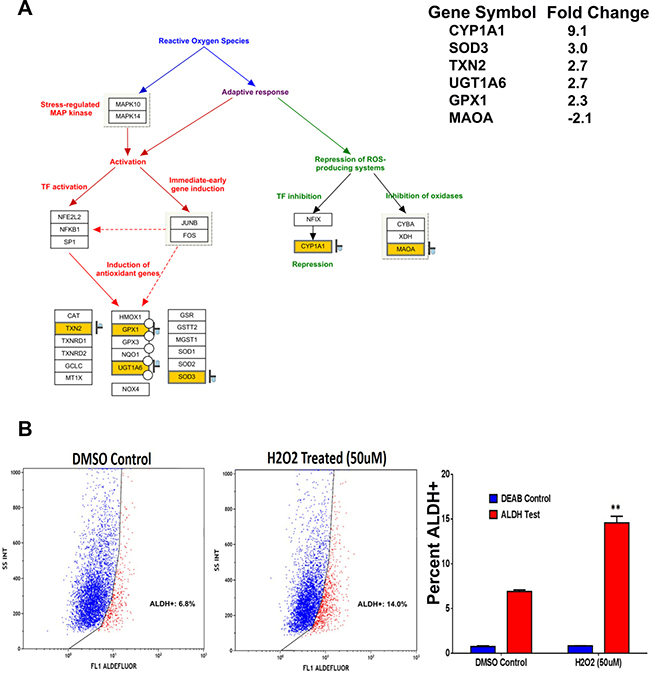
Figure 6: ALDH+ cells exhibit enhanced resistance to oxidative stress. (A) Illustration of the oxidative stress pathway with matched entities highlighted and fold change in ALDH+ vs ALDH- indicated. (B) Significant increase in the frequencies of ALDH+ positive population in the SW403 cell line was observed post-exposure to H2O2 (50 μM). Quantitate analysis of the frequencies of ALDH+ cells is shown in the right panel. Data are presented as the means ± S.D. Two-tailed t-test was used to compare treatment groups. **p < 0.005.
ALDH1 expression is a possible prognostic marker for CRC
To assess the clinical relevance of our findings, we examined the expression of ALDH1A1 and POU5F1 in a cohort of 462 patients for overall survival (OS) or 420 patients for disease-free survival (DFS), obtained from the Cancer Genome Atlas CRC data set [22]. As shown in Figure 7, a strong association between elevated expression of ALDH1A1 or/and POU5F1 and poor OS (p = 0.006) and poor DFS (p = 0.05) was observed.
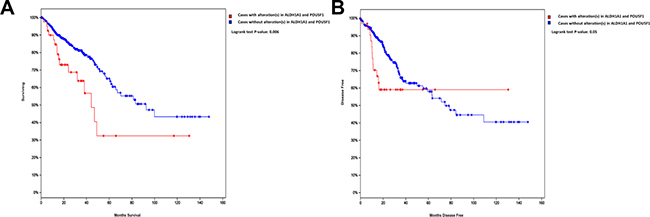
Figure 7: Altered expression of ALDH1A1 or POU5F1 is associated with poor OS and DFS in CRC. Kaplan–Meier curves illustrate the duration of OS (A) or DFS (B) according to the expression of ALDH1A1 and POU5F1 in a cohort of 462 patients (for OS) or 420 patients (for DFS) from the TCGA colorectal cancer dataset. Using log-rank analysis; the expression of ALDH1A1 or/and POU5F1 was associated with poor OS (p = 0.006) and DFS (p = 0.05).
DISCUSSION
CSCs have been identified in a number of solid tumours including breast, colon, glioma, liver, lung, melanoma, ovarian, pancreatic, and prostate cancers. However, their biological relevance and functions within the tumour microenvironment remains under investigation and debate [8, 23]. The true identify of CSCs is also still uncertain, although a number of cellular proteins have been suggested as potential markers for CSCs [24]. Among these, CD133 (PROM1), and LGR5 have been suggested as potential markers for CRC CSCs [25, 26]. Notably, the frequencies of CD133+ or LGR5+ in CRC can reach >24%, which may question their specificity for identifying CSCs. ALDH, alternatively, has been suggested as a potential marker for normal colon as well as CRC SCs [27]. ALDH+ cells are few in number and limited to the normal crypt bottom, the expected location of SCs. An APC gene mutation that leads to epithelial development of adenoma is associated with increased number of ALDH1+ cells and their distribution beyond the crypt. Furthermore, ALDH1+ cells isolated from patients with CRC readily generated xenograft tumours with as low as 25 cells injected in vivo, whereas ALDH1− cells did not form tumours [27].
In the present study, we found a distinct molecular phenotype of ALDH+ cells, which suggests a number of biological characteristics relevant to understanding the biology of CRC and its response to therapy. Pathway analysis on the up-regulated genes in ALDH+ cells revealed significant enrichment in multiple signalling pathways including FAK, MAPK, DNA damage response, cell cycle, oxidative stress, and Wnt and pluripotency pathways. Concordant with the gene expression data, functional studies demonstrated a pivotal role for FAK and MAK signalling in the maintenance of ALDH+ cells. Some recent studies corroborate our findings. Blaj et al. demonstrated strong intra-tumoural heterogeneity with respect to activation of MAPK in CRC, with high MAPK activity restricted to the less-differentiated tumour cells located at the tumour leading edge [28]. Additionally, elevated expression of genes associated with MAPK and FAK signalling have been linked to epithelial-to-mesenchymal transition in CRC [29–32]. FAK is overexpressed and is activated in numerous advanced-stage solid tumours. In addition, FAK has been described as an important pathway in CSC self-renewal and cancer metastasis through both kinase-dependent and kinase-independent mechanisms [31]. In acute myeloid leukaemia, the FAK pathway regulates the expression of a number of cytokines (interleukin 6 (IL 6), IL 8, stromal cell-derived factor 1, and angiopoietin 1), which are crucial for CSCs maintenance [33]. In animal models, small-molecule FAK inhibitors reduce tumour angiogenesis and FAK inhibitors are being developed for a possible role in cancer therapy [34].
We observed that ALDH+ cells were more resistant to 5-FU treatment and ROS exposure than ALDH− cells in several CRC cell models: SW403, HCT116, and SW620, suggesting a possible role in mediating drug resistance. In other human cancer models, CD133 positive CSCs were reported to contribute to glioma radioresistance through preferential activation of the DNA damage checkpoint and an increase in DNA repair ability [35]. Similarly, Lim et al. confirmed that glioma CSCs play an important role in radioresistance through initiation of DNA damage checkpoint proteins including ATM, SMC1, Chk1, Chk2, and p53 and increased DNA repair [36]. In our study, we observed ALDH+ cells to highly express a pluripotency gene (POU5F1, also referred to as OCT4) and superoxide dismutase 3 (SOD3), suggesting a role for these two genes in driving stemness and promoting cell survival under various stress conditions in ALDH+ cells. Concordant with our data, Chiou et al. reported that co-expression of POU5F1 and Nanog could enhance the malignancy of lung adenocarcinoma through induction of CSC-like properties and epithelial mesenchymal transition [37]. Similarly, Kumar and colleagues showed that POU5F1 was able to promote dedifferentiation of melanoma cells into CSC-like cells [38]. Taken together, these findings clarify that POU5F1 plays a crucial role in maintaining the CSC phenotype in multiple human cancer types.
The 5-year survival rate for patients with CRC having a localized tumour is approximately 90%, which is reduced to 70% for patients presenting with regional disease, and to 12% for those with metastases [39]. Therefore, a significant number of patients with CRC do not appear to benefit from standard chemotherapy, in particular in metastatic disease. Our in vitro data suggest that the presence of ALDH+ cells might predict the response of CRC to therapy. A number of studies have examined the relevance of ALDH1A1 as a biomarker in CRC. Nuclear expression of ALDH1A1 in a small subpopulation of patients was associated with shortened survival [40]. In a recent retrospective study, immunohistochemical expression of ALDH1 in epithelial cells was associated with poor prognosis, whereas its expression in stromal cells was associated with good prognosis in CRC [41]. In another study, high ALDH1 expression was found as an independent prognostic factor associated with the 5-year OS and DFS and correlated with the tumor stage, lymph node status, and tumor differentiation [42]. These findings corroborate our findings of the association of ALDH1A1 expression with poor prognosis of the disease. Thus, our data revealed multiple enriched pathways within ALDH+ CRC cells that could potentially be targeted to eliminate the CSC population within the tumour, with the aim of treatment of disseminated disease and prevention of recurrences [9]. While the gene expression profiling and pathway data presented in current study were generated using the non-metastatic SW403 model, additional testing is needed to validate whether similar molecular signature also exists in metastatic colorectal cancer cell lines.
MATERIALS AND METHODS
Cells lines and tissue culture
The human colorectal cancer cell lines (SW403, COLO320, HT29, HCT116, and SW620) were obtained from American Type Culture Collection (ATCC, Manassas, VA, USA). Cells were maintained in Dulbecco’s modified Eagle’s medium supplemented with 10% foetal bovine serum (Gibco-Invitrogen, Waltham, MA, USA) and 100 mg/l penicillin/streptomycin. All cells were maintained in a 37° C incubator with humidified 5% CO2.
Immunophenotyping by flow cytometry (FACS)
Immunophenotypic analysis was performed in accordance with our previously published protocols [12]. In brief, SW403 cells were harvested using 0.05% trypsin-ethylenediaminetetraacetic acid and were washed twice in ice-cold phosphate buffered saline (PBS) supplemented with 0.5% bovine serum albumin and resuspended at 106 cells/ml. Then, 10 μl of FITC-conjugated mouse anti-human CD24 and CD90, PE-conjugated mouse anti-human CD44, CD29, and EpCAM, or APC-conjugated mouse anti-human CD133 and LGR5 antibodies (from BD Biosciences, San Jose, CA, USA, and Miltenyi Biotec, Bergisch-Gladbach, Germany) was added to 100 μl of cell suspension (105 cells). Negative control staining was performed using FITC, PE, or APC-conjugated mouse IgG1 isotype control antibodies, respectively. Cells were incubated for 30 min at 4° C in the dark, washed with PBS, resuspended in 500 μl of PBS, and analysed using a Navios flow cytometer (Beckman Coulter, Brea, CA, USA). Living cells were gated in a dot plot of forward vs. side scatter signals obtained on linear scale. At least 5000-gated events were acquired on a log fluorescence scale. Data were analysed using Kaluza software (1.2 version, Beckman Coulter).
Aldefluor assay and ALDH +/− cell sorting
Aldefluor assay was performed in accordance with our previously published protocols [43]. The Aldefluor kit (Stem Cell Technologies, Vancouver, BC, Canada) was used to determine the percentage of cells with high aldehyde dehydrogenase (ALDH) enzymatic activity. Briefly, 106 cells were resuspended in Aldefluor assay buffer containing ALDH substrate as recommended by the manufacturer. As a negative control for all samples, an aliquot of ‘Aldefluor-exposed’ cells was immediately quenched using the ALDH inhibitor DEAB. After 30 min of incubation at 37° C, the cells were centrifuged and resuspended in 500 μl Aldefluor buffer and analysed using a Navios flow cytometer. Aldefluor staining was detected within the green fluorescence channel FL1. Samples treated with the inhibitor DEAB (+DEAB) were used as controls to establish the gates defining the ALDH+ region. DMSO control cells were used as an experimental control to compare drug or inhibitor treated cells, respectively. Kaluza software (1.2 version) was used to analyse the data. ALDH+/− cells were collected using a MoFlo Astrios cell sorter (Beckman Coulter). The collected cells were directly used for further experiments.
Small molecule inhibitor experiments
Unsorted SW403 cells were exposed for 5 days to MAPK (5 μM; PD98059) and FAK (5 μM; PF573228) inhibitors, whereas oxidative stress was induced using H2O2 (50 μM). On day five, the cells were washed and the percentage of ALDH+ cells were analysed by the Aldefluor kit.
Gene expression microarray
RNA isolation and gene expression analyses were carried out as described in our previously published manuscripts [44, 45]. In brief, RNA was isolated using the Total Tissue RNA Purification Kit from Norgen-Biotek Corp. (Thorold, ON, Canada) and was quantified using NanoDrop 2000 (Thermo Scientific, Wilmington, DE, USA). Total RNA was labelled and then hybridized to the Agilent Human SurePrint G3 Human GE 8 × 60 k mRNA microarray chip (Agilent Technologies, Santa Clara, CA, USA). All microarray experiments were conducted at the Microarray Core Facility (Stem Cell Unit, Department of Anatomy, King Saud University College of Medicine). Data were subsequently normalized and analysed using GeneSpring 13.0 software (Agilent Technologies). Pathway analyses were conducted using the Single Experiment Pathway analysis feature in Gene Spring 13.0 (Agilent Technologies). Twofold cut-off with p < 0.02 was used.
Gene validation using qRT-PCR
Gene expression levels were validated in sorted SW403 ALDH+ and ALDH− cells using an RT-PCR assay as described previously [44]. In brief, SYBR Green-based qRT-PCR was performed using an Applied Biosystems ViiA 7 Detection system (Foster City, CA, USA). Then, 500 ng of total RNA was reverse transcribed using a High Capacity cDNA Reverse Transcript Kit (Part No: 4368814; ABI) according to the manufacturer’s protocol. Relative levels of mRNA were determined from cDNA using quantitative real-time PCR (Applied Biosystems ViiA 7 Systems). Primer sequences used in the current study are listed in Table 1. The expression level was calculated relative to GAPDH as a control.
Table 1: List of SYBR green primers used in current study
No |
Name |
Sequence |
|---|---|---|
1 |
GAPDH |
5¢ CTGGTAAAGTGGATATTGTTGCCAT |
5¢ TGGAATCATATTGGAACATGTAAACC |
||
2 |
CDC25B |
F 5¢ GCTCTCAGTCCAGCAGGC |
R 5¢ ACTCTTTGGGGTTTCGCTGC |
||
3 |
CCND3 |
5¢ GCCTCCTACTTCCAGTGCG |
5¢ CCTCACATACCTCCAGCATCC |
||
4 |
ATM |
5¢ TGCGTGGCTAACGGAGAAAA |
5¢ ATCACTGTCACTGCACTCGG |
||
5 |
TP53AIP1 |
5¢ CTGGCTGGGTTTCAGATCCC |
5¢ CAGGCAAGCTCTTACTGCAC |
||
6 |
SOD3 |
5¢ CTGGAAAGGTGCCCGACTC |
5¢ CTTGGCGTACATGTCTCGGA |
||
7 |
CYP1A1 |
5¢ CCCACAGCACAACAAGAGAC |
5¢ GGGTGAGAAACCGTTCAGGT |
||
8 |
POU5F1 |
5¢ TCTTCAGGAGATATGCAAAGCAGA |
5¢ GATCTGCTGCAGTGTGGGT |
Measurement of cell proliferation and clonogenic assay
The proliferation of sorted ALDH+ and ALDH− cells was determined using an Alamar Blue assay as previously described [4]. Briefly, 3000 cells were cultured in a 96-well plate and proliferation was measured at the indicated time points by adding 10% volume Alamar Blue assay reagent and measuring absorbance at 570 λ. The colony forming ability of both ALDH+ and ALDH− cells was determined using a clonogenic assay as previously described [44]. Briefly, both SW403 SW403 ALDH+ and ALDH− cells were seeded in 12-well plates in different serial dilution (1:2 to 1:16). Initial seeding density was 0.015 × 10⁶ cells per well, and plates were incubated at 37° C under 5% CO2 for 10 days. The plates were then washed and stained with Diff-Quik stain set (Siemens, Malvern, PA, USA), scanned, and the number of colonies was counted using Image-Pro Plus software (Media Cybernetics). The experiment was performed twice in duplicate. The fraction of surviving cells was estimated by comparing the number of colonies formed in ALDH+ to that in the ALDH− cells.
Measurement of apoptosis
A fluorescence-based apoptosis assay was employed in cells following exposure to different concentration of 5-Fluorouracil (2.5 to 1.25 μM), using the AO/EtBr staining method as previously described [44]. Briefly, cells were stained with dual fluorescent staining solution (1.0 μl) containing 100 μg/ml AO and 100 μg/ml EtBr (AO/EB, Sigma, St. Louis, MO, USA). Cells were gently mixed with AO/EtBr (1:100) dye solution for 1 min; afterwards, the cells were observed and photographed under a Nikon Eclipse Ti fluorescence microscope (Nikon, Tokyo, Japan). Cells cultured without drug treatment were considered control.
Statistical analysis
Statistical analyses and graphing were performed using Microsoft excel 2010 and GraphPad Prism 6.0 software (GraphPad, San Diego, CA, USA). P-values were calculated using a two-tailed t-test.
Abbreviations
CSCs: cancer stem cells; CRC: colorectal cancer; OS: overall survival; DFS: disease-free survival; ALDH1: aldehyde dehydrogenase 1; DEAB: diethylaminobenzaldehyde; qRT-PCR: quantitative reverse transcription polymerase chain reaction; DMSO: dimethyl sulphoxide; PBS: phosphate buffered saline.
Author contributions
RV: Collection and/or assembly of data, manuscript writing; MM: Collection and/or assembly of data; MF: Collection and/or assembly of data; RH: Collection and/or assembly of data; MA: Conception and design; AA: Conception and design; MK: Conception and design; NMA: Collection and/or assembly of data, Data analysis and interpretation, Manuscript writing, Final approval of manuscript, Obtained funding.
ACKNOWLEDGMENTS
We would like to thank the Deanship of Scientific Research at King Saud University (Research Group No. RG-1438-033) for funding this work.
CONFLICTS OF INTEREST
The authors declare no conflicts of interest.
FUNDING
Deanship of Scientific Research at King Saud University (Research Group No. RG-1438-033).
REFERENCES
1. Torre LA, Bray F, Siegel RL, Ferlay J, Lortet-Tieulent J, Jemal A. Global cancer statistics, 2012. CA Cancer J Clin. 2015; 65:87–108. https://doi.org/10.3322/caac.21262.
2. Ferlay J, Soerjomataram I, Dikshit R, Eser S, Mathers C, Rebelo M, Parkin DM, Forman D, Bray F. Cancer incidence and mortality worldwide: sources, methods and major patterns in GLOBOCAN 2012. Int J Cancer. 2015; 136:E359–86. https://doi.org/10.1002/ijc.29210.
3. Van Cutsem E, Nordlinger B, Cervantes A, Group EG. Advanced colorectal cancer: ESMO Clinical Practice Guidelines for treatment. Ann Oncol. 2010; 21:v93–97. https://doi.org/10.1093/annonc/mdq222.
4. Vishnubalaji R, Hamam R, Abdulla MH, Mohammed MA, Kassem M, Al-Obeed O, Aldahmash A, Alajez NM. Genome-wide mRNA and miRNA expression profiling reveal multiple regulatory networks in colorectal cancer. Cell Death Dis. 2015; 6:e1614. https://doi.org/10.1038/cddis.2014.556.
5. Manhas J, Bhattacharya A, Agrawal SK, Gupta B, Das P, Deo SV, Pal S, Sen S. Characterization of cancer stem cells from different grades of human colorectal cancer. Tumour Biol. 2016; 37:14069–81. https://doi.org/10.1007/s13277-016-5232-6.
6. Dalerba P, Cho RW, Clarke MF. Cancer stem cells: models and concepts. Annu Rev Med. 2007; 58:267–84. https://doi.org/10.1146/annurev.med.58.062105.204854.
7. Visvader JE, Lindeman GJ. Cancer stem cells in solid tumours: accumulating evidence and unresolved questions. Nat Rev Cancer. 2008; 8:755–68. https://doi.org/10.1038/nrc2499.
8. Medema JP. Cancer stem cells: the challenges ahead. Nat Cell Biol. 2013; 15:338–44. https://doi.org/10.1038/ncb2717.
9. Peiris-Pages M, Martinez-Outschoorn UE, Pestell RG, Sotgia F, Lisanti MP. Cancer stem cell metabolism. Breast Cancer Res. 2016; 18:55. https://doi.org/10.1186/s13058-016-0712-6.
10. Gupta PB, Chaffer CL, Weinberg RA. Cancer stem cells: mirage or reality? Nat Med. 2009; 15:1010–12. https://doi.org/10.1038/nm0909-1010.
11. Tomita H, Tanaka K, Tanaka T, Hara A. Aldehyde dehydrogenase 1A1 in stem cells and cancer. Oncotarget. 2016; 7:11018–32. https://doi.org/10.18632/oncotarget.6920.
12. Vishnubalaji R, Manikandan M, Al-Nbaheen M, Kadalmani B, Aldahmash A, Alajez NM. In vitro differentiati on of human skin-derived multipotent stromal cells into putative endothelial-like cells. BMC Dev Biol. 2012; 12:7. https://doi.org/10.1186/1471-213X-12-7.
13. Tondreau T, Meuleman N, Delforge A, Dejeneffe M, Leroy R, Massy M, Mortier C, Bron D, Lagneaux L. Mesenchymal stem cells derived from CD133-positive cells in mobilized peripheral blood and cord blood: proliferation, Oct4 expression, and plasticity. Stem Cells. 2005; 23:1105–12. https://doi.org/10.1634/stemcells.2004-0330.
14. Ma I, Allan AL. The role of human aldehyde dehydrogenase in normal and cancer stem cells. Stem Cell Rev. 2011; 7:292–306. https://doi.org/10.1007/s12015-010-9208-4.
15. Gerger A, Zhang W, Yang D, Bohanes P, Ning Y, Winder T, LaBonte MJ, Wilson PM, Benhaim L, Paez D, El-Khoueiry R, El-Khoueiry A, Kahn M, Lenz HJ. Common cancer stem cell gene variants predict colon cancer recurrence. Clin Cancer Res. 2011; 17:6934–43. https://doi.org/10.1158/1078-0432.CCR-11-1180.
16. Chen YC, Chen YW, Hsu HS, Tseng LM, Huang PI, Lu KH, Chen DT, Tai LK, Yung MC, Chang SC, Ku HH, Chiou SH, Lo WL. Aldehyde dehydrogenase 1 is a putative marker for cancer stem cells in head and neck squamous cancer. Biochem Biophys Res Commun. 2009; 385:307–13. https://doi.org/10.1016/j.bbrc.2009.05.048.
17. Ginestier C, Hur MH, Charafe-Jauffret E, Monville F, Dutcher J, Brown M, Jacquemier J, Viens P, Kleer CG, Liu S, Schott A, Hayes D, Birnbaum D, et al. ALDH1 is a marker of normal and malignant human mammary stem cells and a predictor of poor clinical outcome. Cell Stem Cell. 2007; 1:555–67. https://doi.org/10.1016/j.stem.2007.08.014.
18. Sullivan JP, Spinola M, Dodge M, Raso MG, Behrens C, Gao B, Schuster K, Shao C, Larsen JE, Sullivan LA, Honorio S, Xie Y, Scaglioni PP, et al. Aldehyde dehydrogenase activity selects for lung adenocarcinoma stem cells dependent on notch signaling. Cancer Res. 2010; 70:9937–48. https://doi.org/10.1158/0008-5472.CAN-10-0881.
19. Al-Hajj M, Becker MW, Wicha M, Weissman I, Clarke MF. Therapeutic implications of cancer stem cells. Curr Opin Genet Dev. 2004; 14:43–47. https://doi.org/10.1016/j.gde.2003.11.007.
20. Deng Y, Zhou J, Fang L, Cai Y, Ke J, Xie X, Huang Y, Huang M, Wang J. ALDH1 is an independent prognostic factor for patients with stages II-III rectal cancer after receiving radiochemotherapy. Br J Cancer. 2014; 110:430–34. https://doi.org/10.1038/bjc.2013.767.
21. Dayem AA, Choi HY, Kim JH, Cho SG. Role of oxidative stress in stem, cancer, and cancer stem cells. Cancers (Basel). 2010; 2:859–84. https://doi.org/10.3390/cancers2020859.
22. Gao J, Aksoy BA, Dogrusoz U, Dresdner G, Gross B, Sumer SO, Sun Y, Jacobsen A, Sinha R, Larsson E, Cerami E, Sander C, Schultz N. Integrative analysis of complex cancer genomics and clinical profiles using the cBioPortal. Sci Signal. 2013; 6:pl1. https://doi.org/10.1126/scisignal.2004088.
23. Ha mam R, Hamam D, Alsaleh KA, Kassem M, Zaher W, Alfayez M, Aldahmash A, Alajez NM. Circulating microRNAs in breast cancer: novel diagnostic and prognostic biomarkers. Cell Death Dis. 2017; 8:e3045. https://doi.org/10.1038/cddis.2017.440.
24. Alajez NM. Cancer stem cells. From characterization to therapeutic implications. Saudi Med J. 2011; 32:1229–34.
25. O’Brien CA, Pollett A, Gallinger S, Dick JE. A human colon cancer cell capable of initiating tumour growth in immunodeficient mice. Nature. 2007; 445:106–10. https://doi.org/10.1038/nature05372.
26. Kemper K, Prasetyanti PR, De Lau W, Rodermond H, Clevers H, Medema JP. Monoclonal antibodies against Lgr5 identify human colorectal cancer stem cells. Stem Cells. 2012; 30:2378–86. https://doi.org/10.1002/stem.1233.
27. Huang EH, Hynes MJ, Zhang T, Ginestier C, Dontu G, Appelman H, Fields JZ, Wicha MS, Boman BM. Aldehyde dehydrogenase 1 is a marker for normal and malignant human colonic stem cells (SC) and tracks SC overpopulation during colon tumorigenesis. Cancer Res. 2009; 69:3382–89. https://doi.org/10.1158/0008-5472.CAN-08-4418.
28. Blaj C, Schmidt EM, Lamprecht S, Hermeking H, Jung A, Kirchner T, Horst D. Oncogenic Effects of High MAPK Activity in Colorectal Cancer Mark Progenitor Cells and Persist Irrespective of RAS Mutations. Cancer Res. 2017; 77:1763–74. https://doi.org/10.1158/0008-5472.CAN-16-2821.
29. Dhillon AS, Hagan S, Rath O, Kolch W. MAP kinase signalling pathways in cancer. Oncogene. 2007; 26:3279–90. https://doi.org/10.1038/sj.onc.1210421.
30. Wang YK, Zhu YL, Qiu FM, Zhang T, Chen ZG, Zheng S, Huang J. Activation of Akt and MAPK pathways enhances the tumorigenicity of CD133+ primary colon cancer cells. Carcinogenesis. 2010; 31:1376–80. https://doi.org/10.1093/carcin/bgq120.
31. Sulzmaier FJ, Jean C, Schlaepfer DD. FAK in cancer: mechanistic findings and clinical applications. Nat Rev Cancer. 2014; 14:598–610. https://doi.org/10.1038/nrc3792.
32. Williams KE, Bundred NJ, Landberg G, Clarke RB, Farnie G. Focal adhesion kinase and Wnt signaling regulate human ductal carcinoma in situ stem cell activity and response to radiotherapy. Stem Cells. 2015; 33:327–41. https://doi.org/10.1002/stem.1843.
33. Despeaux M, Labat E, Gadelorge M, Prade N, Bertrand J, Demur C, Recher C, Bonnevialle P, Payrastre B, Bourin P, Racaud-Sultan C. Critical features of FAK-expressing AML bone marrow microenvironment through leukemia stem cell hijacking of mesenchymal stromal cells. Leukemia. 2011; 25:1789–93. https://doi.org/10.1038/leu.2011.145.
34. Schultze A, Fiedler W. Therapeutic potential and limitations of new FAK inhibitors in the treatment of cancer. Expert Opin Investig Drugs. 2010; 19:777–88. https://doi.org/10.1517/13543784.2010.489548.
35. Bao S, Wu Q, McLendon RE, Hao Y, Shi Q, Hjelmeland AB, Dewhirst MW, Bigner DD, Rich JN. Glioma stem cells promote radioresistance by preferential activation of the DNA damage response. Nature. 2006; 444:756–60. https://doi.org/10.1038/nature05236.
36. Lim YC, Roberts TL, Day BW, Harding A, Kozlov S, Kijas AW, Ensbey KS, Walker DG, Lavin MF. A role for homologous recombination and abnormal cell-cycle progression in radioresistance of glioma-initiating cells. Mol Cancer Ther. 2012; 11:1863–72. https://doi.org/10.1158/1535-7163.MCT-11-1044.
37. Chiou SH, Wang ML, Chou YT, Chen CJ, Hong CF, Hsieh WJ, Chang HT, Chen YS, Lin TW, Hsu HS, Wu CW. Coexpression of Oct4 and Nanog enhances malignancy in lung adenocarcinoma by inducing cancer stem cell-like properties and epithelial-mesenchymal transdifferentiation. Cancer Res. 2010; 70:10433–44. https://doi.org/10.1158/0008-5472.CAN-10-2638.
38. Kumar SM, Liu S, Lu H, Zhang H, Zhang PJ, Gimotty PA, Guerra M, Guo W, Xu X. Acquired cancer stem cell phenotypes through Oct4-mediated dedifferentiation. Oncogene. 2012; 31:4898–911. https://doi.org/10.1038/onc.2011.656.
39. Siegel R, Desantis C, Jemal A. Colorectal cancer statistics, 2014. CA Cancer J Clin. 2014; 64:104–17. https://doi.org/10.3322/caac.21220.
40. Kahlert C, Gaitzsch E, Steinert G, Mogler C, Herpel E, Hoffmeister M, Jansen L, Benner A, Brenner H, Chang-Claude J, Rahbari N, Schmidt T, Klupp F, et al. Expression analysis of aldehyde dehydrogenase 1A1 (ALDH1A1) in colon and rectal cancer in association with prognosis and response to chemotherapy. Ann Surg Oncol. 2012; 19:4193–201. https://doi.org/10.1245/s10434-012-2518-9.
41. Holah NS, Aiad HA, Asaad NY, Elkhouly EA, Lasheen AG. Evaluation of the Role of ALDH1 as Cancer Stem Cell Marker in Colorectal Carcinoma: An Immunohistochemical Study. J Clin Diagn Res. 2017; 11:EC17–23.
42. Chen J, Xia Q, Jiang B, Chang W, Yuan W, Ma Z, Liu Z, Shu X. Prognostic Value of Cancer Stem Cell Marker ALDH1 Expression in Colorectal Can cer: A Systematic Review and Meta-Analysis. PLoS One. 2015; 10:e0145164. https://doi.org/10.1371/journal.pone.0145164.
43. Vishnubalaji R, Atteya M, Al-Nbaheen M, Oreffo RO, Aldahmash A, Alajez NM. Angiogenic Potential of Human Neonatal Foreskin Stromal Cells in the Chick Embryo Chorioallantoic Membrane Model. Stem Cells Int. 2015; 2015:257019. https://doi.org/10.1155/2015/257019.
44. Vishnubalaji R, Hamam R, Yue S, Al-Obeed O, Kassem M, Liu FF, Aldahmash A, Alajez NM. MicroRNA-320 suppresses colorectal cancer by targeting SOX4, FOXM1, and FOXQ1. Oncotarget. 2016; 7:35789–802. https://doi.org/10.18632/oncotarget.8937.
45. Ali D, Alshammari H, Vishnubalaji R, Chalisserry EP, Hamam R, Alfayez M, Kassem M, Aldahmash A, Alajez NM. CUDC-907 Promotes Bone Marrow Adipocytic Differentiation Through Inhibition of Histone Deacetylase and Regulation of Cell Cycle. Stem Cells Dev. 2017; 26:353–62. https://doi.org/10.1089/scd.2016.0183.