
INTRODUCTION
Homocysteine (Hcy) is an amino acid containing a sulfur group and is a key component of the methionine recycle system. Hcy plays a fundamental role in methyl-donor biosynthesis, which is biochemically linked to the principal epigenetic code found in DNA [1]. Our previous studies have reported that elevated Hcy, known as hyperhomocysteinemia (HHcy), disrupts inner [2, 3] and outer [4] blood-retinal barrier (BRB) integrity. The presence of an intact BRB is critical for maintaining the structural and functional integrity of the retina. The breakdown of BRB is a hallmark of the pathogenesis and development of retinal diseases, such as diabetic retinopathy (DR) [5–7] or age-related macular degeneration (AMD) [8–10]. Over the last decade, HHcy has received special attention to its relation to DR and AMD in several clinical and epidemiological studies, suggesting an association between elevated levels of serum Hcy and the risk of DR [11–16] and AMD [17–22]. However, the underlying mechanism of HHcy-induced BRB dysfunction is not clearly defined.
Mounting evidence revealed that elevated Hcy may be associated with DNA methylation and other epigenetic modifications [23–30]. Exploring the interactions among epigenome, genome, and environmental changes will increase the understanding of epigenetic-disease mechanisms and could lead to recognizing disease-risk factors in support of targeted intervention and therapies [31–34].
Epigenetic modifications are defined as changes in phenotype and gene expression that take place without alterations of DNA sequence [35]. Recently, epigenetic modifications have been highlighted as important mechanisms for the development of number of diseases [36–38].There are three major epigenetic modification mechanisms:(1) DNA methylation, which is the most well-known epigenetic modification and plays an essential role in controlling global and specific gene expression. It is mediated by DNA methyl transferases (DNMTs) [39, 40], (2) Histone modification, which is defined as changes occurring in histone proteins that will affect gene expression.
Chromatin is the complex of chromosomal DNA and proteins that forms chromosomes in the nucleus. DNA is packaged in chromatin by wrapping around histone proteins in units called nucleosomes. Histone proteins are highly alkaline, with Histone tails that are normally positively charged due to presence of amine groups on their basic lysine and arginine amino acids [41, 42]. These positive charges on histone tails help histone proteins to interact with and bind to the DNA backbone at the negatively charged phosphate groups. During the acetylation process, amines on the histone change into amides; thereby, positive charges on the histone become neutralized and subsequently the capability of the histones to bind with DNA is reduced [43, 44]. This decreased binding results in expansion of chromatin, which permits genetic transcription to occur. The Histone deacetylation is catalyzed when histone deacetylases remove those acetyl groups, which increase the positively charged amine groups of histone tails and facilitate high-affinity binding between the histones and the negatively charged phosphate groups on the DNA backbone. The increased binding of DNA to histone condenses the DNA structure, interfering with the DNA transcription process [45].
Lastly, (3) non-coding RNA regulation (miRNAs), or microRNAs, comprise a unique class of small (~22) groups of nucleotides, endogenous non-coding RNAs that play a crucial role in regulating gene expression by silencing their target mRNAs [46–48]. MiRNAs can represent tools for the regulation of gene expression not only within the cell in which they are produced but also in the gene expression of other remote cells [49–51]. MiRNAs can be released from their cells of origin and circulate to target different cells in different tissues. One of the most interesting carriers of miRNAs are extracellular vesicles.
Extracellular vesicles, including exosomes, are nano-sized (30–150 nm) vesicles that are normally released into different body fluids to serve as an important intercellular communication tool [49, 50]. Exosomes have been reported to be related to different disease pathologies, including DR [51–55] and AMD [56–59]. The results of many earlier studies have suggested that exosomes play an important role in the pathogenesis of AMD and the contribution of retinal pigment epithelium (RPE)-derived exosomes to drusen formation [59–61], transport of oxidative stress signaling molecules from RPE to other retinal cells [56], and choroidal neovascularization [58]. Interestingly, circulating exosomal miRNAs have been studied as possible markers for AMD [62], and RPE-exosomes have been suggested as biological biomarkers in patients with neovascular AMD [57].
This study explores epigenetic modifications as possible mechanisms of HHcy-induced BRB dysfunction. Targeting HHcy-induced epigenetic modifications could provide therapeutic targets to mitigate Hcy-mediated BRB dysfunction in retinal diseases associated with elevated Hcy, such as DR and AMD.
METHODOLOGY
Cell culture
Human primary retinal endothelial cells (HRECs) were purchased from Cell Systems Cooperation (Kirkland, WA) and grown on plates coated with gelatin in EBM2 Medium (Catalog #190860, Lonza, Walkersville, MD) supplemented with 5% fetal bovine serum (FBS) and1% penicillin streptomycin (PS, Catalog # 30-004-CI, Corning, Inc., NY).
Human retinal pigmented epithelial cell line (ARPE-19) was attained from American Type Culture Collection (ATCC, Manassas, VA, USA). Passages 6–15 of ARPE-19 were grown on gelatin-coated dishes and incubated in Dulbecco’s modified Eagle’s medium-nutrient mixture F-12 (DMEM/F-12, Thermo Scientific, Wyman, MA) supplemented with 1% penicillin/streptomycin and 10% FBS (Atlantic Biological, Norcross, GA, USA). When the cells reached 80–90% confluency, they were shifted to the serum starvation overnight, followed by treatment with Hcy (20, 50 and 100 μM) or vehicle.
Animal studies
Animal protocol was approved by the Institutional Animal Care and Use Committee (IACUC) at Augusta University. All experimental procedures done with animals were performed according to guidelines accepted by the Association for Research in Vision and Ophthalmology (ARVO) Statement for the Use of Animals in Ophthalmic and Vision Research. Cystathionine beta-synthase (cbs) deficient mice were generated as described before [63]. Colonies of cbs+/+, cbs+/−, and cbs−/− were established by breeding pairs of cbs+/− mice (B6.129P2-Cbstm1Unc/J; Jackson Laboratories, Bar Harbor, ME).
Assessment of DNA methyltransferase (DNMT) activity
Nuclear extracts were prepared from retinas of cbs+/+, cbs+/– and cbs–/– mice (3 weeks old), HRECs and ARPE-19 treated with Hcy (20, 50 and 100 μM) using a nuclear extraction kit purchased from Abcam (Abcam Inc., Cambridge, MA, USA). Following extraction DNMT activity was assayed calorimetrically according to manufacturer’s instructions (Cat# P-3009-48, Epigentek, Farmingdale, NY, USA). Briefly, nuclear extracts were added to a microplate coated with a universal DNMT substrate in presence of adenosyl methionine as methyl donor. The produced methylated DNA which is proportional to the DNMT activity was captured using anti-methyl cytosine antibody and then detected using detection antibody through an ELISA-like reaction. The color produced was measured at 450 nm and its density was proportional to DNMT activity.
Assessment of HDAC activity
HDAC activity was assayed by using a colorimetric assay kit (Catalog #K331-100, BioVision, CA, USA). Retinal nuclear extracts prepared from cbs+/+, cbs+/– and cbs–/– mice and Hcy-treated HRECs and ARPE-19 (20, 50 and 100 μM) were incubated with a substrate containing acetylated Lysine side chain for 1 h at 37° C. Following deacetylation by sample HDAC, the reaction was terminated by adding Lysine Developer to produce a chromophore that was measured spectrophotometrically at 400 nm.
Optical coherence tomography (OCT) and fluorescein angiography (FA)
To evaluate the effect of combined Inhibition of DNA methylation and histone deacetylation on Hcy-induced retinal disruption on 24-week-old mice injected intravitreally with Hcy with and without repeated intraperitoneal injection of combined inhibitors of DNA methylation and histone deacetylation. OCT and FA were performed simultaneously after 48 and 72 hours from Hcy injection, as described in our pervious publication [2, 4]. Briefly, mice were injected intravitreally with Hcy (200 μM) with and without intraperitoneal injection of combined inhibitor of HDAC, Sodium butyrate (SB, 1mg/kg, catalog # B5887-250MG sigma Aldrich) and DNMT inhibitor, 5-Azacytidine (5-AZC,2.5 mg/kg, catalog # A2385 SIGMA) [64–67]. The mice were anesthetized using 2% isoflurane and their eyes were dilated using 1% tropicamide eye drop. Each mouse was then placed on the imaging platform of the Phoenix Micron III retinal imaging microscope supplemented with OCT imaging device (Phoenix Research Laboratories, Pleasanton, CA). To keep the eye moist during imaging, lubricant gel was applied 20 μL 10% fluorescein sodium (Apollo Ophthalmics, Newport Beach, CA) were injected into the mice intraperitoneal, followed by rapid acquisition of fluorescent images ensued for ~5 minutes. Fluorescein leakage was demonstrated as indistinct vascular borders progressing to diffusely hazy fluorescence.
RNA isolation, preparation and analysis
Retinas of age matched cbs+/–, cbs–/– and WT mice were enucleated and total RNA was extracted using Ambion, TRIzol Reagent (Life Technologies). RNA purity and concentration were assessed by spectrophotometry using Nano Drop ND-1000 (Thermo Fisher).
Microarray analysis
A total 250 ng of RNA was labeled with biotin using the Flash Tag Biotin HSR RNA Labeling Kit (Affymetrix, Santa Clara, CA) according to the manufacturer’s protocol. The labeled samples were then hybridized into the Gene Chip miRNA 3.0 array (Affymetrix). Hybridization, washing, and scanning of the arrays were carried out according to Affymetrix’s recommendations. The data was imported into the Partek Genomic Suites version 6.6 (Partek, St. Louis, MO). Principal component analysis (PCA) was performed to visualize the partition among the groups. The differential expressions were calculated by using ANOVA of the Partek Package and filtered with a p-value cutoff of 0.05 and a fold-change cutoff 1.5-foldto screen highly significant miRNAs. The significant miRNA lists were used to generate hierarchical clustering plots.
Bioinformatics analysis of the data
MiRNA lists were imported into Ingenuity Pathway Analysis (Qiagen) and analyzed on MicroRNA Target Filter and Core Analysis for detection of predicted target genes of miRNAs and associated pathways.
RT-PCR
RT-PCR was performed to validate the differential expression of selected miRNAs. RNA was extracted from retinas of cbs+/– mice and their age matched controls. RT-PCR was performed for miRNAs in these samples using appropriate miScript primers obtained from Qiagen. The following primers were used: Mm_miR-200c_1 miScript Primer Assay (MS00001827), Mm_miR-205_1 miScript Primer Assay (MS00001862), Mm_miR-199a-3p_1 miScript Primer Assay (MS00007889), Mm_miR-206_1 miScript Primer Assay (MS00001869), Mm_miR-31_1 miScript Primer Assay (MS00001407), Mm_miR-16_2 miScript Primer Assay (MS00037366), Mm_miR-27b_1 miScript Primer Assay (MS00001358), Mm_miR-29a_1 miScript Primer Assay (MS00001372). U6 was used as an internal control (U6 snRNA, Product #.:203907, EXIQON)
Exosmoes isolation from cell culture media
Conditional culture media was collected, and then centrifuged for 30 minutes at 2000 × g to remove any cells or debris. Then, exosomes were isolated using Invitrogen Total Exosome Isolation Reagent (from cell culture media) (Catalog#: 4478359) according to the manufacturer’s protocol. Briefly, 0.5 volumes of the exosome isolation reagent was added to the media then vortexing was done to mix the reagent with the media. The mixture was left overnight at 4° C. Next day, the mixture was centrifuged at 10,000 × g for an hour at 4° C. Supernatants were aspirated and pellets were suspended again in an appropriate PBS volume.
Zeta view nanoparticle tracking analysis (NTA)
The size and concentration of the exosomes isolated were quantified by using NTA which was done utilizing the ZetaView PMX 110 (Particle Metrix, Meerbusch, Germany) and its related software (ZetaView 8.02.28) [68]. Each sample was measured at 11 different positions, and then the size and concentration of each sample were obtained. ZetaView 8.02.28 software was used for the analysis of measurement data from the ZetaView.
Exosomal RNA isolation and measurement
RNA isolation was performed using the Total Exosome RNA & Protein Isolation Kit (catalog # 4478545; Invitrogen) according to the manufacturer’s protocol. A final volume of 30 μl RNA solution was collected from each. Agilent 2100 Bioanalyzer (Santa Clara, CA) was used for measuring RNA quality and concentration at the Integrated Genomics Core of Georgia Cancer Center at Augusta University.
Statistical analysis
Different experimental groups were compared by using the student two-tailed t test or one-way analysis of variance (ANOVA), with a post hoc Tukey’s test. Data considered statistically significant when P value < 0.05. The outcomes are expressed as mean ± SD. For the microarray data analysis; the fold change was calculated using least squares means of the groups.
RESULTS
Hcy increases DNA methylation and histone deacetylation in vivo and in vitro
Experiments were performed (in vivo and in vitro) to evaluate the effect of HHcy on the activities of DNMT enzymes (Figure 1A) and HDAC enzymes (Figure 1B), as key enzymes of DNA methylation and histone deacetylation respectively. In vitro experiments using HRECs and ARPE-19 treated with Hcy showed a significant increase of DNMT and HDAC activities in a dose-dependent manner. This was consistent with the in vivo effect of HHcy, where both cbs+/– and cbs–/– mice retina showed marked increase of the activity of DNMT enzymes as well as HDAC enzymes compared to the normal control group.
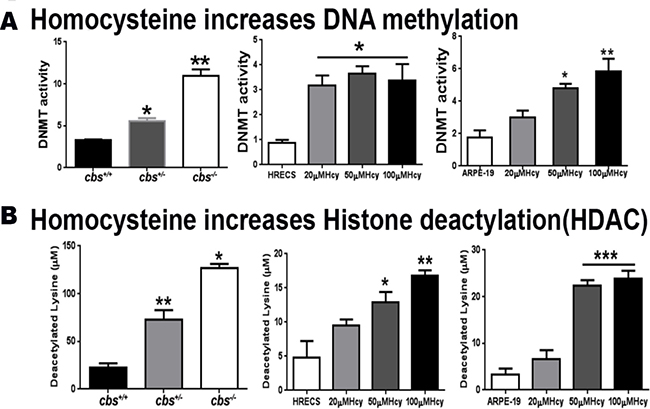
Figure 1: Assessment of DNA methylation and histone deacetylation. (A) Measurement of DNA methyl transferase Enzyme (DNMT) activity in cbs–/– and cbs+/– mice compared to control cbs+/+ mice (left panel), human retinal endothelial cells (HRECs) treated with homocysteine (Hcy) (middle panel) and retinal pigment epithelial cells ARPE-19 treated with Hcy (right panel) showed that Hcy induced a significant increase in DNMT activity (*p < 0.05, **p < 0.01). (B) Measurement of Histone deacetylases (HDAC) enzyme activity in cbs–/– and cbs+/– mice compared to control cbs+/+ mice (left panel), human retinal endothelial cells (HRECs) treated with homocysteine (Hcy) (middle panel) and retinal pigment epithelial cells ARPE-19 treated with Hcy (right panel) showed Hcy induced a significant increase in HDAC enzyme activity (*p < 0.05, **p < 0.01, ***p < 0.001).
Inhibition of DNA methylation and histone deacetylation diminishes HHcy effect on mice retina
Optical coherence tomography (OCT) and fluorescein angiography (FA) examinations of 24 weeks living mice injected intravitreally with Hcy with and without intraperitoneal injection of combined inhibitors of DNA methylation (DNMT inhibitor, 5-Azacytidine) and histone deacetylation (HDAC inhibitor, Sodium butyrate) showed changes in the FA and OCT examination in the mice injected with Hcy similar to what has been reported before in our previous publication [2, 4]. FA revealed diffuse hyper fluorescence, leakage and focal areas of hyper-fluorescence coming from the deeper layer (yellow arrows) suggestive of choroidal neovascularization (CNV) and the OCT examination revealed disruption of the retinal morphology with RPE changes with the development of CNV (white arrows), and intra-retinal neovascularization (arrow heads). Interestingly, combined injection of Hcy and HDAC/DNMT inhibitors protected the retina from the distributing effect of Hcy alone on mice retina as shown in both FA and OCT (Figure 2)
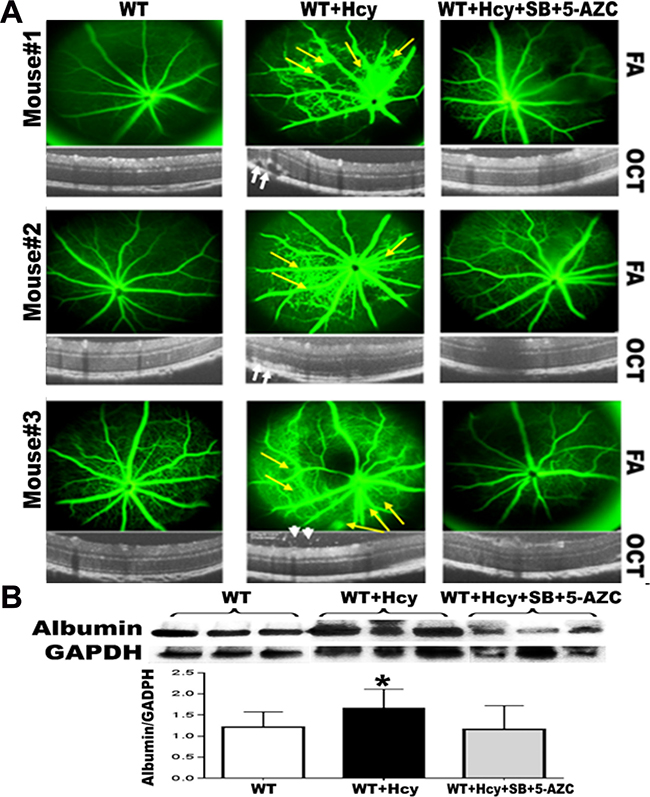
Figure 2: Effect of inhibition of DNA methylation and histone deacetylation on Hcy-induced BRB dysfunction. OCT and FA examinations of 24-week-old mice injected intravitreally with Hcy with and without intraperitoneal injection of combined inhibitors of DNA methylation (DNMT inhibitor, 5-Azacytidine) and histone deacetylation (HDAC inhibitor, Sodium butyrate). The FA and OCT examination in the mice injected with Hcy revealed diffuse hyper fluorescence, leakage and focal areas of hyper-fluorescence coming from the deeper layer (yellow arrows) suggesting choroidal neovascularization (CNV). OCT examination revealed disruption of the retinal morphology with RPE changes with the development of CNV (white arrows) and intra-retinal neovascularization (arrow heads). Interestingly, combined injection of Hcy and HDAC&DNMT inhibitors protected the retina from the distributing effect of Hcy alone on mice retina as shown in both FA and OCT (A)The leakage was confirmed by measuring the albumin leakage in the retinas by western blotting (B), which was significantly increased in the Hcy-injected mice eyes compared to non-injected eyes and the eyes injected with Hcy along with intraperitoneal injection of combined DNMT&HDAC inhibitors, *p < 0.05.
Differential expression profile of miRNAs in cbs–/– and cbs+/– mice retina
In order to identify the impact of severely elevated Hcy levels on the retinal miRNA profile, a microarray analysis was done for retinas of cbs–/– mice compared to control cbs+/+ retinas at 3 weeks old (Figure 3A–3C). The data was filtered by using p value less than 0.05 which reveals 217 miRNAs significantly differentially expressed versus cbs+/+ (p value < 0.05) of which 124 were downregulated and 93 were upregulated. From these statistically significant miRNAs, 39 miRNAs were more than 1.5-fold change, 20 miRNAs of them were downregulated (Table 1A) and 19 were upregulated (Table 1B). In order to identify the impact of mild to moderate elevation of Hcy levels on the retinal miRNA profile, miRNA microarray analysis was done for the cbs+/– mice retina compared to the cbs+/+ control (Figure 3D–3F). The differential miRNA expression profiling of the cbs+/– retinas showed 307 statistically significant and differentially expressed miRNAs compared to the cbs+/+ control (157 miRNAs were downregulated and 150 were upregulated). Further filtration of these miRNAs based on the fold change cutoff more than 1.5, revealed that 127 miRNAs were significant with fold change more than 1.5; of which 49 were downregulated (Table 2A) and 78 were upregulated (Table 2B).
Table 1A: Downregulated miRNAs in cbs–/–
Species Scientific Name |
Transcript ID |
p-value (cbs–/– vs. WT) |
Fold-Change (cbs–/– vs. WT) |
|---|---|---|---|
Musmusculus |
mmu-miR-205_st |
0.0031763 |
–11.649 |
Musmusculus |
mmu-miR-200c_st |
0.0246158 |
–3.802 |
Musmusculus |
mmu-miR-184_st |
0.0170031 |
–3.06739 |
Musmusculus |
mmu-miR-431_st |
0.00570439 |
–2.43854 |
Musmusculus |
mmu-miR-669e_st |
0.00155807 |
–2.42538 |
Musmusculus |
mmu-miR-3470a_st |
0.00672318 |
–1.97946 |
Musmusculus |
mmu-miR-491_st |
0.00328488 |
–1.94599 |
Musmusculus |
mmu-miR-3064-5p_st |
0.0276855 |
–1.77619 |
Musmusculus |
mmu-miR-466f_st |
0.00409442 |
–1.75841 |
Musmusculus |
mmu-miR-2182_st |
0.00532508 |
–1.70938 |
Musmusculus |
mmu-miR-341_st |
0.0497367 |
–1.70718 |
Musmusculus |
mmu-miR-665-star_st |
0.00544338 |
–1.69474 |
Musmusculus |
mmu-miR-1943-star_st |
0.0157678 |
–1.64527 |
Musmusculus |
mmu-miR-486_st |
0.0396356 |
–1.63793 |
Musmusculus |
mmu-miR-467a-star_st |
0.00240509 |
–1.60868 |
Musmusculus |
mmu-miR-669f-5p_st |
0.0107809 |
–1.5763 |
Musmusculus |
mmu-miR-3107-star_st |
0.0238135 |
–1.5554 |
Musmusculus |
mmu-miR-704_st |
0.0398611 |
–1.5438 |
Musmusculus |
mmu-miR-574-3p_st |
0.0192491 |
–1.52933 |
Musmusculus |
mmu-miR-668_st |
0.00500674 |
–1.52278 |
Table 1B: Upregulated miRNAs in cbs–/–
Species Scientific Name |
Transcript ID |
p-value (cbs–/– vs. WT) |
Fold-Change (cbs–/– vs. WT) |
|---|---|---|---|
Musmusculus |
mmu-miR-466n-3p_st |
0.0190517 |
1.50982 |
Musmusculus |
mmu-miR-365-1-star_st |
0.0245969 |
1.52398 |
Musmusculus |
mmu-miR-130a_st |
0.00204146 |
1.53391 |
Musmusculus |
mmu-miR-190-star_st |
0.0134738 |
1.53692 |
Musmusculus |
hp_mmu-mir-122_st |
0.00397692 |
1.54397 |
Musmusculus |
mmu-miR-20b_st |
0.0346663 |
1.56532 |
Musmusculus |
mmu-miR-5134_st |
0.0469534 |
1.5701 |
Musmusculus |
hp_mmu-mir-3069_st |
0.0492988 |
1.57457 |
Musmusculus |
mmu-miR-106a_st |
0.0113837 |
1.59451 |
Musmusculus |
mmu-miR-27b-star_st |
0.0196148 |
1.66825 |
Musmusculus |
mmu-miR-1897-5p_st |
0.0257959 |
1.71905 |
Musmusculus |
mmu-miR-669o-3p_st |
0.00317962 |
1.72556 |
Musmusculus |
mmu-miR-212-5p_st |
0.001819 |
1.83151 |
Musmusculus |
mmu-miR-30e_st |
0.00214344 |
1.92996 |
Musmusculus |
mmu-miR-3475_st |
0.0178601 |
1.9339 |
Musmusculus |
mmu-miR-695_st |
0.0285587 |
2.21816 |
Musmusculus |
mmu-miR-327_st |
0.0307551 |
2.55046 |
Musmusculus |
mmu-miR-335-5p_st |
0.00904379 |
3.53076 |
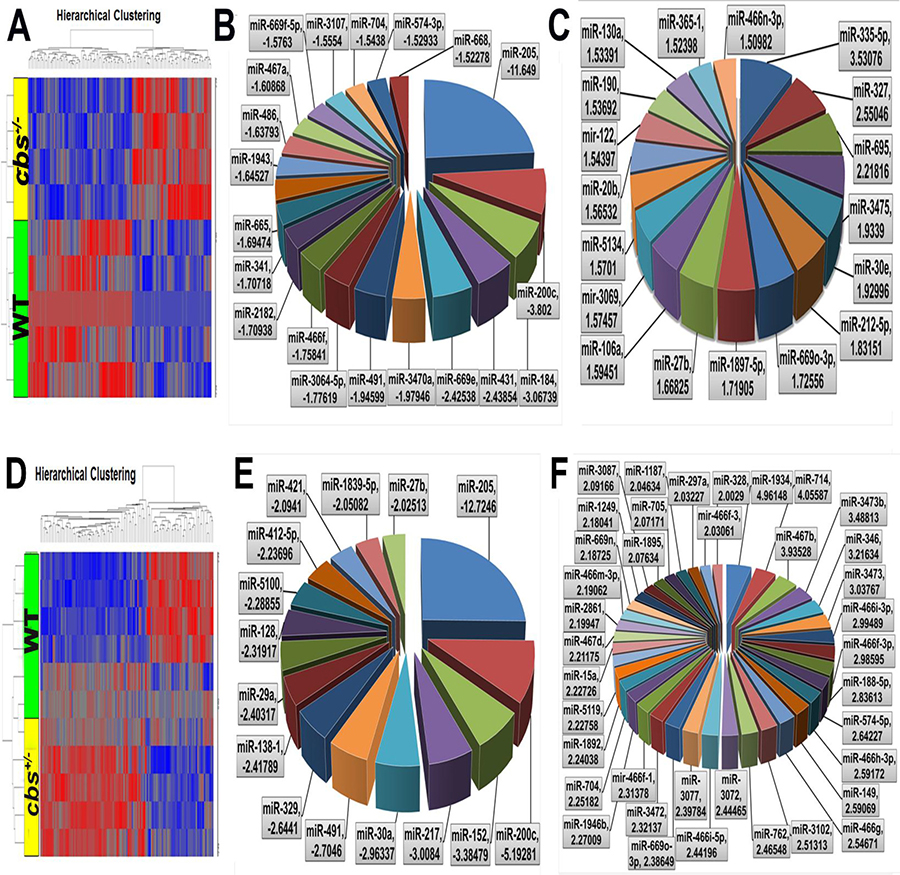
Figure 3: Differential expression profile of miRNAs in cbs–/– and cbs+/– mouse retina. (A) Heat map showing differentially expressed miRNAs in cbs–/– mouse retina compared to cbs+/+ wild type control. Blue color indicates downregulated miRNAs and red color indicates upregulated miRNAs. (B) Pie chart showing miRNAs downregulated in cbs–/– mouse retina compared to cbs+/+ wild type control (C) Pie chart showing miRNAs upregulated in cbs–/– mouse retina compared to cbs+/+ wild type control. (D) Heat map showing differentially expressed miRNAs in cbs+/– mouse retina compared to cbs+/+ wild type control. Blue color indicates downregulated miRNAs and red color indicates upregulated miRNAs. (E) Pie chart showing miRNAs downregulated in cbs+/– mouse retina compared to cbs+/+ wild type control. (F) Pie chart showing miRNAs upregulated in cbs+/– mouse retina compared to cbs+/+ wild type control.
Table 2A: Downregulated miRNAs in cbs+/–
Species Scientific Name |
Transcript ID |
p-value (cbs+/– vs. WT) |
Fold-Change (cbs+/– vs. WT) |
|---|---|---|---|
Musmusculus |
mmu-miR-205_st |
0.00222063 |
–12.7246 |
Musmusculus |
mmu-miR-200c_st |
0.00648219 |
–5.19281 |
Musmusculus |
mmu-miR-152_st |
0.00458781 |
–3.38479 |
Musmusculus |
mmu-miR-217_st |
0.000331015 |
–3.0084 |
Musmusculus |
mmu-miR-30a-star_st |
0.0228718 |
–2.96337 |
Musmusculus |
mmu-miR-491_st |
0.000552044 |
–2.7046 |
Musmusculus |
mmu-miR-329_st |
0.0117443 |
–2.6441 |
Musmusculus |
mmu-miR-138-1-star_st |
0.00500405 |
–2.41789 |
Musmusculus |
mmu-miR-29a_st |
0.03658 |
–2.40317 |
Musmusculus |
mmu-miR-128_st |
0.00381972 |
–2.31917 |
Musmusculus |
mmu-miR-5100_st |
7.60E-05 |
–2.28855 |
Musmusculus |
mmu-miR-412-5p_st |
0.0241069 |
–2.23696 |
Musmusculus |
mmu-miR-421_st |
0.00638554 |
–2.0941 |
Musmusculus |
mmu-miR-1839-5p_st |
0.00541099 |
–2.05082 |
Musmusculus |
mmu-miR-27b_st |
0.00384257 |
–2.02513 |
Musmusculus |
mmu-miR-674-star_st |
0.0249087 |
–1.97604 |
Musmusculus |
mmu-miR-362-5p_st |
0.00180754 |
–1.87892 |
Musmusculus |
mmu-miR-543_st |
0.0356474 |
–1.84637 |
Musmusculus |
mmu-miR-154_st |
0.0155685 |
–1.8344 |
Musmusculus |
mmu-miR-132_st |
0.00450186 |
–1.81842 |
Musmusculus |
mmu-miR-431_st |
0.0149049 |
–1.79581 |
Musmusculus |
mmu-miR-338-5p_st |
0.0192303 |
–1.79459 |
Musmusculus |
mmu-miR-212-3p_st |
0.0189292 |
–1.79255 |
Musmusculus |
mmu-miR-194_st |
0.0331242 |
–1.78064 |
Musmusculus |
mmu-miR-100_st |
0.00951479 |
–1.78007 |
Musmusculus |
mmu-miR-129-2-3p_st |
0.00833425 |
–1.75675 |
Musmusculus |
mmu-miR-412-3p_st |
0.0322016 |
–1.75503 |
Musmusculus |
mmu-miR-99a_st |
0.000217283 |
–1.75086 |
Musmusculus |
mmu-miR-126-3p_st |
0.00834968 |
–1.74797 |
Musmusculus |
mmu-miR-28_st |
0.0256688 |
–1.74017 |
Musmusculus |
mmu-miR-138-2-star_st |
0.0412741 |
–1.72159 |
Musmusculus |
mmu-miR-434-3p_st |
0.00699578 |
–1.7189 |
Musmusculus |
mmu-miR-29b-2-star_st |
0.0314635 |
–1.71233 |
Musmusculus |
mmu-miR-379_st |
0.00225407 |
–1.69645 |
Musmusculus |
mmu-miR-673-3p_st |
0.0141924 |
–1.67801 |
Musmusculus |
mmu-miR-26b_st |
0.0347711 |
–1.67488 |
Musmusculus |
mmu-miR-375_st |
0.0115361 |
–1.65935 |
Musmusculus |
mmu-miR-150_st |
0.014412 |
–1.65243 |
Musmusculus |
mmu-miR-3064-5p_st |
0.0258966 |
–1.6452 |
Musmusculus |
mmu-miR-495_st |
0.0197081 |
–1.62409 |
Musmusculus |
mmu-miR-485-star_st |
0.015586 |
–1.60495 |
Musmusculus |
mmu-miR-874_st |
0.0419194 |
–1.59787 |
Musmusculus |
mmu-miR-487b_st |
0.0181579 |
–1.59098 |
Musmusculus |
mmu-miR-212-5p_st |
0.00878037 |
–1.58842 |
Musmusculus |
mmu-miR-30c-2-star_st |
0.0107089 |
–1.54934 |
Musmusculus |
mmu-miR-22_st |
0.000198259 |
–1.54389 |
Musmusculus |
mmu-miR-30c_st |
0.0029497 |
–1.54025 |
Musmusculus |
mmu-miR-195_st |
0.00855184 |
–1.53897 |
Musmusculus |
mmu-miR-342-3p_st |
0.000129999 |
–1.52217 |
Table 2B: Upregulated miRNAs in cbs+/–
Species Scientific Name |
Transcript ID |
p-value (cbs+/– vs. WT) |
Fold-Change (cbs+/– vs. WT) |
|---|---|---|---|
Musmusculus |
hp_mmu-mir-297a-6_x_st |
0.00478449 |
1.51015 |
Musmusculus |
hp_mmu-mir-692-1_x_st |
0.029077 |
1.57678 |
Musmusculus |
mmu-miR-466a-3p_st |
0.0331968 |
1.59417 |
Musmusculus |
mmu-miR-5110_st |
0.0112957 |
1.5946 |
Musmusculus |
mmu-miR-5107_st |
0.000824498 |
1.59638 |
Musmusculus |
mmu-miR-696_st |
0.0391273 |
1.5983 |
Musmusculus |
mmu-miR-5109_st |
0.00162405 |
1.60236 |
Musmusculus |
mmu-miR-467h_st |
0.0229014 |
1.62104 |
Musmusculus |
hp_mmu-mir-466m_x_st |
0.0375686 |
1.63873 |
Musmusculus |
mmu-miR-92b-star_st |
0.00583904 |
1.64273 |
Musmusculus |
mmu-miR-669c_st |
0.00218886 |
1.64946 |
Musmusculus |
hp_mmu-mir-194-2_st |
0.00178807 |
1.65489 |
Musmusculus |
mmu-miR-466h-5p_st |
0.0237521 |
1.67801 |
Musmusculus |
mmu-miR-5126_st |
0.000430848 |
1.68182 |
Musmusculus |
mmu-miR-211-star_st |
0.00584196 |
1.6863 |
Musmusculus |
mmu-miR-5128_st |
0.000296384 |
1.70787 |
Musmusculus |
mmu-miR-669b_st |
0.0136101 |
1.71598 |
Musmusculus |
mmu-miR-344e-star_st |
0.0154884 |
1.72918 |
Musmusculus |
mmu-miR-3470b_st |
0.0130989 |
1.73068 |
Musmusculus |
mmu-miR-504-star_st |
0.0058915 |
1.74408 |
Musmusculus |
mmu-miR-3082-5p_st |
0.0111523 |
1.76029 |
Musmusculus |
hp_mmu-mir-466f-2_x_st |
0.014706 |
1.76379 |
Musmusculus |
hp_mmu-mir-1194_st |
0.00469116 |
1.7654 |
Musmusculus |
mmu-miR-1946a_st |
0.00573744 |
1.77638 |
Musmusculus |
mmu-miR-669m-5p_st |
0.00277103 |
1.77932 |
Musmusculus |
mmu-miR-5130_st |
0.00104483 |
1.78517 |
Musmusculus |
mmu-miR-1896_st |
0.00488995 |
1.80244 |
Musmusculus |
mmu-miR-669k-star_st |
0.016768 |
1.80843 |
Musmusculus |
mmu-miR-466f-5p_st |
0.0019437 |
1.82175 |
Musmusculus |
mmu-miR-690_st |
0.0118474 |
1.83076 |
Musmusculus |
mmu-miR-3960_st |
0.00349971 |
1.83654 |
Musmusculus |
mmu-miR-466f_st |
0.00468465 |
1.83736 |
Musmusculus |
mmu-miR-669h-3p_st |
0.0478939 |
1.85694 |
Musmusculus |
mmu-miR-467f_st |
0.0161899 |
1.85717 |
Musmusculus |
mmu-miR-1894-3p_st |
0.000747658 |
1.87084 |
Musmusculus |
mmu-miR-3104-5p_st |
0.000782604 |
1.9097 |
Musmusculus |
mmu-miR-3102-5p.2_st |
0.00260383 |
1.93142 |
Musmusculus |
mmu-miR-466m-5p_st |
0.0090442 |
1.93389 |
Musmusculus |
mmu-miR-698_st |
0.0341733 |
1.95773 |
Musmusculus |
mmu-miR-466q_st |
0.0332336 |
1.98251 |
Musmusculus |
mmu-miR-328-star_st |
0.000301474 |
2.0029 |
Musmusculus |
hp_mmu-mir-466f-3_x_st |
0.0197357 |
2.03061 |
Musmusculus |
mmu-miR-297a_st |
0.0413891 |
2.03227 |
Musmusculus |
mmu-miR-1187_st |
0.00682685 |
2.04634 |
Musmusculus |
mmu-miR-705_st |
0.000880031 |
2.07171 |
Musmusculus |
mmu-miR-1895_st |
0.00234172 |
2.07634 |
Musmusculus |
mmu-miR-3087-star_st |
0.00362349 |
2.09166 |
Musmusculus |
mmu-miR-1249-star_st |
0.0455887 |
2.18041 |
Musmusculus |
mmu-miR-669n_st |
0.00800571 |
2.18725 |
Musmusculus |
mmu-miR-466m-3p_st |
0.0484292 |
2.19062 |
Musmusculus |
mmu-miR-2861_st |
0.00458595 |
2.19947 |
Musmusculus |
mmu-miR-467d-star_st |
0.0340084 |
2.21175 |
Musmusculus |
mmu-miR-15a-star_st |
0.015554 |
2.22726 |
Musmusculus |
mmu-miR-5119_st |
0.00943229 |
2.22758 |
Musmusculus |
mmu-miR-1892_st |
0.00173456 |
2.24038 |
Musmusculus |
mmu-miR-704_st |
0.0138606 |
2.25182 |
Musmusculus |
mmu-miR-1946b_st |
0.00187268 |
2.27009 |
Musmusculus |
hp_mmu-mir-466f-1_x_st |
0.00485862 |
2.31378 |
Musmusculus |
mmu-miR-3472_st |
0.00581812 |
2.32137 |
Musmusculus |
mmu-miR-669o-3p_st |
0.0372755 |
2.38649 |
Musmusculus |
mmu-miR-3077-star_st |
0.00085742 |
2.39784 |
Musmusculus |
mmu-miR-466i-5p_st |
0.00281848 |
2.44196 |
Musmusculus |
mmu-miR-3072-star_st |
0.000883966 |
2.44465 |
Musmusculus |
mmu-miR-762_st |
0.000828458 |
2.46548 |
Musmusculus |
mmu-miR-3102-star_st |
1.78E-05 |
2.51313 |
Musmusculus |
mmu-miR-466g_st |
0.000631176 |
2.54671 |
Musmusculus |
mmu-miR-149-star_st |
0.000486972 |
2.59069 |
Musmusculus |
mmu-miR-466h-3p_st |
0.0010598 |
2.59172 |
Musmusculus |
mmu-miR-574-5p_st |
0.00398314 |
2.64227 |
Musmusculus |
mmu-miR-188-5p_st |
0.00878782 |
2.83613 |
Musmusculus |
mmu-miR-466f-3p_st |
0.00355105 |
2.98595 |
Musmusculus |
mmu-miR-466i-3p_st |
0.0141958 |
2.99489 |
Musmusculus |
mmu-miR-3473_st |
0.00510505 |
3.03767 |
Musmusculus |
mmu-miR-346-star_st |
0.000254779 |
3.21634 |
Musmusculus |
mmu-miR-3473b_st |
0.00306257 |
3.48813 |
Musmusculus |
mmu-miR-467b-star_st |
0.0059904 |
3.93528 |
Musmusculus |
mmu-miR-714_st |
0.00335002 |
4.05587 |
Musmusculus |
mmu-miR-1934-star_st |
0.000496819 |
4.96148 |
Comparison of the common differentially expressed miRNAs in cbs–/– & cbs+/– and WT& diabetic (STZ) mouse retina
In order to explore miRNAs that are commonly changed with either complete or partial deletion of the cbs enzyme, data was loaded into the IPA (Ingenuity Pathway Analysis) for comparison analysis. The comparison of the 2 data sets showed the presence of 25 miRNAs that were commonly changed in both cbs–/– or cbs+/– mouse retina. Out of these 25 miRNAs, 18 miRNAs were differentially expressed in a consistent manner between the 2 groups (Figure 4A, highlighted); 8 miRNAs were downregulated in both groups (miR-16, miR-200, miR-205, miR-3064, miR-379, miR-431, miR-485 and miR-491) and 10 miRNAs were upregulated in both groups (miR-194, miR-1894, miR-211, miR-3072, miR- 3077, miR-4436, miR-5128, miR-669a, miR-669c and miR-6967). Microarray data results were validated by subjecting retinal RNA samples from cbs+/– and cbs+/+ mice to RT-PCR analysis (Figure 4B). Consistently with the microarray results, miR-205 (p value = 0.001), miR-206 (p value = 0.01) and miR-27 (p value = 0.04) were significantly downregulated in cbs+/– compared to control cbs+/+ (p value < 0.05). MiR-29a showed a tendency of downregulation but it did not reach the statistical significance. However, miR-199 (p value = 0.01) and miR-200 (p value = 0.004) in contrary to the microarray results were significantly upregulated in cbs+/– in comparison with the control cbs+/+ (p value < 0.05). In contrast, miR-31 was upregulated in the microarray data but was downregulated with RT-PCR validation (p value = 0.04). U6 was used as an internal control.
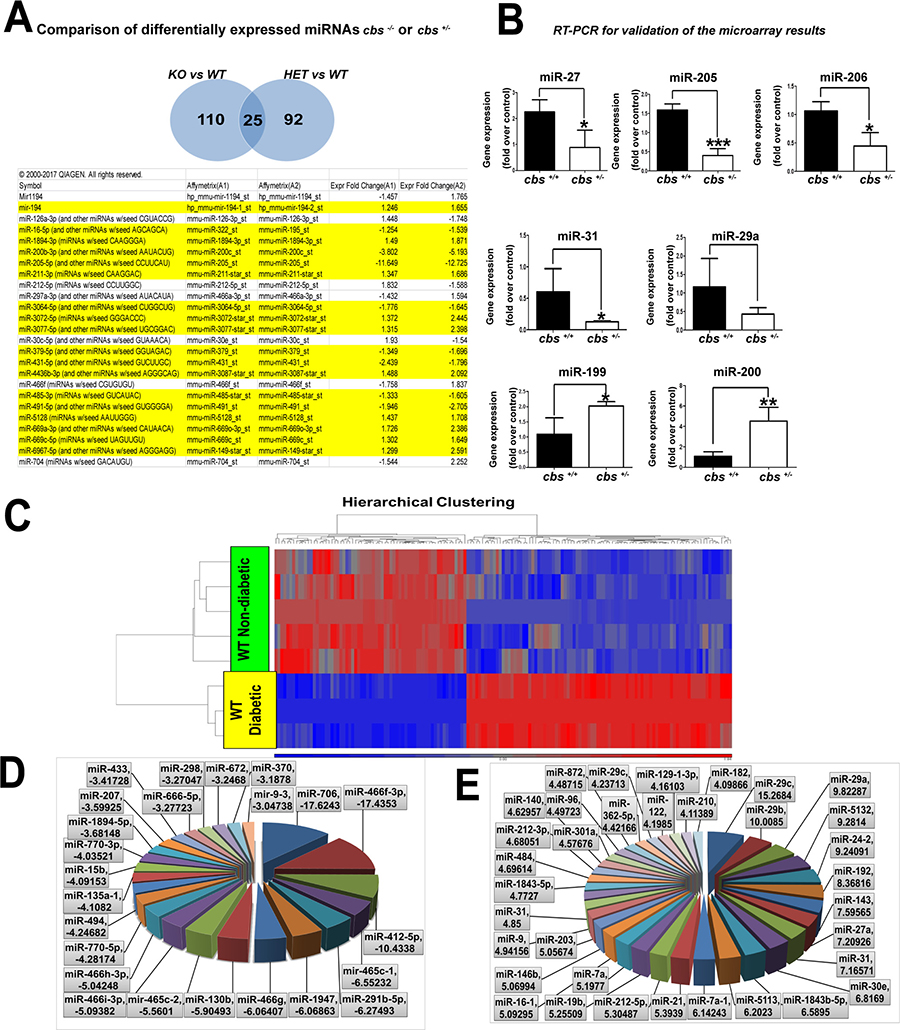
Figure 4: (A) Common miRNAs differentially expressed in cbs–/– or cbs+/–. IPA shows 25 miRNAs were commonly changed in both cbs–/– or cbs+/–. 18 miRNA (highlighted in yellow) were differentially expressed in a consistent manner between the 2 groups. (B) RT-PCR for validation of microarray results of miRNAs differentially expressed in cbs–/– or cbs+/– miRNAs (miR-205, miR-206 and miR-27, miR-31) were significantly downregulated in cbs+/– in comparison with the control. MiR-29a showed non-significant downregulation (*p < 0.05, ***p < 0.001). MiRNAs (miR-199 and miR-200) were significantly upregulated in cbs+/– in comparison with the control (*p < 0.05, **p < 0.01).Diabetes induced alterations of miRNA differential profile in mouse retina. (C) Heat map showing differentially expressed miRNAs in diabetic (STZ) mouse retina comparison with WT non-diabetic retina. Blue color indicates downregulated miRNAs and red color indicates upregulated miRNAs. (D) Pie chart showing miRNAs downregulated in diabetic mouse retina. (E) Pie chart showing miRNAs upregulated in diabetic mouse retina.
Differential expression profile of retinal miRNAs during diabetes
We aimed to detect the differential expression of retinal miRNAs under the influence of diabetes (Figure 4C–4E). WT animals were treated with streptozotocin (STZ) 50 mg/kg for five consecutive days. Diabetes was confirmed by measuring blood glucose level (mice with blood glucose level > 250 mg/dl were considered diabetic). Microarray analysis was performed for diabetic retinal RNA in comparison with the non-diabetic controls. 312 miRNAs were found to be changed after 1.5-fold change cutoff and p value < 0.05 (129 miRNAs were downregulated and 183 miRNAs were upregulated).
Shared miRNAs among cbs–/–, cbs+/– and diabetic mouse retina
To investigate the similarity in alteration of retinal miRNAs profile between HHcy and diabetes, IPA software was used to compare differential retinal miRNA profiles in cbs+/– vs the diabetic retinas (Figure 5A). The analysis showed that 37 miRNAs were commonly changed in both conditions. In the microarray data, 12 miRNAs were consistent in their change either with HHcy or diabetes; of which 4 miRNAs were downregulated in both groups (miR-16, miR-1983, miR-412 and miR-487) and 8 miRNAs (miR-194, miR-188, miR-1896, miR-467e, miR-504, miR-5110, miR-669k and miR-696) were upregulated in both groups. A triple comparison was also done that included cbs–/–, cbs+/– and STZ retinas, which revealed 6 miRNAs (miR-194, miR-16, miR-212, miR-30c, miR-5128 and miR-669c) that were commonly changed among cbs–/–, cbs+/– and diabetes; 2 of these miRNAs were consistently changed among the three groups (miR-194 was upregulated and miR-16 was downregulated).
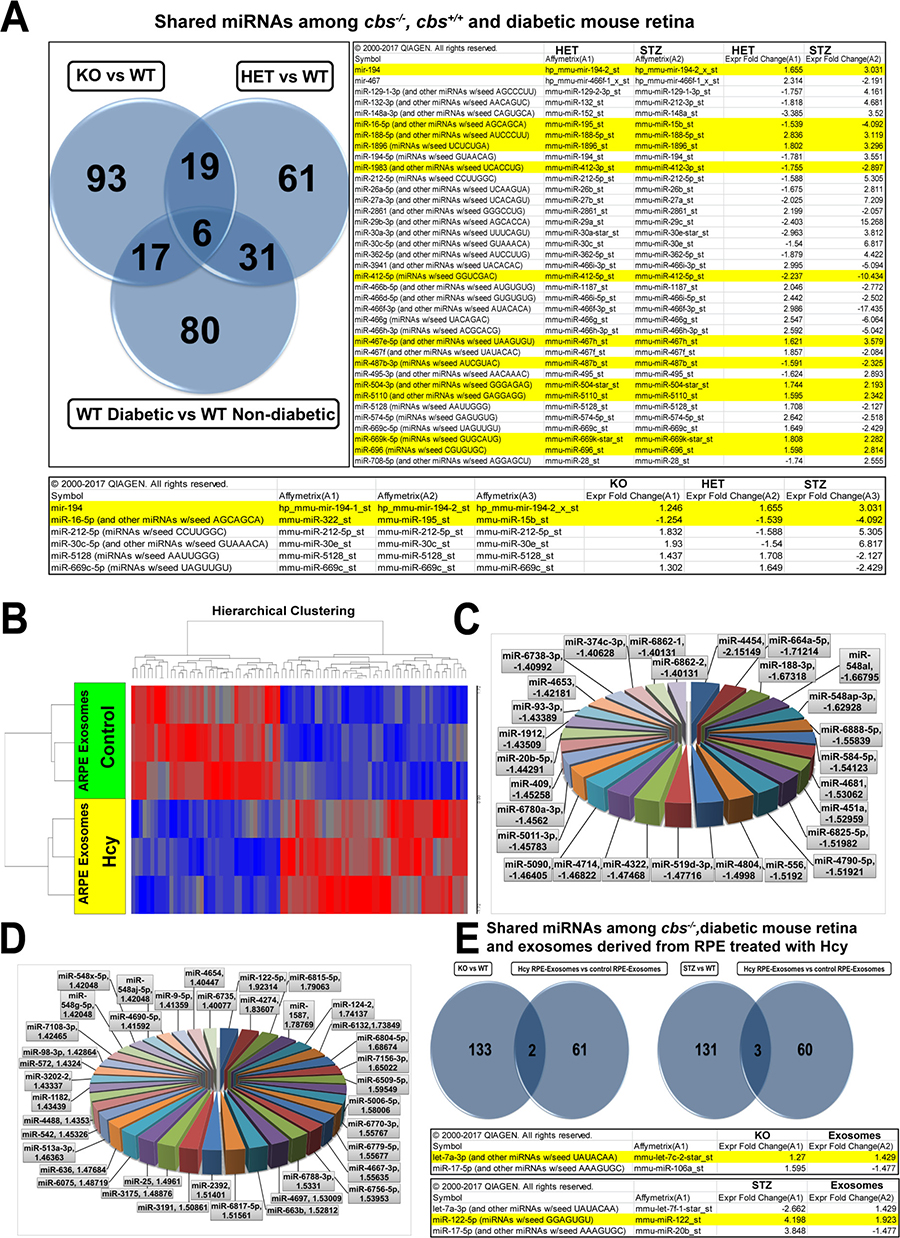
Figure 5 : (A) Common miRNAs differentially expressed in cbs–/– or cbs+/– and diabetic mouse retina. Comparison showed 37 miRNAs commonly changed in both cbs+/– and diabetic retinas. 12 miRNA (highlighted in yellow) were differentially expressed in a consistent manner between cbs+/– and diabetic groups. PA triple comparison showed 6 miRNAs that were commonly changed among cbs–/– , cbs+/– or diabetic mouse retina. Two miRNAs were differentially expressed in a consistent manner between the 3 groups. Differential expression profile of miRNAs in exosomes isolated from ARPE cells treated with Hcy. (B) Heat map showing differentially expressed miRNAs in exosomes isolated from ARPE cells treated with Hcy (100 μM for 24 hours) in comparison with exosomes isolated from vehicle treated cells. Blue color indicates downregulated miRNAs and red color indicates upregulated miRNAs. (C) Pie chart showing miRNAs downregulated in exosomes isolated from ARPE cells treated with Hcy. (D) Pie chart showing miRNAs upregulated in exosomes isolated from ARPE cells treated with Hcy. (E) Common miRNAs differentially expressed in cbs–/–, diabetic mouse retina and exosomes released from ARPE treated with Hcy. The left Venn diagram shows that 2 miRNAs were commonly differentially expressed in ARPE-exosomes and cbs–/– (miR-17-5p and let-7a-3p). The right Venn diagram shows that 3miRNAs were commonly differentially expressed in ARPE-exosomes and diabetic mouse retina (miR-17-5p, let-7a-3p and miR-122-5p).
HHcy induces alteration of miRNAs similar to AMD
We have reported that HHcy induces AMD-like changes in mouse retina [4]. Therefore, the current work aimed to check if HHcy induces changes in miRNAs similar to what have been reported to be implicated in the development of AMD [69]. Interestingly, miRNAs have also been shown to play critical roles in different pathways in a laser-induced choroidal neovascularization mouse model [70]. miR-205, miR-27, miR-29 and miR-31 were significantly changed in our cbs+/– retina microarray and were also reported to be involved in AMD. The study revealed downregulation of miR-205, miR-27, miR-31, and miR-29 in the cbs+/– retinas. MiR-31 was reported to be significantly decreased in an ischemia-induced mouse model of retinal neovascularization and in a laser-induced mouse model of choroidal neovascularization in the absence of ischemia [71]. While intraocular injection with pre-miR-31 significantly reduced the size of the choroidal neovascular lesions. A recent study also demonstrated that knockdown of miR-27, which downregulates the antiangiogenic factors Sprouty2 and semaphorin 6A (Sema6A), is protective against laser-induced choroidal neovascularization [70].
Differentially expressed miRNAs in exosomes isolated from Hcy-treated ARPE
Exosomes released from RPE represent a very important and innovative way of retinal intercellular communications. The outer blood-retinal barrier integrity is formed by tight junctions among retinal pigment epithelial cells [72, 73]. The outer BRB is mainly affected in AMD. To investigate if HHcy induces changes in the miRNA cargo of RPE-released exosomes as a possible early epigenetic modification tool that can impact the retinal barrier function, conditioned media of ARPE-19 cells treated with Hcy 100 μM for 24 hr was collected and exosomes were isolated using the appropriate protocol. The concentration and size of the isolated exosomes were determined using NTA as indicated in the methods section. Total extracted RNA from the isolated exosomes and purity of the extracted RNA was validated using the Bioanalyzer chip (Supplementary Figure 1). Following exosomal RNA isolation, miRNA microarray analysis was performed. The analysis revealed that Hcy altered RPE-exosomal-miRNA content. 88 miRNAs were identified (39 miRNAs were downregulated and 49 miRNAs were upregulated) with1.4-fold change cutoff and p < 0.05 (Figure 5B–5D and Table 3A and 3B)
Table 3A: Downregulated miRNAs inARPE- derived exosomes
Species Scientific Name |
Transcript ID |
p-value (HCY vs. ARPE_cont) |
Fold-Change (HCY vs. ARPE_cont) |
|---|---|---|---|
Homo sapiens |
hsa-miR-4454 |
0.00806874 |
–2.15149 |
Homo sapiens |
hsa-miR-664a-5p |
0.00933842 |
–1.71214 |
Homo sapiens |
HBII-316 |
0.0371439 |
–1.6763 |
Homo sapiens |
hsa-miR-188-3p |
0.0050997 |
–1.67318 |
Homo sapiens |
hsa-mir-548al |
0.0409855 |
–1.66795 |
Homo sapiens |
hsa-miR-548ap-3p |
0.00270826 |
–1.62928 |
Homo sapiens |
hsa-miR-6888-5p |
0.0244117 |
–1.55839 |
Homo sapiens |
hsa-miR-584-5p |
0.00101538 |
–1.54123 |
Homo sapiens |
hsa-miR-4681 |
0.0273394 |
–1.53062 |
Homo sapiens |
hsa-miR-451a |
0.0147813 |
–1.52959 |
Homo sapiens |
HBI-36 |
0.0477323 |
–1.51987 |
Homo sapiens |
hsa-miR-6825-5p |
0.0137077 |
–1.51982 |
Homo sapiens |
hsa-miR-4790-5p |
0.0229827 |
–1.51921 |
Homo sapiens |
hsa-mir-556 |
0.00579586 |
–1.5192 |
Homo sapiens |
hsa-mir-4804 |
0.018718 |
–1.4998 |
Homo sapiens |
U73a |
0.0395006 |
–1.4917 |
Homo sapiens |
hsa-miR-519d-3p |
0.00303684 |
–1.47716 |
Homo sapiens |
hsa-mir-4322 |
0.0277639 |
–1.47468 |
Homo sapiens |
hsa-mir-4714 |
0.02808 |
–1.46822 |
Homo sapiens |
U94 |
0.0279962 |
–1.46617 |
Homo sapiens |
hsa-mir-5090 |
0.0181336 |
–1.46405 |
Homo sapiens |
hsa-miR-5011-3p |
0.010633 |
–1.45783 |
Homo sapiens |
hsa-miR-6780a-3p |
0.04771 |
–1.4562 |
Homo sapiens |
hsa-mir-409 |
0.0371396 |
–1.45258 |
Homo sapiens |
hsa-miR-20b-5p |
0.0469542 |
–1.44291 |
Homo sapiens |
hsa-miR-1912 |
0.00969643 |
–1.43509 |
Homo sapiens |
hsa-miR-93-3p |
0.023408 |
–1.43389 |
Homo sapiens |
hsa-mir-4653 |
0.0162663 |
–1.42181 |
Homo sapiens |
hsa-miR-6738-3p |
0.0410678 |
–1.40992 |
Homo sapiens |
hsa-miR-374c-3p |
0.0481363 |
–1.40628 |
Homo sapiens |
hsa-mir-6862-1 |
0.0233446 |
–1.40131 |
Homo sapiens |
hsa-mir-6862-2 |
0.0233446 |
–1.40131 |
Table 3B: Upregulated miRNAs in ARPE- derived exosomes
Species Scientific Name |
Transcript ID |
p-value (HCY vs. ARPE_cont) |
Fold-Change (HCY vs. ARPE_cont) |
|---|---|---|---|
Homo sapiens |
hsa-mir-6735 |
0.0419018 |
1.40077 |
Homo sapiens |
hsa-mir-4654 |
0.0469582 |
1.40447 |
Homo sapiens |
hsa-miR-9-5p |
0.0216397 |
1.41359 |
Homo sapiens |
hsa-miR-4690-5p |
0.0403177 |
1.41592 |
Homo sapiens |
hsa-miR-548g-5p |
0.0342995 |
1.42048 |
Homo sapiens |
hsa-miR-548x-5p |
0.0342995 |
1.42048 |
Homo sapiens |
hsa-miR-548aj-5p |
0.0342995 |
1.42048 |
Homo sapiens |
hsa-miR-7108-3p |
0.0429707 |
1.42465 |
Homo sapiens |
hsa-miR-98-3p |
0.021263 |
1.42864 |
Homo sapiens |
hsa-mir-572 |
0.0333677 |
1.4324 |
Homo sapiens |
hsa-mir-3202-2 |
0.00783197 |
1.43337 |
Homo sapiens |
hsa-mir-1182 |
0.0404323 |
1.43439 |
Homo sapiens |
hsa-mir-4488 |
0.0230517 |
1.4353 |
Homo sapiens |
hsa-mir-542 |
0.0407305 |
1.45326 |
Homo sapiens |
hsa-miR-513a-3p |
0.0100636 |
1.46363 |
Homo sapiens |
hsa-miR-636 |
0.0252418 |
1.47684 |
Homo sapiens |
hsa-miR-6075 |
0.016306 |
1.48719 |
Homo sapiens |
hsa-mir-3175 |
0.0286791 |
1.48876 |
Homo sapiens |
hsa-mir-25 |
0.0285173 |
1.4961 |
Homo sapiens |
hsa-mir-3191 |
0.0252016 |
1.50861 |
Homo sapiens |
hsa-miR-2392 |
0.0117701 |
1.51401 |
Homo sapiens |
hsa-miR-6817-5p |
0.0422369 |
1.51561 |
Homo sapiens |
hsa-mir-663b |
0.0437883 |
1.52812 |
Homo sapiens |
hsa-mir-4697 |
0.0335516 |
1.53009 |
Homo sapiens |
hsa-miR-6788-3p |
0.0261082 |
1.5331 |
Homo sapiens |
hsa-miR-6756-5p |
0.00965285 |
1.53953 |
Homo sapiens |
hsa-miR-4667-3p |
0.0251413 |
1.55635 |
Homo sapiens |
hsa-miR-6779-5p |
0.0277697 |
1.55677 |
Homo sapiens |
hsa-miR-6770-3p |
0.0268935 |
1.55767 |
Homo sapiens |
hsa-miR-5006-5p |
0.0408652 |
1.58006 |
Homo sapiens |
hsa-miR-6509-5p |
0.0408825 |
1.59549 |
Homo sapiens |
hsa-miR-7156-3p |
0.0350715 |
1.65022 |
Homo sapiens |
hsa-miR-6804-5p |
0.00930951 |
1.68674 |
Homo sapiens |
hsa-miR-6132 |
0.0261594 |
1.73849 |
Homo sapiens |
hsa-mir-124-2 |
0.029337 |
1.74137 |
Homo sapiens |
hsa-miR-1587 |
0.00634675 |
1.78769 |
Homo sapiens |
hsa-miR-6815-5p |
0.0313742 |
1.79063 |
Homo sapiens |
hsa-miR-4274 |
0.0421541 |
1.83607 |
Homo sapiens |
hsa-miR-122-5p |
0.0478945 |
1.92314 |
Comparison for shared miRNAs among cbs–/–, diabetic mouse retina and exosomes released from ARPE treated with Hcy
Different datasets were compared to check if there was a correlation between exosomal-miRNAs released from ARPE under the influence of Hcy and miRNAs of either cbs–/– or diabetic mouse retina. The comparison showed that ARPE-exosomes shared 2 differentially expressed miRNAs with cbs–/– (miR-17-5p and let-7a-3p) and shared 3 differentially expressed miRNAs with diabetic retina (miR-17-5p, let-7a-3p and miR-122-5p) (Figure 5E).
IPA (ingenuity pathway analysis)
IPA showed that differentially expressed cbs+/– retinal miRNAs are involved in metabolic pathways, suggesting new epigenetically affected mechanisms (as ER stress, oxidative stress, autophagy and tight junctions signaling pathways). The analysis showed miRNAs that were related to ER stress pathway (let-7f, miR-351, miR-127, miR-133a, miR-195, miR-214 and miR-503), suggesting CASP3, CASP7, XBP1, ATF6 and ATF4 as possible target genes for these miRNAs (Table 4). Furthermore, the pathway analysis links a group of miRNAs that were differentially expressed in cbs+/– retina to oxidative stress pathway such as miR-205, miR-206, miR-217, miR-30, miR-27, miR-214 and miR-3473. These miRNAs target genes that are involved in the oxidative stress pathway such as PRKCE, IRS1, HACD3, DNAJB1, FGFR3, PIK3R2, AKT1 and PTPN11 as we can see in (Table 4). Other miRNAs were linked to the hypoxia signaling pathway, for instance, miR-205, miR-214, miR-217, miR-27, miR-29, miR-30 and miR-31. These miRNAs are targeting genes implicated in hypoxia signaling such as PTEN, VEGFA, ATF4, IRS1, PIK3R1 and HIF1A (Table 5). Autophagy is emerging as a critical player in the pathogenesis of diseases like DR and AMD [74, 75]. Our data analysis revealed the association of some of the differentially expressed miRNAs in the cbs+/– retina with the autophagy pathway. MiR-206, miR-133, miR-199, miR-100 and miR-195 were implicated in the autophagy pathway targeting BCL2, MTOR and SQSTM1 as possible autophagy gene targets (Table 6). Hcy also induces alteration of miRNAs related to tight junctions signaling such as miR-128, miR-132, miR-133, miR-195, miR-3473, miR-19, miR-200, miR-205, miR-214, miR-217, miR-23, miR-26, miR-29, miR-30, miR-31 AND miR-690. These miRNAs can target TJP1, TGFBR1, RHOA, CLDN12, PTEN and CDC42 which are involved in the tight junctions signaling pathway (Table 7). Moreover, the IPA analysis showed miRNAs that differentially expressed in cbs+/– retina being involved in VEGF signaling, apoptosis, and gap junctions signaling (Table 8).
Table 4: Pathway analysis 1
miRNA (HET) |
Target genes |
Fold change |
|---|---|---|
miRNAs related to ER stress |
||
mmu-let-7f_st |
CASP3 |
–1.552 |
mmu-miR-351_st |
CASP7 |
–1.499 |
mmu-miR-127_st |
XBP1 |
–1.41 |
mmu-miR-133a_st |
CASP9 |
–3.717 |
mmu-miR-195_st |
ATF6 |
–1.539 |
mmu-miR-195_st |
HSP90B1 |
–1.539 |
mmu-miR-214_st |
ATF4 |
–2.004 |
mmu-miR-503_st |
ATF6 |
1.256 |
miRNAs related to Nrf2 related oxidative stress |
||
mmu-miR-205_st |
PRKCE |
–12.725 |
mmu-miR-206_st |
DNAJB1, HACD3, PPIB |
–4.864 |
mmu-miR-217_st |
IRS1 |
–3.008 |
mmu-miR-30a-star_st |
PIK3C2A |
–2.963 |
mmu-miR-29a_st |
PIK3R1 |
–2.403 |
mmu-miR-27b_st |
GRB2 |
–2.025 |
mmu-miR-214_st |
ATF4 |
–2.004 |
mmu-miR-100_st |
FGFR3 |
–1.78 |
mmu-miR-126-3p_st |
IRS1, PIK3R2 |
–1.748 |
mmu-miR-150_st |
BACH1 |
–1.652 |
mmu-miR-487b_st |
MAP2K4 |
–1.591 |
mmu-let-7f_st |
HMOX1, HRAS, KRAS, NRAS, Ras |
–1.552 |
mmu-miR-30c_st |
JUN |
–1.54 |
mmu-miR-195_st |
DNAJB4, FGFR1, GRB2, GSTM4, HMOX1, JUN, JUN/JUNB/JUND,MAP2K1, MAP2K4, MAPK3, RAF1, SQSTM1 |
–1.539 |
mmu-miR-351_st |
MAP2K7 |
–1.499 |
mmu-miR-449a_st |
MAP2K1 |
–1.416 |
mmu-miR-25_st |
MAP2K4 |
–1.394 |
mmu-miR-146a_st |
TLR9 |
–1.33 |
mmu-miR-494_st |
HMOX1 |
1.377 |
mmu-miR-335-5p_st |
PTPN11 |
1.997 |
mmu-miR-3473_st |
AKT1 |
3.038 |
Table 5: Pathway analysis 2
miRNA (HET) |
Target genes |
Fold change |
|---|---|---|
miRNAs related to HIF1a and Hypoxia |
||
mmu-let-7f_st |
CSNK1D, HRAS, KRAS, NRAS, Ras |
–1.552 |
mmu-miR-100_st |
FGFR3 |
–1.78 |
mmu-miR-125b-2-3p_st |
TP53 |
–1.495 |
mmu-miR-351_st |
TP53, UBE2I |
–1.499 |
mmu-miR-126-3p_st |
IRS1, PIK3R2, VEGFA |
–1.748 |
mmu-miR-132_st |
MMP9 |
–1.818 |
mmu-miR-146a_st |
MMP16, NOS2, TLR9 |
–1.33 |
mmu-miR-150_st |
VEGFA |
–1.652 |
mmu-miR-195_st |
FGFR1, GRB2, HSP90B1, JUN, MAPK3, UBE2S, VEGFA |
–1.539 |
mmu-miR-204_st |
MMP9 |
–1.42 |
mmu-miR-205_st |
PTEN, VEGFA |
–12.725 |
mmu-miR-214_st |
ATF4 |
–2.004 |
mmu-miR-214_st |
PTEN |
–2.004 |
mmu-miR-217_st |
IRS1, PTEN |
–3.008 |
mmu-miR-23a_st |
PTEN |
–1.492 |
mmu-miR-26b_st |
PTEN |
–1.675 |
mmu-miR-27b_st |
GRB2, MMP13 |
–2.025 |
mmu-miR-29a_st |
PIK3R1, PTEN |
–2.403 |
mmu-miR-30a-star_st |
PIK3C2A |
–2.963 |
mmu-miR-30c_st |
JUN, TP53, UBE2I |
–1.54 |
mmu-miR-31_st |
HIF1A |
2.492 |
mmu-miR-335-5p_st |
PTPN11 |
1.997 |
mmu-miR-449a_st |
CREB1, TP53, VEGFA |
–1.416 |
mmu-miR-3107_st |
PTEN |
–1.461 |
mmu-miR-494_st |
PTEN |
1.377 |
mmu-miR-504_st |
VEGFA |
–1.445 |
mmu-miR-25_st |
PTEN |
–1.394 |
Table 6: Pathway analysis 3
miRNA (HET) |
Target genes |
Fold change |
|---|---|---|
miRNAs related to Autophagy |
||
mmu-let-7f_st |
VPS39 |
–1.552 |
mmu-miR-206_st |
BCL2 |
–4.864 |
mmu-miR-206_st |
CTSC |
–4.864 |
mmu-miR-100_st |
MTOR |
–1.78 |
mmu-miR-133a_st |
RB1CC1 |
–3.717 |
mmu-miR-143_st |
BCL2 |
–1.073 |
mmu-miR-145_st |
LAMP2 |
–1.137 |
mmu-miR-153_st |
BCL2 |
–1.179 |
mmu-miR-155_st |
ATG3 |
–1.133 |
mmu-miR-195_st |
ATG9A |
–1.539 |
mmu-miR-195_st |
BCL2 |
–1.539 |
mmu-miR-195_st |
SQSTM1 |
–1.539 |
mmu-miR-106b_st |
BCL2 |
–1.212 |
mmu-miR-181b_st |
BCL2 |
–1.207 |
mmu-miR-199a-3p_st |
MTOR |
–3.425 |
mmu-miR-204_st |
CTSC |
–1.42 |
mmu-miR-218_st |
CTSB |
–1.152 |
mmu-miR-296-5p_st |
BCL2 |
–1.172 |
mmu-miR-30c_st |
BECN1 |
–1.54 |
mmu-miR-449a_st |
BCL2 |
–1.416 |
Table 7: Pathway analysis 4
miRNA (HET) |
Target genes |
Fold change |
|---|---|---|
miRNAs related to tight junctions signaling |
||
mmu-let-7f_st |
TGFBR1 |
–1.552 |
mmu-miR-128_st |
SNAP25, TGFBR1, |
–2.319 |
mmu-miR-132_st |
TJP1 |
–1.818 |
mmu-miR-133a_st |
RHOA |
–3.717 |
mmu-miR-195_st |
CLDN12, JUN, NAPG, PPP2R5C,VTI1B |
–1.539 |
mmu-miR-3473_st |
AKT1, CDC42, RHOA |
3.038 |
mmu-miR-19b_st |
PTEN |
1.459 |
mmu-miR-200c_st |
PTEN |
–5.193 |
mmu-miR-205_st |
PTEN |
–12.725 |
mmu-miR-214_st |
PTEN |
–2.004 |
mmu-miR-217_st |
PTEN |
–3.008 |
mmu-miR-23a_st |
PTEN |
–1.492 |
mmu-miR-26b_st |
PTEN, TGFBR2 |
–1.675 |
mmu-miR-29a_st |
CDC42, PTEN, TGFB3 |
–2.403 |
mmu-miR-30c_st |
JUN, NAPG, PTPA |
–1.54 |
mmu-miR-31_st |
PPP2R2A |
2.492 |
mmu-miR-3107_st |
PTEN |
–1.461 |
mmu-miR-494_st |
PTEN |
1.377 |
mmu-miR-690_st |
CEBPA |
1.831 |
mmu-miR-9_st |
NFKB1 |
–1.709 |
mmu-miR-25_st |
PTEN |
–1.394 |
Table 8: Pathway analysis 5
miRNA (HET) |
Target genes |
Fold change |
|---|---|---|
miRNAs related to VEGF signaling |
||
mmu-let-7f_st |
BCL2L1, HRAS, KRAS, NRAS, Ras |
–1.552 |
mmu-miR-206_st |
BCL2 |
–4.864 |
mmu-miR-100_st |
FGFR3 |
–1.78 |
mmu-miR-351_st |
ELAVL1 |
–1.499 |
mmu-miR-126-3p_st |
IRS1, PIK3R2, VEGFA |
–1.748 |
mmu-miR-146a_st |
TLR9 |
–1.33 |
mmu-miR-150_st |
VEGFA |
–1.652 |
mmu-miR-195_st |
BCL2, FGFR1, GRB2, MAP2K1, MAPK3, RAF1, VEGFA |
–1.539 |
mmu-miR-3473_st |
AKT1 |
3.038 |
mmu-miR-199a-5p_st |
HIF1A |
–1.792 |
mmu-miR-200c_st |
PLCG1 |
–5.193 |
mmu-miR-204_st |
SHC1 |
–1.42 |
mmu-miR-205_st |
VEGFA |
–12.725 |
mmu-miR-217_st |
IRS1 |
–3.008 |
mmu-miR-27b_st |
FOXO1, GRB2, PXN |
–2.025 |
mmu-miR-29a_st |
PIK3R1 |
–2.403 |
mmu-miR-30a-star_st |
PIK3C2A |
–2.963 |
mmu-miR-31_st |
HIF1A |
2.492 |
mmu-miR-335-5p_st |
PTPN11, PXN |
1.997 |
mmu-miR-449a_st |
BCL2, MAP2K1, VEGFA |
–1.416 |
mmu-miR-3107_st |
FOXO1 |
–1.461 |
mmu-miR-491_st |
BCL2L1 |
–2.705 |
mmu-miR-504_st |
VEGFA |
–1.445 |
mmu-miR-9_st |
FOXO1 |
–1.709 |
miRNAs related to Apoptosis |
||
mmu-miR-206_st |
BCL2 |
–4.864 |
mmu-miR-125b-2-3p_st |
BAK1, BAX, TP53 |
–1.495 |
mmu-miR-351_st |
BAK1, CASP6, CASP7, MAP2K7, TP53 |
–1.499 |
mmu-miR-132_st |
CAPN8 |
–1.818 |
mmu-miR-133a_st |
CASP9, MCL1 |
–3.717 |
mmu-miR-146a_st |
CHUK |
–1.33 |
mmu-miR-195_st |
BCL2, RAF1, MAP2K1, MAP2K4, MAPK3, MCL1 |
–1.539 |
mmu-miR-19b_st |
BCL2L11 |
1.459 |
mmu-miR-200c_st |
PLCG1 |
–5.193 |
mmu-miR-205_st |
PRKCE |
–12.725 |
mmu-miR-214_st |
BAX |
–2.004 |
mmu-miR-26b_st |
BAK1 |
–1.675 |
mmu-miR-27b_st |
BAX |
–2.025 |
mmu-miR-29a_st |
MCL1 |
–2.403 |
mmu-miR-30c_st |
MAP4K4, TP53 |
–1.54 |
mmu-miR-449a_st |
BCL2, MAP2K1, TP53 |
–1.416 |
mmu-miR-382_st |
CAPN8 |
–1.447 |
mmu-miR-487b_st |
MAP2K4 |
–1.591 |
mmu-miR-491_st |
BCL2L1 |
–2.705 |
mmu-miR-9_st |
NFKB1 |
–1.709 |
mmu-miR-25_st |
BCL2L11, MAP2K4 |
–1.394 |
miRNAs related to gap junctions signaling |
||
mmu-miR-206_st |
EGFR |
–4.864 |
mmu-miR-100_st |
FGFR3 |
–1.78 |
mmu-miR-126-3p_st |
IRS1, PIK3R2 |
–1.748 |
mmu-miR-200a_st |
CTNNB1 |
1.157 |
mmu-miR-195_st |
EGFR, FGFR1, GRB2, MAP2K1, MAPK3, RAF1 |
–1.539 |
mmu-miR-3473_st |
AKT1 |
3.038 |
mmu-miR-200c_st |
PLCG1 |
–5.193 |
mmu-miR-205_st |
PRKCE |
–12.725 |
mmu-miR-217_st |
IRS1 |
–3.008 |
mmu-miR-27b_st |
GRB2 |
–2.025 |
mmu-miR-29a_st |
PIK3R1,SP1, TUBB2A |
–2.403 |
mmu-miR-30a-star_st |
PIK3C2A, TUBA1A |
–2.963 |
mmu-miR-30c_st |
GNAI2, PPP3CA |
–1.54 |
mmu-miR-335-5p_st |
PTPN11 |
1.997 |
mmu-miR-449a_st |
MAP2K1 |
–1.416 |
HHcy induces dysregulation of miRNAs targeting DNMTs or HDACs
To study the possible HHcy-induced interaction between miRNAs and DNMTs/HDACs enzymes, IPA pathway building tools were used as a powerful tool to predict miRNAs that are targeting different types of DNMTs or HDACs. MiRNA node was used to analyze DNMT1, DNMT2, DNMT3, DNMT4, HDAC1, HDAC2, HDAC3, HDAC4, HDAC5, HDAC6, HDAC7, HDAC8, HDAC9, HDAC10 and HDAC11 molecules. The analysis revealed miRNAs targeting these enzymes (Table 9A–9B). Further analysis identified that HHcy induced downregulation of a number of miRNAs that target DNMTs or HDACs (Figure 6A and 6B). Among the downregulated miRNAs; miR-29 was found to target DNMT1, DNMT3A, DNMT3B and HDAC4),while miR-30 targets DNMT3A, HDAC2, HDAC3, HDAC6 and HDAC10, miR-379 targets DNMT1 and HDAC3 and miR-491 (miR-491 targets DNMT3B and HDAC7.
Table 9A: miRNAs targeting DNMTs
DNMTs |
miRNAs |
|---|---|
DNMT1 |
miR-1278, mir-133, miR-148a-3p, miR-185-5p, miR-21-3p, mir-29, miR-3529-3p, miR-379-5p, miR-3922-5p, miR-4450, miR-4451, miR-450b-3p, miR-4536-5p, miR-4650-3p, miR-4717-5p, miR-5003-5p, miR-548ae-3p, miR-5700, miR-6782-5p, miR-6857-5p, miR-6888-5p, miR-887-3p |
DNMT2 |
miR-1226-3p, miR-1246, miR-1252-5p, miR-1290, miR-146a-3p, miR-32-3p, miR-4668-3p, miR-4717-3p, miR-4733-3p, miR-4802-3p, miR-490-5p, miR-5000-5p, miR-5007-3p, miR-5096, miR-513a-3p, miR-591, miR-6817-3p, miR-8080 |
DNMT3A |
miR-101-3p, miR-1183, miR-122, miR-1224-3p, miR-1260a, miR-143-3p, miR-181a-1-3p, miR-1900, miR-196b-3p, miR-199, miR-199a-3p, miR-219b-5p, miR-29, miR-29b-3p, miR-29c-5p, miR-3065-3p, miR-3083-5p, miR-30c-5p, miR-3117-3p, miR-3169, miR-3183, miR-3202, miR-331-3p, miR-3547, miR-361, miR-3612, miR-363-5p, miR-381-3p, miR-3911, miR-4256, miR-4290, miR-4300, miR-4307, miR-4314, miR-4485-5p, miR-4525, miR-4687-5p, miR-4694-5p, miR-4704-3p, miR-4708-3p, miR-4716-3p, miR-4723-5p, miR-4740-5p, miR-4747-5p, miR-4768-3p, miR-5010-3p, miR-5196-3p, miR-532-3p, miR-548as-3p, miR-598-3p, miR-6078, miR-6084, miR-670-3p, miR-6741-5p, miR-6772-3p, miR-6776-5p, miR-6780a-3p, miR-6801-3p, miR-6804-3p, miR-6825-5p, miR-6861-5p, miR-6881-3p, miR-6895-3p, miR-6929-5p, miR-6976-5p, miR-7032-3p, miR-7110-3p, miR-718, miR-7515, miR-8068 |
DNMT3B |
miR-1180-5p, miR-1204, miR-124-3p, miR-1249-5p, miR-1275, miR-1283, miR-1301-3p, miR-148, miR-148a-3p, miR-185-5p, miR-200b-3p, miR-2277-3p, miR-29, miR-296-5p, miR-299a-3p, miR-29a-5p, miR-29b-3p, miR-3103-5p, miR-3144-5p, miR-3157-5p, miR-324-3p, miR-339-5p, miR-349, miR-3547, miR-3618, miR-3651, miR-3921, miR-4271, miR-4310 miR-432, miR-4323, miR-4434, miR-4440, miR-4472, miR-4525, miR-4660, miR-4668-5p, miR-4676-5p, miR-4682, miR-4694-5p, miR-4758-3p,miR-4771, miR-4800-3p, miR-491-5p, miR-5129-5p, miR-5192, miR-548ag, miR-550a-5p, miR-5584-5p, miR-5682, miR-5684, miR-6132, miR-625-5p, miR-6716-5p, miR-6724-5p, miR-6732-5p, miR-6734-5p, miR-6742-3p, miR-6742-5p, miR-6747-5p, miR-6752-5p, miR-6755-5p, miR-6777-5p, miR-6801-3p, miR-6811-3p, miR-6834-5p, miR-6839-3p, miR-6851-3p, miR-6852-5p, miR-6867-3p, miR-6873-5p, miR-7976, miR-874-3p, miR-885-3p, miR-938, miR-939-3p |
DNMT3L |
miR-1264, miR-3551-5p, miR-3589 miR-375-3p miR-3915, miR-3928-3p, miR-4423-5p, miR-4677-5p, miR-495-5p, miR-6124, miR-6739-3p, miR-6837-3p |
Table 9B: miRNAs targeting HDACs
HDACs |
miRNAs |
|---|---|
HDAC1 |
miR-1, miR-1185-5p, miR-1188-3p, miR-1304-5p, miR-146, miR-188-5p, miR-1914-3p, miR-2110, miR-214-3p, miR-218-2-3p, miR-3121-3p, miR-3126-5p, miR-3127-3p, miR-3150a-3p, miR-3200-5p, miR-34a-5p, miR-3614-5p, miR-3616-3p, miR-3919, miR-423-5p, miR-4266, miR-4269, miR 4271, miR-4284, miR-4292, miR-4293, miR-4433a-3p, miR-4434, miR-4436b-3p, miR-4450, miR-450b-3p, miR-4514, miR-4667-5p, miR-4672, miR-4681, miR-4690-5p, miR-4747-5p, miR-4768-3p, miR-4786-3p miR-500b-3p,miR-5090, miR-512-5p, miR-520d-5p, miR-5680, miR-584-5p, miR-593-5p, miR-6165, miR-671-5p, miR-6721-5p, miR-6727-5p, miR-6734-5p, miR-6768-5p, miR-6809-5p, miR-6810-5p, miR-6815-5p, miR-6834-5p, miR-6852-5p, miR-6857-5p, miR-6888-5p, miR-6894-5p, miR-758-5p, miR-7976, miR-8075, miR-889-5p, miR-92a-1-5p |
HDAC2 |
mir-145, miR-155,miR-1668, miR-192-3p, miR-195-3p, miR-3087-3p, miR-30a-3p, miR-3165, miR-3682-5p, miR-383-5p, miR-3977, miR-4275, miR-4328, miR-4422, miR-4434, miR-4480, miR-4531, miR-455-3p, miR-4753-5p, miR-4786-3p, miR-548ad-3p, miR-5581-3p, miR-580-5p, miR-6872-3p, miR-6880-5p, miR-6885-3p, miR-7843-3p, miR-8071 |
HDAC3 |
miR-100-5p, miR-1225-3p, miR-125a-3p, miR-1261, miR-1273h-5p, miR-1298-3p, miR-1302, miR-146a-5p, miR-1839-5p, miR-1910-5p, miR-1915-3p, miR-1972, miR-200b-3p, miR-204-3p, miR-216b-5p, miR-217, miR-30c-1-3p, miR-3127-3p, miR-3162-5p, miR-3189-3p, miR-324-3p, miR-326, miR-328-5p, miR-330-5p, mir-335,miR-3584-5p, miR-3594-5p, miR-362-5p, miR-384,miR-3913-5p, miR-3934-5p, miR-3936,miR-4264, miR-4292, miR-4308, miR-4314, miR-4433b-5p, miR-4446-5p, miR-452-3p, miR-455-3p, miR-4650-5p, miR-4688, miR-4773, miR-483-3p, miR-504-3p, miR-505-5p, miR-589-3p, miR-589-5p, miR-619-5p, miR-6510-3p, miR-6510-5p, miR-6512-3p, miR-6515-3p, miR-6729-3p, miR-6749-3p,miR-6758-5p, miR-6769a-3p, miR-6809-5p, miR-6825-5p, miR-6827-5p, miR-6828-5p, miR-6834-3p, miR-6846-5p, miR-6859-3p, miR-6861-5p, miR-6870-3p, miR-6873-3p, miR-6878-5p, miR-6929-5p, miR-6967-5p, miR-6976-5p, miR-7064-3p, miR-7110-3p, miR-766-3p, miR-766-5p, mir-8 |
HDAC4 |
mir-1,miR-1-3p, mir-10,miR-1181, miR-1225-3p, miR-124-3p, miR-132-5p, mir-140,miR-140-5p, miR-187-3p, miR-1908-3p, miR-1913, mir-22,miR-29b-3p, mir-302,miR-3064-3p, miR-3072, miR-3144-3p, miR-3186-5p, miR-370-3p, miR-3943, miR-4258, miR-4449, miR-4462, miR-4681, miR-487b-3p, miR-5008-3p, miR-602, miR-6717-5p, miR-6759-5p, miR-6774-3p, miR-6814-3p, miR-6820-5p, miR-6889-3p, miR-7108-3p, miR-7161-3p, miR-8,miR-8068, miR-9-3p, miR-92b-5p, miR-937-3p |
HDAC5 |
miR-124-3p,miR-2861, miR-3118, miR-3164, miR-6818-5p, miR-9-3p |
HDAC6 |
miR-1181, miR-1207-3p, miR-1227-5p, miR-1285-3p, miR-1915-5p, miR-2392, miR-3072, miR-30b-3p,miR-3150a-3p,miR-3175, miR-3200-3p, miR-337-3p, miR-3473b, miR-3677-3p, miR-378g, miR-4258, miR-433-3p, miR-4438, miR-4659a-5p, miR-4684-3p, miR-4690-5p, miR-4723-5p, miR-4749-3p, miR-4763-5p, miR-4764-3p, miR-506-5p, miR-5095, miR-5135, miR-518a-5p, miR-5195-5p, miR-6131, miR-6721-5p, miR-6762-5p, miR-6872-3p, miR-6887-3p, miR-762 |
HDAC7 |
miR-1228-5p,miR-1237-5p, miR-1249-5p, miR-1275, miR-140-5p, miR-1896, miR-1900, miR-1915-3p, miR-218-1-3p, miR-3064-5p, miR-3109-3p, miR-3150a-3p, miR-3157-5p, miR-3175, miR-3191-5p, miR-328-5p, miR-342-3p, miR-3594-5p, miR-3649, miR-377-3p, miR-4292, miR-4472, miR-4489, miR-4512, miR-4638-5p, miR-4651, miR-4690-5p, miR-4691-5p, miR-4723-5p, miR-4788, miR-491-5p, miR-5006-5p, miR-5129-5p, miR-516a-5p, miR-5193, miR-520a-5p, miR-541-3p, miR-544b, miR-5689, miR-574-3p, miR-593-5p, miR-615-5p, miR-637, miR-6515-5p, miR-660-3p, miR-669c-3p, miR-6742-5p, miR-6756-5p, miR-6764-3p, miR-6768-5p, miR-6825-5p, miR-6846-5p, miR-6859-3p, miR-6861-3p, miR-6862-5p, miR-6875-3p, miR-6887-3p, miR-7112-5p, miR-7113-5p, miR-7155-5p, miR-7974, mir-8,miR-92a-2-5p, miR-96-5p |
HDAC8 |
let-7c-1-3p, miR-101-3p, miR-10a-5p, miR-1179, miR-1260a, miR-1273g-3p, miR-1278, miR-1295b-5p, miR-1301-5p, miR-139-5p, miR-144-3p, miR-146a-5p, miR-150-3p, miR-150-5p,miR-152-5p, miR-16-1-3p, miR-181a-5p, miR-182-3p, miR-188-3p, miR-194-5p, miR-1953, miR-197-5p, miR-202-5p, miR-203a-5p, miR-2110, miR-2115-5p, miR-216b-3p, miR-216b-5p, miR-218-2-3p, miR-26b-3p, miR-3058-5p, miR-3090-3p, miR-31-3p, miR-3151-3p, miR-3611, miR-3659, miR-3675-3p, miR-376c-3p, miR-377-3p, miR-4267, miR-4271, miR-4274, miR-4279,miR-4291, miR-4307, miR-4461, miR-4487, miR-450a-1-3p, miR-4645-5p, miR-4650-3p, miR-4666a-5p, miR-466d-5p, miR-4686, miR-4711-5p, miR-4716-3p, miR-4718, miR-4723-5p, miR-4760-3p, miR-4768-5p, miR-4769-3p, miR-4777-3p, miR-488-5p, miR-497-3p, miR-504-5p, miR-506-5p,miR-5089-3p, miR-509-5p, miR-5112, miR-5193, miR-5579-5p, miR-5581-3p, miR-5683, miR-5693, miR-5696, miR-584-5p, miR-6501-5p, miR-6509-3p, miR-6512-3p, miR-655-5p, miR-664-3p, miR-668-3p, miR-6734-3p, miR-6755-5p, miR-6758-5p, miR-6806-5p, miR-6818-5p, miR-6825-5p, miR-6844, miR-6873-3p, miR-6883-3p, miR-6895-3p, miR-7154-3p, miR-7159-3p, miR-743a-5p, miR-744-3p, miR-7a-5p, miR-891b |
HDAC10 |
miR-1199-3p,miR-1228-5p, miR-1233-5p, miR-1237-5p, miR-1273h-5p, miR-128-1-5p, miR-1282, miR-1293, miR-1294, miR-1343-5p, miR-1893, miR-1908-3p, miR-1908-5p, miR-1914-3p, miR-3080-5p, miR-30c-1-3p,miR-3141, miR-3178, miR-3180-3p, miR-337-5p, miR-363-5p, miR-3648, miR-381-5p, miR-423-5p, miR-4481, miR-4634, miR-4649-5p, miR-4651, miR-4706, miR-4710, miR-4734, miR-4743-5p, miR-4746-3p, miR-4781-5p, miR-504-3p, miR-542-5p, miR-5707, miR-5708, miR-6090,miR-6134, miR-615-5p, miR-673-3p, miR-6734-5p, miR-6756-5p, miR-6777-5p, miR-6781-5p, miR-6782-5p, miR-6827-5p, miR-6853-5p, miR-6880-5p, miR-744-5p, miR-7704, miR-7854-3p, miR-8055, miR-92b-5p |
HDAC11 |
miR-1207-5p, miR-1224-3pmiR-1225-3p, miR-1227-5p, miR-1247-5p, miR-1254, miR-1258, miR-1260a, miR-128-1-5p, miR-1291, miR-1343-3p, miR-1587, miR-1825, miR-1843a-5p, miR-18a-3p, miR-1909-3p, miR-1913, miR-1934-5p, miR-1972, miR-214-5p, miR-2392, miR-23a-5p,miR-296-5p, miR-3070-5p, miR-3072, miR-3084-3p, miR-3103-5p, miR-3104-5p, miR-3109-3p, miR-3110-5p, miR-3127-3p, miR-3152-5p, miR-3162-5p, miR-3180-3p, miR-3200-3p, miR-324-5p, miR-331-3p, miR-338-3p, miR-346, miR-361-3p, miR-3616-3p, miR-3649, miR-3689d, miR-3909, miR-3918, miR-4254, miR-4290, miR-4292, miR-4308, miR-4446-3p, miR-4455, miR-4512, miR-4527, miR-4530, miR-4534, miR-4640-5p, miR-4650-5p, miR-4656, miR-4695-5p, miR-4716-3p, miR-4717-5p, miR-4747-3p, miR-4749-3p, miR-4763-5p, miR-486-3p, miR-486-5p, miR-492, miR-5008-5p, miR-5088-3p, miR-5195-5p, miR-550a-5p, miR-6081, miR-6132, miR-639, miR-6508-3p, miR-6510-5p, miR-6511b-5p, miR-655-5p, miR-659-5p, miR-661, miR-6734-5p, miR-6735-3p, miR-6747-3p, miR-6748-3p, miR-6749-3p, miR-6752-3p, miR-6762-5p, miR-6778-3p, miR-6791-3p, miR-6801-3p, miR-6802-3p, miR-6803-3p,miR-6808-5p, miR-6825-5p, miR-6836-3p, miR-6841-3p, miR-6862-5p, miR-6882-3p, miR-6887-3p, miR-6892-3p, miR-6967-5p, miR-7032-3p, miR-7064-3p, miR-7108-3p, miR-7113-3p, miR-762, miR-766-3p, miR-7705, miR-7851-3p, miR-939-3p |
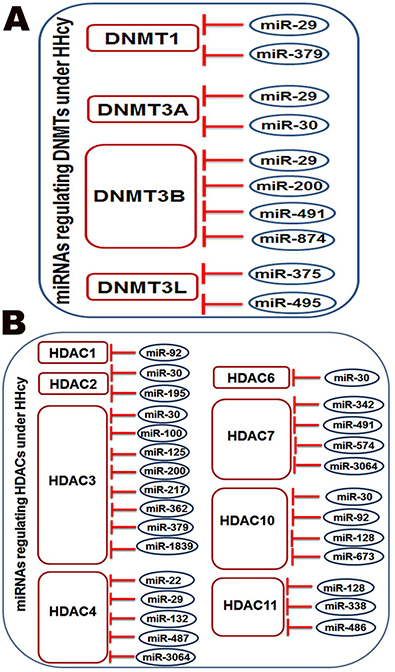
Figure 6: The pathway building tool of IPA showed that miRNAs downregulated by HHcy are targeting enzymes responsible for DNA methylation (DNMT1, DNMT3A, DNMT3B and DNMT3L) as shown in (A) and histone deacetylation (HDAC1, HDAC2, HDAC3, HDAC4, HDAC6, HDAC7, HDAC10 and HDAC11) (B).
DISCUSSION
Recently, we reported deleterious effects of elevated Hcy on BRB integrity [2, 4, 76]. Elevated Hcy level was reported as an epigenetic modulator in various diseases such as chronic kidney disease [77], cardiovascular diseases [78] and atherosclerosis [79]. In the present study, epigenetic modifications were proposed as possible mechanisms of HHcy-induced BRB dysfunction. Currently, it is believed that this is the first study to screen for the epigenetic changes that occur in retina and retinal endothelial cells under HHcy. The major findings of the current study are 1) Hcy induced a significant increase of both HDACs and DNMTs activity in mouse retina, cultured HRECs and RPE; 2) Inhibition of DNMT and HDAC ameliorates Hcy-induced BRB dysfunction. 3) miRNA profiling of cbs+/– and cbs–/– detected 127 miRNAs in cbs+/– that were statistically significant and differentially expressed in comparison to cbs+/+.4) We detected similarity between some miRNAs altered under HHcy and miRNAs altered in DR or AMD. 4) miRNA pathway analysis showed HHcy-dysregulated miRNAs involvement in ER stress, oxidative stress, inflammation, angiogenesis, and hypoxia pathways. 5) DNMTs and HDACs are direct targets of miRNAs dysregulated in HHcy.
Among different epigenetic pathways, DNA methylation is the major epigenetic modification associated with HHcy. Methylation of DNA is mediated by DNMTs and requires the presence of S-adenosylmethionine (SAM), a methyl donating compound that delivers methyl groups to maintain other metabolic reactions in human body [80]. Hcy is an intermediate product released during methionine cycle. Methionine combines with adenosine to produce SAM. After releasing its methyl group, SAM is converted to SAH which is further hydrolyzed to Hcy and adenosine [81]. Therefore, the Hcy-methionine cycle is very critical for maintenance of a balanced amount of SAM, and therefore normal DNMTs activity. Indeed, differential levels of DNA methylation, from hyper- to hypo-methylation, have been reported to be induced by HHcy [77]. A likely explanation for such phenomena is the fact that other mechanisms are involved in regulating DNA methylation and histone modification. In the current study, the Hcy increased DNMTs activity both in vivo and in vitro, suggesting HHcy-induced global increase in retinal DNA methylation.
DNA methylation has been reported to cooperate with histone deacetylation to mediate transcriptional repression [82]. Furthermore, increased level of HDAC was reported in many ocular diseases such as ischemic retinal injury [83], retinal degenerative diseases [84], optic nerve injury [85] and corneal neovascularization [86]. In addition, increased histone deacetylase (HDAC) activity with subsequent dysregulation of protein acetylation has been linked to retinal degenerations associated with ischemia and ocular hypertension [87]. Our results showed increased HDAC activity both in vivo and in vitro (mice models of HHcy, HRECs and ARPE-19 cells treated with Hcy).
miRNAs play a crucial role in regulation of gene expression and their altered expression has been reported in serum of patients with various eye diseases including DR [51–55] and AMD [56–59], and also in cardiovascular diseases [88, 89]. The current study evaluated the role of miRNAs in HHcy-induced BRB dysfunction and related these miRNAs changes to retinal diseases associated with BRB dysfunction such as DR and AMD. MiRNAs expression were analyzed and yielded differential expression in HHcy mice retina (cbs+/– and cbs–/–) compared to cbs+/+ control.
Interestingly, epigenetic modifications were reported to play a crucial role in HHcy induced-blood brain barrier dysfunction, with profound involvement of miRNAs in the pathogenesis of the leaky cerebral vasculature in cbs+/– mice [90].
To narrow the focus, the differentially expressed miRNAs in both cbs+/– and cbs–/– mice were compared to identify commonly expressed miRNAs in HHcy. The analysis revealed 25 miRNAs were similarly affected by elevated Hcy in both models. Furthermore, miRNAs were reported to be linked to the pathogenesis of diabetic complications [91]. Therefore, we evaluated that the differentially expressed miRNAs in mouse models of elevated Hcy and in STZ-mice as a model of Type 1 diabetes. The analysis revealed 6 miRNAs commonly differentially expressed in both STZ and HHcy mice. Among those miRNAs, 2 miRNAs (miR-16-5p and miR-194) were consistently changing among the three different groups. Interestingly, miR-16-5p has been reported to be tissue protective and to be decreased in a diabetic rat’s kidney [92].
In addition to the reported role of HHcy in DR [15, 93, 94], our previous work reported that increased Hcy was associated with features of AMD in mice including RPE dysfunction [4]. Therefore, the current study also aimed to evaluate the similarity of miRNAs profile in mouse models of HHcy and what has been reported in patient with AMD, especially various miRNAs were linked to AMD pathogenesis [95]. The study revealed downregulation of miR-205, miR-27, miR-31, and miR-29 in the cbs+/– retinas, these miRNAs were also reported to be downregulated in vitreous [68] and plasma of AMD patients [69]. Furthermore, miR-31 which was altered in cbs+/– retinas was suggested as a regulator of choroidal neovascularization [70].The analysis revealed similarity in miRNAs differentially expressed in both AMD patients and retina of cbs+/– mice.
Recently, studies uncovered evidence that miRNAs travel around the body are contained within exosomes [96]. Increasing evidence points to exosomes and micro vesicles as a unique alternative mechanism for protein transfer and intercellular communication, allowing exchange of proteins, lipids and nucleic acids between cells [97]. Accumulating evidence supported the role of exosomal miRNAs in eye diseases [98, 99].
Related to the fact that there is no definite animal model of AMD and numerous models mimic some of the significant pathological features seen in AMD, however none recreated all of its characteristics. That is why, having an animal model that mimics both the early and late features of AMD has been challenging [100]. Our previous work reported that, HHcy induces features of AMD both in vivo (cbs mice) and in vitro (Hcy-treated RPE) [4]. Consequently, we evaluated miRNA differential profile in exosomes released from Hcy-treated RPE. Two miRNAs (MiR-17-5p and let-7a-3p) were found to be commonly differentially expressed in retinas of cbs–/– mice, diabetic mice as well as RPE exosomes. Interestingly, those two miRNAs were also reported to be altered in DR and AMD [91, 101, 102]. Moreover, miR-17-5p has been reported to be involved in both pro- and anti-proliferative signals via dysregulation of normal cell cycle [103].
In conclusion, understanding HHcy-induced epigenetic modifications lead to possible prospects in evaluating miRNAs as molecular biomarkers, prognostic tools, diagnostic tools and therapeutic agents for eye diseases associated with elevated Hcy such as DR and AMD.
ACKNOWLEDGMENTS AND FUNDING
This study was supported by startup fund from the Dental College of Georgia, a pilot project grant from the James & Jean Culver Vision Discovery Institute (VDI) and American Heart Association (AHA) Scientist Development Grant award #16SDG3070001 and 5R01EY023315-02 grant. We would like to thank the Augusta University undergraduate student Sung Chu for his help in the analytical part and Georgia Cancer Center, Integrated Genomics Core, especially Dr. Eiko Kitamura, PhD, for their great help in performing our microarray studies
CONFLICTS OF INTEREST
None.
REFERENCES
1. Joseph J, Handy DE, Loscalzo J. Quo vadis: whither homocysteine research? Cardiovasc Toxicol. 2009; 9:53–63. https://doi.org/10.1007/s12012-009-9042-6.
2. Tawfik A, Markand S, Al-Shabrawey M, Mayo JN, Reynolds J, Bearden SE, Ganapathy V, Smith SB. Alterations of retinal vasculature in cystathionine-beta-synthase heterozygous mice: a model of mild to moderate hyperhomocysteinemia. Am J Pathol. 2014; 184:2573–85. https://doi.org/10.1016/j.ajpath.2014.05.018.
3. Tawfik A, Al-Shabrawey M, Roon P, Sonne S, Covar JA, Matragoon S, Ganapathy PS, Atherton SS, El-Remessy A, Ganapathy V, Smith SB. Alterations of retinal vasculature in cystathionine-Beta-synthase mutant mice, a model of hyperhomocysteinemia. Invest Ophthalmol Vis Sci. 2013; 54:939–49. https://doi.org/10.1167/iovs.12-10536.
4. Ibrahim AS, Mander S, Hussein KA, Elsherbiny NM, Smith SB, Al-Shabrawey M, Tawfik A. Hyperhomocysteinemia disrupts retinal pigment epithelial structure and function with features of age-related macular degeneration. Oncotarget. 2016; 7:8532–45. https://doi.org/10.18632/oncotarget.7384.
5. Cunha-Vaz J. The Blood-Retinal Barrier in the Management of Retinal Disease: EURETINA Award Lecture. Ophthalmologica. 2017; 237:1–10. https://doi.org/10.1159/000455809.
6. Zhang C, Nie J, Feng L, Luo W, Yao J, Wang F, Wang H. The emerging roles of clusterin on reduction of both blood retina barrier breakdown and neural retina damage in diabetic retinopathy. Discov Med. 2016; 21:227–37.
7. Jiang F, Chen Q, Huang L, Wang Y, Zhang Z, Meng X, Liu Y, Mao C, Zheng F, Zhang J, Yan H. TNFSF15 Inhibits Blood Retinal Barrier Breakdown Induced by Diabetes. Int J Mol Sci. 2016; 17. https://doi.org/10.3390/ijms17050615.
8. Cunha-Vaz J, Bernardes R, Lobo C. Blood-retinal barrier. Eur J Ophthalmol. 2011; 21 Suppl 6: S3-9. https://doi.org/10.5301/EJO.2010.6049.
9. Cummings M, Cunha-Vaz J. Treatment of neovascular age-related macular degeneration in patients with diabetes. Clin Ophthalmol. 2008; 2:369–75.
10. Mennel S, Peter S, Meyer CH, Thumann G. Effect of photodynamic therapy on the function of the outer blood-retinal barrier in an in vitro model. Graefes Arch Clin Exp Ophthalmol. 2006; 244:1015–21. https://doi.org/10.1007/s00417-005-0237-7.
11. Srivastav K, Saxena S, Mahdi AA, Shukla RK, Meyer CH, Akduman L, Khanna VK. Increased serum level of homocysteine correlates with retinal nerve fiber layer thinning in diabetic retinopathy. Mol Vis. 2016; 22:1352–60.
12. Pusparajah P, Lee LH, Abdul Kadir K. Molecular Markers of Diabetic Retinopathy: Potential Screening Tool of the Future? Front Physiol. 2016; 7:200. https://doi.org/10.3389/fphys.2016.00200.
13. Feng Y, Shan MQ, Bo L, Zhang XY, Hu J. Association of homocysteine with type 1 diabetes mellitus: a meta-analysis. Int J Clin Exp Med. 2015; 8:12529–38.
14. Ajith TA, Ranimenon. Homocysteine in ocular diseases. Clin Chim Acta. 2015; 450:316–21. https://doi.org/10.1016/j.cca.2015.09.007.
15. Xu C, Wu Y, Liu G, Liu X, Wang F, Yu J. Relationship between homocysteine level and diabetic retinopathy: a systematic review and meta-analysis. Diagn Pathol. 2014; 9:167. https://doi.org/10.1186/s13000-014-0167-y.
16. Malaguarnera G, Gagliano C, Giordano M, Salomone S, Vacante M, Bucolo C, Caraci F, Reibaldi M, Drago F, Avitabile T, Motta M. Homocysteine serum levels in diabetic patients with non proliferative, proliferative and without retinopathy. Biomed Res Int. 2014; 2014:191497. https://doi.org/10.1155/2014/191497.
17. Huang P, Wang F, Sah BK, Jiang J, Ni Z, Wang J, Sun X. Homocysteine and the risk of age-related macular degeneration: a systematic review and meta-analysis. Sci Rep. 2015; 5:10585. https://doi.org/10.1038/srep10585.
18. Christen WG, Cook NR, Ridker PM, Buring JE. Prospective study of plasma homocysteine level and risk of age-related macular degeneration in women. Ophthalmic Epidemiol. 2015; 22:85–93. https://doi.org/10.3109/09286586.2015.1012272.
19. Pinna A, Zinellu A, Tendas D, Blasetti F, Carru C, Castiglia P. Plasma Homocysteine and Asymmetrical Dimethyl-l-Arginine (ADMA) and Whole Blood DNA Methylation in Early and Neovascular Age-Related Macular Degeneration: A Pilot Study. Curr Eye Res. 2016; 41:88–96. https://doi.org/10.3109/02713683.2014.1002044.
20. Keles S, Ates O, Kartal B, Alp HH, Ekinci M, Ceylan E, Ondas O, Arpali E, Dogan S, Yildirim K, Keles MS. Evaluation of cardiovascular biomarkers in patients with age-related wet macular degeneration. Clin Ophthalmol. 2014; 8:1573–8. https://doi.org/10.2147/OPTH.S66160.
21. Ghosh S, Saha M, Das D. A study on plasma homocysteine level in age-related macular degeneration. Nepal J Ophthalmol. 2013; 5:195–200. https://doi.org/10.3126/nepjoph.v5i2.8728.
22. Obeid R, Ninios K, Loew U, Gatzioufas Z, Hoffmann S, Seitz B, Geisel J, Herrmann W. Aqueous humor glycation marker and plasma homocysteine in macular degeneration. Clin Chem Lab Med. 2013; 51:657–63. https://doi.org/10.1515/cclm-2012-0402.
23. Burdge GC, Lillycrop KA, Phillips ES, Slater-Jefferies JL, Jackson AA, Hanson MA. Folic acid supplementation during the juvenile-pubertal period in rats modifies the phenotype and epigenotype induced by prenatal nutrition. J Nutr. 2009; 139:1054–60. https://doi.org/10.3945/jn.109.104653.
24. Antoniades C, Antonopoulos AS, Tousoulis D, Marinou K, Stefanadis C. Homocysteine and coronary atherosclerosis: from folate fortification to the recent clinical trials. Eur Heart J. 2009; 30:6–15. https://doi.org/10.1093/eurheartj/ehn515.
25. Friso S, Choi SW, Girelli D, Mason JB, Dolnikowski GG, Bagley PJ, Olivieri O, Jacques PF, Rosenberg IH, Corrocher R, Selhub J. A common mutation in the 5,10-methylenetetrahydrofolate reductase gene affects genomic DNA methylation through an interaction with folate status. Proc Natl Acad Sci U S A. 2002; 99:5606–11. https://doi.org/10.1073/pnas.062066299.
26. Pogribny IP, Beland FA. DNA hypomethylation in the origin and pathogenesis of human diseases. Cell Mol Life Sci. 2009; 66:2249–61. https://doi.org/10.1007/s00018-009-0015-5.
27. Ingrosso D, Cimmino A, Perna AF, Masella L, De Santo NG, De Bonis ML, Vacca M, D’Esposito M, D’Urso M, Galletti P, Zappia V. Folate treatment and unbalanced methylation and changes of allelic expression induced by hyperhomocysteinaemia in patients with uraemia. Lancet. 2003; 361:1693–9. https://doi.org/10.1016/S0140-6736(03)13372-7.
28. Perna AF, Ingrosso D, Violetti E, Luciano MG, Sepe I, Lanza D, Capasso R, Ascione E, Raiola I, Lombardi C, Stenvinkel P, Massy Z, De Santo NG. Hyperhomocysteinemia in uremia—a red flag in a disrupted circuit. Semin Dial. 2009; 22:351–6. https://doi.org/10.1111/j.1525-139X.2009.00579.x.
29. Wang H, Jiang X, Yang F, Chapman GB, Durante W, Sibinga NE, Schafer AI. Cyclin A transcriptional suppression is the major mechanism mediating homocysteine-induced endothelial cell growth inhibition. Blood. 2002; 99:939–45.
30. Chang PY, Lu SC, Lee CM, Chen YJ, Dugan TA, Huang WH, Chang SF, Liao WS, Chen CH, Lee YT. Homocysteine inhibits arterial endothelial cell growth through transcriptional downregulation of fibroblast growth factor-2 involving G protein and DNA methylation. Circ Res. 2008; 102:933–41. https://doi.org/10.1161/CIRCRESAHA.108.171082.
31. Turunen MP, Aavik E, Yla-Herttuala S. Epigenetics and atherosclerosis. Biochim Biophys Acta. 2009; 1790:886–91. https://doi.org/10.1016/j.bbagen.2009.02.008.
32. Bogdarina I, Welham S, King PJ, Burns SP, Clark AJ. Epigenetic modification of the renin-angiotensin system in the fetal programming of hypertension. Circ Res. 2007; 100:520–6. https://doi.org/10.1161/01.RES.0000258855.60637.58.
33. Lillycrop KA, Slater-Jefferies JL, Hanson MA, Godfrey KM, Jackson AA, Burdge GC. Induction of altered epigenetic regulation of the hepatic glucocorticoid receptor in the offspring of rats fed a protein-restricted diet during pregnancy suggests that reduced DNA methyltransferase-1 expression is involved in impaired DNA methylation and changes in histone modifications. Br J Nutr. 2007; 97:1064–73. https://doi.org/10.1017/S000711450769196X.
34. Pons D, de Vries FR, van den Elsen PJ, Heijmans BT, Quax PH, Jukema JW. Epigenetic histone acetylation modifiers in vascular remodelling: new targets for therapy in cardiovascular disease. Eur Heart J. 2009; 30:266–77. https://doi.org/10.1093/eurheartj/ehn603.
35. Feinberg AP. Phenotypic plasticity and the epigenetics of human disease. Nature. 2007; 447:433–40. https://doi.org/10.1038/nature05919.
36. Holliday R. Epigenetics: a historical overview. Epigenetics. 2006; 1:76–80.
37. Willyard C. The saving switch. Nat Med. 2010; 16:18–21. https://doi.org/10.1038/nm0110-18.
38. Lister R, Pelizzola M, Dowen RH, Hawkins RD, Hon G, Tonti-Filippini J, Nery JR, Lee L, Ye Z, Ngo QM, Edsall L, Antosiewicz-Bourget J, Stewart R, et al. Human DNA methylomes at base resolution show widespread epigenomic differences. Nature. 2009; 462:315–22. https://doi.org/10.1038/nature08514.
39. Bird AP. CpG-rich islands and the function of DNA methylation. Nature. 1986; 321:209–13. https://doi.org/10.1038/321209a0.
40. Reik W. Stability and flexibility of epigenetic gene regulation in mammalian development. Nature. 2007; 447:425–32. https://doi.org/10.1038/nature05918.
41. Fedorova E, Zink D. Nuclear architecture and gene regulation. Biochim Biophys Acta. 2008; 1783:2174–84. https://doi.org/10.1016/j.bbamcr.2008.07.018.
42. Crippa MP, Nickol JM, Bustin M. Differentiation-dependent alteration in the chromatin structure of chromosomal protein HMG-17 gene during erythropoiesis. J Mol Biol. 1991; 217:75–84.
43. Kouzarides T. Chromatin modifications and their function. Cell. 2007; 128:693–705. https://doi.org/10.1016/j.cell.2007.02.005.
44. Strahl BD, Allis CD. The language of covalent histone modifications. Nature. 2000; 403:41–5. https://doi.org/10.1038/47412.
45. Nan X, Ng HH, Johnson CA, Laherty CD, Turner BM, Eisenman RN, Bird A. Transcriptional repression by the methyl-CpG-binding protein MeCP2 involves a histone deacetylase complex. Nature. 1998; 393:386–9. https://doi.org/10.1038/30764.
46. Nagano T, Mitchell JA, Sanz LA, Pauler FM, Ferguson-Smith AC, Feil R, Fraser P. The Air noncoding RNA epigenetically silences transcription by targeting G9a to chromatin. Science. 2008; 322:1717–20. https://doi.org/10.1126/science.1163802.
47. Ohnishi Y, Totoki Y, Toyoda A, Watanabe T, Yamamoto Y, Tokunaga K, Sakaki Y, Sasaki H, Hohjoh H. Small RNA class transition from siRNA/piRNA to miRNA during pre-implantation mouse development. Nucleic Acids Res. 2010; 38:5141–51. https://doi.org/10.1093/nar/gkq229.
48. Hawkins PG, Santoso S, Adams C, Anest V, Morris KV. Promoter targeted small RNAs induce long-term transcriptional gene silencing in human cells. Nucleic Acids Res. 2009; 37:2984–95. https://doi.org/10.1093/nar/gkp127.
49. Thery C, Zitvogel L, Amigorena S. Exosomes: composition, biogenesis and function. Nat Rev Immunol. 2002; 2:569–79. https://doi.org/10.1038/nri855.
50. Moldovan L, Batte K, Wang Y, Wisler J, Piper M. Analyzing the circulating microRNAs in exosomes/extracellular vesicles from serum or plasma by qRT-PCR. Methods Mol Biol. 2013; 1024:129–45. https://doi.org/10.1007/978-1-62703-453-1_10.
51. Kowluru RA, Santos JM, Mishra M. Epigenetic modifications and diabetic retinopathy. Biomed Res Int. 2013; 2013:635284. https://doi.org/10.1155/2013/635284.
52. Kowluru RA, Mishra M. Contribution of epigenetics in diabetic retinopathy. Sci China Life Sci. 2015; 58:556–63. https://doi.org/10.1007/s11427-015-4853-0.
53. Kowluru RA, Shan Y. Role of oxidative stress in epigenetic modification of MMP-9 promoter in the development of diabetic retinopathy. Graefes Arch Clin Exp Ophthalmol. 2017; 255:955–62. https://doi.org/10.1007/s00417-017-3594-0.
54. Kowluru RA, Mishra M. Epigenetic regulation of redox signaling in diabetic retinopathy: Role of Nrf2. Free Radic Biol Med. 2017; 103:155–64. https://doi.org/10.1016/j.freeradbiomed.2016.12.030.
55. Mishra M, Zhong Q, Kowluru RA. Epigenetic modifications of Nrf2-mediated glutamate-cysteine ligase: implications for the development of diabetic retinopathy and the metabolic memory phenomenon associated with its continued progression. Free Radic Biol Med. 2014; 75:129–39. https://doi.org/10.1016/j.freeradbiomed.2014.07.001.
56. Biasutto L, Chiechi A, Couch R, Liotta LA, Espina V. Retinal pigment epithelium (RPE) exosomes contain signaling phosphoproteins affected by oxidative stress. Exp Cell Res. 2013; 319:2113–23. https://doi.org/10.1016/j.yexcr.2013.05.005.
57. Kang GY, Bang JY, Choi AJ, Yoon J, Lee WC, Choi S, Yoon S, Kim HC, Baek JH, Park HS, Lim HJ, Chung H. Exosomal proteins in the aqueous humor as novel biomarkers in patients with neovascular age-related macular degeneration. J Proteome Res. 2014; 13:581–95. https://doi.org/10.1021/pr400751k.
58. Tong Y, Zhou YL, Wang YX, Zhao PQ, Wang ZY. Retinal pigment epithelium cell-derived exosomes: Possible relevance to CNV in wet-age related macular degeneration. Med Hypotheses. 2016; 97:98–101. https://doi.org/10.1016/j.mehy.2016.10.027.
59. Wang AL, Lukas TJ, Yuan M, Du N, Tso MO, Neufeld AH. Autophagy, exosomes and drusen formation in age-related macular degeneration. Autophagy. 2009; 5:563–4.
60. Wang AL, Lukas TJ, Yuan M, Du N, Tso MO, Neufeld AH. Autophagy and exosomes in the aged retinal pigment epithelium: possible relevance to drusen formation and age-related macular degeneration. PLoS One. 2009; 4:e4160. https://doi.org/10.1371/journal.pone.0004160.
61. Bhat SP, Gangalum RK. Secretion of alphaB-Crystallin via exosomes: New clues to the function of human retinal pigment epithelium. Commun Integr Biol. 2011; 4:739–41.
62. Elshelmani H, Rani S. Exosomal MicroRNA Discovery in Age-Related Macular Degeneration. Methods Mol Biol. 2017; 1509:93–113. https://doi.org/10.1007/978-1-4939-6524-3_10.
63. Watanabe M, Osada J, Aratani Y, Kluckman K, Reddick R, Malinow MR, Maeda N. Mice deficient in cystathionine beta-synthase: animal models for mild and severe homocyst(e)inemia. Proc Natl Acad Sci U S A. 1995; 92:1585–9.
64. Pathania R, Ramachandran S, Mariappan G, Thakur P, Shi H, Choi JH, Manicassamy S, Kolhe R, Prasad PD, Sharma S, Lokeshwar BL, Ganapathy V, Thangaraju M. Combined Inhibition of DNMT and HDAC Blocks the Tumorigenicity of Cancer Stem-like Cells and Attenuates Mammary Tumor Growth. Cancer Res. 2016; 76:3224–35. https://doi.org/10.1158/0008-5472.CAN-15-2249.
65. Gravina GL, Festuccia C, Marampon F, Popov VM, Pestell RG, Zani BM, Tombolini V. Biological rationale for the use of DNA methyltransferase inhibitors as new strategy for modulation of tumor response to chemotherapy and radiation. Mol Cancer. 2010; 9:305. https://doi.org/10.1186/1476-4598-9-305.
66. Ying M, Xu R, Wu X, Zhu H, Zhuang Y, Han M, Xu T. Sodium butyrate ameliorates histone hypoacetylation and neurodegenerative phenotypes in a mouse model for DRPLA. J Biol Chem. 2006; 281:12580–6. https://doi.org/10.1074/jbc.M511677200.
67. Poirier S, Samami S, Mamarbachi M, Demers A, Chang TY, Vance DE, Hatch GM, Mayer G. The epigenetic drug 5-azacytidine interferes with cholesterol and lipid metabolism. J Biol Chem. 2014; 289:18736–51. https://doi.org/10.1074/jbc.M114.563650.
68. Mehdiani A, Maier A, Pinto A, Barth M, Akhyari P, Lichtenberg A. An innovative method for exosome quantification and size measurement. J Vis Exp. 2015: 50974. https://doi.org/10.3791/50974.
69. Askou AL, Alsing S, Holmgaard A, Bek T, Corydon TJ. Dissecting microRNA dysregulation in age-related macular degeneration: new targets for eye gene therapy. Acta Ophthalmol. 2017. https://doi.org/10.1111/aos.13407.
70. Zhou Q, Gallagher R, Ufret-Vincenty R, Li X, Olson EN, Wang S. Regulation of angiogenesis and choroidal neovascularization by members of microRNA-23~27~24 clusters. Proc Natl Acad Sci U S A. 2011; 108:8287–92. https://doi.org/10.1073/pnas.1105254108.
71. Shen J, Yang X, Xie B, Chen Y, Swaim M, Hackett SF, Campochiaro PA. MicroRNAs regulate ocular neovascularization. Mol Ther. 2008; 16:1208–16. https://doi.org/10.1038/mt.2008.104.
72. Yao H, Wang T, Deng J, Liu D, Li X, Deng J. The development of blood-retinal barrier during the interaction of astrocytes with vascular wall cells. Neural Regen Res. 2014; 9:1047–54. https://doi.org/10.4103/1673-5374.133169.
73. Steuer H, Jaworski A, Elger B, Kaussmann M, Keldenich J, Schneider H, Stoll D, Schlosshauer B. Functional characterization and comparison of the outer blood-retina barrier and the blood-brain barrier. Invest Ophthalmol Vis Sci. 2005; 46:1047–53. https://doi.org/10.1167/iovs.04-0925.
74. Lopes de Faria JM, Duarte DA, Montemurro C, Papadimitriou A, Consonni SR, Lopes de Faria JB. Defective Autophagy in Diabetic Retinopathy. Invest Ophthalmol Vis Sci. 2016; 57:4356–66. https://doi.org/10.1167/iovs.16-19197.
75. Kaarniranta K, Tokarz P, Koskela A, Paterno J, Blasiak J. Autophagy regulates death of retinal pigment epithelium cells in age-related macular degeneration. Cell Biol Toxicol. 2017; 33:113–28. https://doi.org/10.1007/s10565-016-9371-8.
76. Mohamed R, Sharma I, Ibrahim AS, Saleh H, Elsherbiny NM, Fulzele S, Elmasry K, Smith SB, Al-Shabrawey M, Tawfik A. Hyperhomocysteinemia Alters Retinal Endothelial Cells Barrier Function and Angiogenic Potential via Activation of Oxidative Stress. Sci Rep. 2017; 7:11952. https://doi.org/10.1038/s41598-017-09731-y.
77. Pushpakumar S, Kundu S, Narayanan N, Sen U. DNA hypermethylation in hyperhomocysteinemia contributes to abnormal extracellular matrix metabolism in the kidney. FASEB J. 2015; 29:4713–25. https://doi.org/10.1096/fj.15-272443.
78. Chaturvedi P, Kalani A, Givvimani S, Kamat PK, Familtseva A, Tyagi SC. Differential regulation of DNA methylation versus histone acetylation in cardiomyocytes during HHcy in vitro and in vivo: an epigenetic mechanism. Physiol Genomics. 2014; 46:245–55. https://doi.org/10.1152/physiolgenomics.00168.2013.
79. Zhou S, Zhang Z, Xu G. Notable epigenetic role of hyperhomocysteinemia in atherogenesis. Lipids Health Dis. 2014; 13:134. https://doi.org/10.1186/1476-511X-13-134.
80. Lin N, Qin S, Luo S, Cui S, Huang G, Zhang X. Homocysteine induces cytotoxicity and proliferation inhibition in neural stem cells via DNA methylation in vitro. FEBS J. 2014; 281:2088–96. https://doi.org/10.1111/febs.12764.
81. Selhub J. Homocysteine metabolism. Annu Rev Nutr. 1999; 19:217–46. https://doi.org/10.1146/annurev.nutr.19.1.217.
82. Fuks F, Burgers WA, Brehm A, Hughes-Davies L, Kouzarides T. DNA methyltransferase Dnmt1 associates with histone deacetylase activity. Nat Genet. 2000; 24:88–91. https://doi.org/10.1038/71750.
83. Fan J, Alsarraf O, Dahrouj M, Platt KA, Chou CJ, Rice DS, Crosson CE. Inhibition of HDAC2 protects the retina from ischemic injury. Invest Ophthalmol Vis Sci. 2013; 54:4072–80. https://doi.org/10.1167/iovs.12-11529.
84. Zhang H, Dai X, Qi Y, He Y, Du W, Pang JJ. Histone Deacetylases Inhibitors in the Treatment of Retinal Degenerative Diseases: Overview and Perspectives. J Ophthalmol. 2015; 2015:250812. https://doi.org/10.1155/2015/250812.
85. Chindasub P, Lindsey JD, Duong-Polk K, Leung CK, Weinreb RN. Inhibition of histone deacetylases 1 and 3 protects injured retinal ganglion cells. Invest Ophthalmol Vis Sci. 2013; 54:96–102. https://doi.org/10.1167/iovs.12-10850.
86. Schaap-Fogler M, Bahar I, Rephaeli A, Dahbash M, Nudelman A, Livny E, Barliya T, Nisgav Y, Livnat T. Effect of Histone Deacetylase Inhibitor, Butyroyloxymethyl-Diethyl Phosphate (AN-7), on Corneal Neovascularization in a Mouse Model. J Ocul Pharmacol Ther. 2017. https://doi.org/10.1089/jop.2016.0017.
87. Fan J, Alsarraf O, Chou CJ, Yates PW, Goodwin NC, Rice DS, Crosson CE. Ischemic preconditioning, retinal neuroprotection and histone deacetylase activities. Exp Eye Res. 2016; 146:269–75. https://doi.org/10.1016/j.exer.2016.03.026.
88. Mishra PK, Tyagi N, Kundu S, Tyagi SC. MicroRNAs are involved in homocysteine-induced cardiac remodeling. Cell Biochem Biophys. 2009; 55:153–62. https://doi.org/10.1007/s12013-009-9063-6.
89. Li F, Chen Q, Song X, Zhou L, Zhang J. MiR-30b Is Involved in the Homocysteine-Induced Apoptosis in Human Coronary Artery Endothelial Cells by Regulating the Expression of Caspase 3. Int J Mol Sci. 2015; 16:17682–95. https://doi.org/10.3390/ijms160817682.
90. Kalani A, Kamat PK, Familtseva A, Chaturvedi P, Muradashvili N, Narayanan N, Tyagi SC, Tyagi N. Role of microRNA29b in blood-brain barrier dysfunction during hyperhomocysteinemia: an epigenetic mechanism. J Cereb Blood Flow Metab. 2014; 34:1212–22. https://doi.org/10.1038/jcbfm.2014.74.
91. Kovacs B, Lumayag S, Cowan C, Xu S. MicroRNAs in early diabetic retinopathy in streptozotocin-induced diabetic rats. Invest Ophthalmol Vis Sci. 2011; 52:4402–9. https://doi.org/10.1167/iovs.10-6879.
92. Mohan A, Singh RS, Kumari M, Garg D, Upadhyay A, Ecelbarger CM, Tripathy S, Tiwari S. Urinary Exosomal microRNA-451-5p Is a Potential Early Biomarker of Diabetic Nephropathy in Rats. PLoS One. 2016; 11:e0154055. https://doi.org/10.1371/journal.pone.0154055.
93. Malaguarnera G, Gagliano C, Salomone S, Giordano M, Bucolo C, Pappalardo A, Drago F, Caraci F, Avitabile T, Motta M. Folate status in type 2 diabetic patients with and without retinopathy. Clin Ophthalmol. 2015; 9:1437–42. https://doi.org/10.2147/OPTH.S77538.
94. Sato Y, Ouchi K, Funase Y, Yamauchi K, Aizawa T. Relationship between metformin use, vitamin B12 deficiency, hyperhomocysteinemia and vascular complications in patients with type 2 diabetes. Endocr J. 2013; 60:1275–80.
95. SanGiovanni JP, SanGiovanni PM, Sapieha P, De Guire V. miRNAs, single nucleotide polymorphisms (SNPs) and age-related macular degeneration (AMD). Clin Chem Lab Med. 2017; 55:763–75. https://doi.org/10.1515/cclm-2016-0898.
96. Simons M, Raposo G. Exosomes—vesicular carriers for intercellular communication. Curr Opin Cell Biol. 2009; 21:575–81. https://doi.org/10.1016/j.ceb.2009.03.007.
97. Fevrier B, Raposo G. Exosomes: endosomal-derived vesicles shipping extracellular messages. Curr Opin Cell Biol. 2004; 16:415–21. https://doi.org/10.1016/j.ceb.2004.06.003.
98. Agrawal S, Chaqour B. MicroRNA signature and function in retinal neovascularization. World J Biol Chem. 2014; 5:1–11. https://doi.org/10.4331/wjbc.v5.i1.1.
99. Ragusa M, Barbagallo C, Statello L, Caltabiano R, Russo A, Puzzo L, Avitabile T, Longo A, Toro MD, Barbagallo D, Valadi H, Di Pietro C, Purrello M, et al. miRNA profiling in vitreous humor, vitreal exosomes and serum from uveal melanoma patients: Pathological and diagnostic implications. Cancer Biol Ther. 2015; 16:1387–96. https://doi.org/10.1080/15384047.2015.1046021.
100. Liu CH, Wang Z, Sun Y, Chen J. Animal models of ocular angiogenesis: from development to pathologies. FASEB J. 2017. https://doi.org/10.1096/fj.201700336R.
101. Raghunath A, Perumal E. Micro-RNAs and their roles in eye disorders. Ophthalmic Res. 2015; 53:169–86. https://doi.org/10.1159/000371853.
102. Berber P, Grassmann F, Kiel C, Weber BH. An Eye on Age-Related Macular Degeneration: The Role of MicroRNAs in Disease Pathology. Mol Diagn Ther. 2017; 21:31–43. https://doi.org/10.1007/s40291-016-0234-z.
103. Cloonan N, Brown MK, Steptoe AL, Wani S, Chan WL, Forrest AR, Kolle G, Gabrielli B, Grimmond SM. The miR-17-5p microRNA is a key regulator of the G1/S phase cell cycle transition. Genome Biol. 2008; 9:R127. https://doi.org/10.1186/gb-2008-9-8-r127.