
INTRODUCTION
Breast cancer is the most prevalent cancer diagnosis and the leading cause of cancer-related death among females worldwide, with an estimated 1.7 million cases and 521,900 deaths reported in 2012 [1]. With the increased understanding and molecular characterization of breast cancer, surgery, radiotherapy and systemic treatments, particularly cytotoxic chemotherapy and, more recently, molecular-targeted agents, are the current mainstay of clinical cancer care. These treatments not only improve local tumor control but also sometimes eradicate micro-metastasis, thereby improving survival.
Despite continuous improvements in cancer management, local-regional recurrence or metastatic spread still occurs in a high proportion of patients [2, 3]. At least for radiotherapy and systemic treatments, one underlying reason for these occurrences might be the low efficacy of current treatments for eradicating cancer stem cells (CSCs). One of the first observations of CSCs was published by Dr. Richards in 1955. He demonstrated the existence of a stem cell pool using deoxyribose nucleic acid measurements in Ehrlich and Krebs ascites tumors. He observed that only a small fraction of cells was capable of normal and regular mitosis and that this finding could be due to stem cell division [4]. The cancer stem cell model argues that stem cells are the major contributing factor to disease progression and therapy response, as they have the capability to self-renew and generate heterogeneous lineages of cancer cells [5]. The CSC hypothesis has important implications for therapeutic development. CSCs are relatively resistant to cytotoxic chemotherapy, both in preclinical models and in neoadjuvant clinical trials [6].
Currently, sequence patterns of radiotherapy (RT) with surgery mainly include radiation prior to surgery, intraoperative radiation, and radiation after surgery. Postoperative RT (PORT) has long been recognized as a key component of breast-conserving surgery (BCS) and has been recommended in consensus guidelines as a standard surgical option for over 2 decades [7, 8]. Additionally, there are consensus guidelines for selecting post-mastectomy RT among patients with operable invasive breast cancer [8]. Large randomized trials and statistical studies have established the benefit of PORT in breast cancer, with improved survival and reduced rate of local recurrence in appropriately selected patients [9–11]. Preoperative RT (PRRT), similar to neoadjuvant chemotherapy, may be applicable not only for patients with locally advanced breast cancer and inoperable advanced-stage tumors for BCS but also for those with operable tumors, aiming at breast conservation and higher complete remission rates [12, 13]. However, neoadjuvant treatment may also stimulate CSC self-renewal through cytokine production and DNA repair mechanisms. Therefore, the question concerning the impact of PRRT on long-term survival is important and remains to be answered.
In this study, we utilized a population-based study to examine the overall outcomes of radiotherapy with surgery in different sequence patterns. We investigated the association of different radiation sequences with surgery and survival outcomes of malignant breast cancer; furthermore, we assessed the results based on data stratified by stage, a critical clinical index of surgery, and clinicopathologic factors associated with local recurrence risk and long-time survival.
MATERIALS AND METHODS
Ethics statement
This study was approved by the Fudan University Shanghai Cancer Center Ethics Committee after undergoing an independent ethics committee/institutional review. Data from the National Cancer Institute’s Surveillance, Epidemiology, and End Results (SEER) database were obtained online. Written informed consent was obtained from the patient for publication of this report and any accompanying images.
Study design and data source
The SEER database [14], which represents almost 30% of all new cancer diagnoses per year, is one of the largest validated cancer registries in the United States. In the present study, a retrospective cohort study was conducted with data obtained from SEER. We identified 1,111,218 females greater than or equal to age of 20 who underwent cancer-directed surgery after being diagnosed with a first case of breast cancer using the SEER program, which included 18 population-based cancer registries dating from 1973 to 2013 (from the first registry to the last update in SEER database). Cases diagnosed by autopsy or death certificate only or with site-specific surgery codes of 0 or 9 or primary site-surgery codes of 0 or 99 were excluded from the analysis. Among the remaining patients, 636,181 from 18 registries and 7,042 from the Utah registry in 1988–2007 were selected to investigate the trends and outcomes of cancer-directed surgery with and without radiation and with different surgery-radiation sequences. To acquire more comprehensive information on stage and regional node status, patients with breast cancer diagnosed before 1988 were excluded. Moreover, those diagnosed after 2007 were excluded due to inadequate follow-up time. Additionally, all of the 1,111,218 cases were included in the analysis of overall rates of radiation sequence with surgery.
SEER treatment variables and covariates
In our study, Hispanic origin, race (white, black, others/unknown), age (20–39 years, 40–49 years, 50–69 years, ≥70 years), place of residence (large urban, small urban, rural), and marital status (married, not married, unknown) were included as patient-specific variables. Based on previous reports [10, 15], we divided age of patients by less than 50, 50–69 and greater than 70. Since breast cancer in young adult less than age of 40 is one special type, which has higher proportions of high-grade and later-stage tumors; a more-aggressive phenotype and worse prognosis [16], we further divided the group of less than 50 into two groups of 20–39 and 40–49 for better understanding of outcomes stratified by the radiation sequence with surgery. Grade (high, intermediate, low, unknown), laterality (unilateral, bilateral), American Joint Committee on Cancer (AJCC) 6th stage (I, II, III, IV, others/unknown), lymph node (LN) status (negative, positive, unknown), estrogen receptor (ER) status (positive, negative, borderline, unknown), progesterone receptor (PR) status (positive, negative, borderline, unknown), tumor size (≤20 mm, 21–50 mm, >50 mm, unknown), and surgery mode (breast-conserving surgery [BCS], mastectomy, others/unknown) were included as tumor-specific variables. All variables were categorized as outlined in Supplementary Table 1. The procedure was repeated for 5 cycles to produce a single imputed dataset to stabilize the results. For analysis, the classification of all variables remained consistent in this study to allow for a nonlinear effect in regression models. We applied surgery-radiation sequence codes to classify patients with the “No radiation and/or cancer-directed surgery” code into the surgery-alone group (non-RT group) and those with other codes into the surgery with radiation group (RT group).
Outcome measurement
Cause of death was categorized as breast cancer, other malignant disease, cardiovascular disease, infectious disease, pulmonary disease, diabetes mellitus, or other/unknown according to the primary cause of death listed in SEER and on the basis of the International Classification of Diseases Revisions 8 to 10. Time to overall death and breast cancer-specific death (overall mortality [OM] and breast cancer-specific mortality [BCM]) was calculated based on the time period from the date of diagnosis until the last date for which complete vital status data were available (last follow-up date: December 31, 2013). Data regarding deaths were ascertained from death certificates, which are coded by state health departments and/or state vital records for each SEER region [17].
Statistical analysis
For categorical (counts, percentage) variables, demographic and tumor-specific characteristics were compared between the different treatment groups using Pearson’s Chi-square test. The Cochrane Armitage trend test was used to assess treatment shifts over time, and Cox proportional hazard regression analysis was used to evaluate overall survival (OS) and disease-specific survival (DSS). In the survival analysis, all of the patients lost to follow-up were censored. In our study, multivariable analysis as well as 1:1 propensity-score (PS) matching, which aims to reduce the effect of treatment selection by creating a pseudo-randomized study design based on all measured potential confounders in the dataset, were applied to adjust for potentially indicated confounders (covariates: age, marital status, race, place of residence, Hispanic origin, laterality, tumor grade, stage, LN status, surgery mode, ER status, and PR status), as the treatment assignment of patients was not random (Table 2) [18]. Psmatching3 in SPSS was used for PS matching and to test matching quality to determine the balance after the match [19]. The effects of individual variables on DSS and OS with and without PS matching were further calculated. We used the Kaplan-Meier method to generate survival curves and log-rank tests to analyze the differences between curves. Additional stratified analyses were conducted using four stage groups (stage I, stage II, stage III, and stage IV). In addition, we performed a secondary analysis using 1:1 PS matching-adjusted competing risk analyses to confirm the HRs for disease-specific mortality, which adjusted for competing events such as death from other non-cancer causes or death from unknown reasons [20].
Table 1: Trends of patient characteristics undergoing surgery with RT compared with surgery alone in 18 registries from 1988–2007*
No. of Patients (%) |
|||||
|---|---|---|---|---|---|
Characteristic |
Number of patients who underwent surgery with RT (% of all surgery patients) |
Ptrend |
|||
Year of diagnosis |
1988–1992 |
1993–1997 |
1998–2002 |
2003–2007 |
|
Number of patients |
22697 (29.0) |
45164 (41.2) |
94504 (47.1) |
122048 (49.3) |
<.001 |
Race |
|||||
White |
19824 (29.1) |
38432 (41.6) |
80361 (47.6) |
101556 (49.6) |
<.001 |
Black |
1638 (28.1) |
3376 (37.5) |
7549 (42.8) |
11313 (47.3) |
<.001 |
Other/unknown |
1235 (28.8) |
3356 (40.6) |
6594 (46.7) |
9179 (48.3) |
<.001 |
Hispanic |
|||||
Yes |
1078 (30.7) |
3035 (40.6) |
6927 (45.7) |
10557 (47.8) |
<.001 |
No |
21619 (28.9) |
42129 (41.2) |
87577 (47.2) |
111491 (49.5) |
<.001 |
Age group, y |
|||||
20–39 |
1924 (36.2) |
3044 (44.5) |
5609 (50.1) |
6762 (50.9) |
<.001 |
40–49 |
4647 (35.3) |
9143 (46.5) |
18174 (51.4) |
24177 (52.5) |
<.001 |
50–69 |
10755 (32.1) |
21444 (45.8) |
46912 (51.7) |
62530 (53.8) |
<.001 |
≥70 |
5371 (20.4) |
11533 (31.7) |
23809 (37.5) |
28579 (39.8) |
<.001 |
Married |
|||||
Yes |
13746 (31.7) |
26946 (44.6) |
56753 (50.9) |
73022 (52.8) |
<.001 |
No |
8495 (25.8) |
17369 (37.3) |
35110 (43.0) |
45833 (45.5) |
<.001 |
Unknown |
456 (22.7) |
849 (30.8) |
2641 (35.5) |
3193 (38.1) |
<.001 |
Laterality |
|||||
Unilateral |
22672 (29.0) |
45138 (41.2) |
94453 (47.1) |
121998 (49.3) |
<.001 |
Bilateral |
25 (19.1) |
26 (22.8) |
51 (25.8) |
50 (24.6) |
0.541 |
Grade |
|||||
High |
1873 (36.3) |
7170 (47.4) |
19481 (51.9) |
26266 (52.9) |
<.001 |
Intermediate |
5595 (31.8) |
16220 (43.4) |
36206 (47.7) |
48098 (50.0) |
<.001 |
Low |
6127 (30.5) |
14654 (40.2) |
31187 (46.4) |
40824 (48.4) |
<.001 |
Unknown |
9102 (25.6) |
7120 (34.3) |
7630 (38.4) |
6860 (39.5) |
<.001 |
Stage |
|||||
I |
10672 (33.0) |
23234 (47.8) |
48334 (51.2) |
62448 (52.8) |
<.001 |
II |
5336 (23.6) |
10946 (35.0) |
26934 (41.9) |
36562 (43.9) |
<.001 |
III |
3579 (33.3) |
5907 (42.0) |
13876 (54.9) |
17996 (59.0) |
<.001 |
IV |
777 (35.5) |
883 (38.9) |
1453 (38.6) |
1844 (38.0) |
0.078 |
Unknown/other |
2333 (22.3) |
4194 (31.2) |
3907 (30.1) |
3198 (29.8) |
<.001 |
LN status |
|||||
Negative |
12650 (28.9) |
25782 (43.8) |
55628 (49.3) |
76639 (51.9) |
<.001 |
Positive |
6571 (28.7) |
11624 (38.7) |
30692 (49.1) |
39499 (51.1) |
<.001 |
Unknown |
3476 (29.8) |
7758 (37.3) |
8184 (32.4) |
5910 (26.2) |
<.001 |
ER status |
|||||
Positive |
9676 (33.3) |
29385 (44.3) |
65994 (50.7) |
91471 (51.8) |
<.001 |
Negative |
3001 (33.2) |
8758 (41.6) |
16912 (47.6) |
24018 (48.6) |
<.001 |
borderline |
265 (31.9) |
241 (38.1) |
148 (42.4) |
232 (40.6) |
<.001 |
Unknown/other |
9755 (24.7) |
6780 (31.3) |
11450 (33.2) |
6327 (30.1) |
<.001 |
PR status |
|||||
Positive |
8345 (33.9) |
25085 (44.5) |
55439 (51.4) |
77051 (52.4) |
<.001 |
Negative |
4045 (32.3) |
11739 (42.0) |
25488 (47.8) |
36697 (49.0) |
<.001 |
borderline |
182 (26.4) |
344 (36.8) |
449 (45.2) |
876 (45.7) |
<.001 |
Unknown/other |
10125 (25.0) |
7996 (32.8) |
13128 (34.2) |
7424 (31.2) |
<.001 |
Surgery, primary site |
|||||
BCS |
17489 (68.3) |
37265 (71.3) |
75595 (70.0) |
97670 (70.6) |
<.001 |
Mastectomy |
5135 (9.8) |
7740 (13.6) |
18770 (20.4) |
24254 (22.3) |
<.001 |
Unknown/other |
73 (21.0) |
159 (30.1) |
139 (33.3) |
124 (27.9) |
0.002 |
Living |
|||||
Urban large |
18990 (30.3) |
38310 (41.9) |
77470 (47.9) |
99325 (50.3) |
<.001 |
Urban small |
2742 (23.5) |
4765 (36.0) |
14569 (43.9) |
20247 (45.6) |
<.001 |
Rural |
183 (17.0) |
393 (29.1) |
1434 (36.9) |
2345 (42.3) |
<.001 |
Unknown |
782 (27.7) |
1696 (46.5) |
1031 (52.9) |
131 (39.6) |
<.001 |
*RT = radiotherapy; LN = Lymph node; ER = estrogen receptor, PR = progesterone receptor; BCS = Breast-conserving surgery.
Table 2: Characteristics of patients in Utah undergoing PRRT or PORT before and after PS matching adjustment from 1988–2007*
Before PS matching adjustment |
After PS matching adjustment |
|||||
|---|---|---|---|---|---|---|
Characteristic |
PRRT |
PORT |
P-value† |
PRRT |
PORT |
P-value† |
Number of patients |
2371 |
4671 |
1854 |
1854 |
||
Race |
||||||
White |
2331 (98.3) |
4559 (97.6) |
0.151 |
1818 (98.1) |
1821 (98.2) |
0.525 |
Black |
5 (0.2) |
13 (0.3) |
5 (0.3) |
2 (0.1) |
||
Other/unknown |
35 (1.5) |
99 (2.1) |
31 (1.7) |
31 (1.7) |
||
Hispanic |
||||||
Yes |
110 (4.6) |
204 (4.4) |
0.601 |
96 (5.2) |
90 (4.9) |
0.652 |
No |
2261 (95.4) |
4467 (95.6) |
1758 (94.8) |
1764 (95.1) |
||
Age group, y |
||||||
20–39 |
158 (6.7) |
285 (6.1) |
<.001 |
132 (7.1) |
113 (6.1) |
0.589 |
40–49 |
379 (16.0) |
898 (19.2) |
313 (16.9) |
311 (16.8) |
||
50–69 |
1171 (49.4) |
2347 (50.2) |
882 (47.6) |
909 (49.0) |
||
≥70 |
663 (28.0) |
1141 (24.4) |
527 (28.4) |
521 (28.1) |
||
Married |
||||||
Yes |
1564 (66.0) |
3227 (69.1) |
0.003 |
1186 (64.0) |
1222 (65.9) |
0.334 |
No |
780 (32.9) |
1367 (29.3) |
649 (35.0) |
609 (32.8) |
||
Unknown |
27 (1.1) |
77 (1.6) |
19 (1.0) |
23 (1.2) |
||
Laterality |
||||||
Unilateral |
2369 (99.9) |
4670 (100.0) |
0.226 |
1853 (99.9) |
1853 (99.9) |
1.000 |
Bilateral |
2 (0.1) |
1 (0.0) |
1 (0.1) |
1 (0.1) |
||
Grade |
||||||
High |
399 (16.8) |
940 (20.1) |
<.001 |
327 (17.6) |
346 (18.7) |
0.451 |
Intermediate |
956 (40.3) |
2018 (43.2) |
826 (44.6) |
786 (42.4) |
||
Low |
560 (23.6 |
1486 (31.8) |
467 (25.2) |
497 (26.8) |
||
Unknown |
456 (19.2) |
227 (4.9) |
234 (12.6) |
225 (12.1) |
||
Stage |
||||||
I |
1201 (50.7) |
2283 (48.9) |
<.001 |
989 (53.3) |
931 (50.2) |
0.368 |
II |
513 (21.6) |
1381 (29.6) |
433 (23.4) |
447 (24.1) |
||
III |
329 (13.9) |
774 (16.6) |
248 (13.4) |
280 (15.1) |
||
IV |
59 (2.5) |
70 (1.5) |
42 (2.3) |
45 (2.4) |
||
Unknown/other |
269 (11.3) |
163 (3.5) |
142 (7.7) |
151 (8.1) |
||
LN status |
||||||
Negative |
1453 (61.3) |
2788 (59.7) |
<.001 |
1189 (64.1) |
1139 (61.4) |
0.235 |
Positive |
645 (27.2) |
1676 (35.9) |
507 (27.3) |
547 (29.5) |
||
Unknown |
273 (11.5) |
207 (4.4) |
158 (8.5) |
168 (9.1) |
||
ER status |
||||||
Positive |
1396 (58.9) |
3548 (76.0) |
<.001 |
1323 (71.4) |
1356 (73.1) |
0.460 |
Negative |
347 (14.6) |
953 (20.4) |
339 (18.3) |
329 (17.7) |
||
borderline |
20 (0.8) |
18 (0.4) |
16 (0.9) |
18 (1.0) |
||
Unknown/other |
608 (25.6) |
152 (3.3) |
176 (9.5) |
151 (8.1) |
||
PR status |
||||||
Positive |
1227 (51.8) |
3159 (67.6) |
<.001 |
1155 (62.3) |
1200 (64.7) |
0.327 |
Negative |
491 (20.7) |
1284 (27.5) |
484 (26.1) |
468 (25.2) |
||
borderline |
31 (1.3) |
72 (1.5) |
31 (1.7) |
30 (1.6) |
||
Unknown/other |
622 (26.2) |
156 (3.3) |
184 (9.9) |
156 (8.4) |
||
Surgery, primary site |
||||||
BCS |
1837 (77.5) |
3478 (74.5) |
0.013 |
1457 (78.6) |
1408 (75.9) |
0.158 |
Mastectomy |
531 (22.4) |
1190 (25.5) |
396 (21.4) |
445 (24.0) |
||
Unknown/other |
3 (0.1) |
3 (0.1) |
1 (0.1) |
1 (0.1) |
||
Living |
||||||
Urban large |
1920 (81.0) |
3621 (77.5) |
0.002 |
1499 (80.9) |
1480 (79.8) |
0.555 |
Urban small |
344 (14.5) |
824 (17.6) |
262 (14.1) |
285 (15.4) |
||
Rural |
107 (4.5) |
226 (4.8) |
93 (5.0) |
89 (4.8) |
||
Year‡ |
||||||
1988–1992 |
854 (36.0) |
14 (0.3) |
<.001 |
528 (28.5) |
10 (0.5) |
<.001§ |
1993–1997 |
1368 (57.7) |
15 (0.3) |
1185 (63.9) |
11 (0.6) |
||
1998–2002 |
12 (0.5) |
2345 (50.2) |
11 (0.6) |
973 (52.5) |
||
2003–2007 |
137 (5.8) |
2297 (49.2) |
130 (7.0) |
860 (46.4) |
||
Status |
||||||
Dead breast |
481 (20.3) |
632 (13.5) |
<.001 |
374 (20.2) |
250 (13.5) |
<.001§ |
Dead other |
833 (35.1) |
680 (14.6) |
629 (33.9) |
311 (16.8) |
||
Alive |
1057 (44.6) |
3359 (71.9) |
851 (45.9) |
1293 (69.7) |
||
*Numbers before (n = 7042 patients) and after (n = 3720 patients) adjustment differ with 1:1 propensity score (PS) matching. Covariates used for PS matching-adjusted analysis: age, race, Hispanic origin, marital status, place of residence, laterality, tumor grade, stage, LN status, surgery mode, ER status, and PR status. LN = Lymph node; ER = estrogen receptor; PR = progesterone receptor; PRRT = preoperative radiotherapy; PORT = postoperative radiotherapy.
§Not applicable (patients excluded from Multivariable-adjusted analysis).
†P values based on Pearson’s Chi-square test for categorical (counts, percentage) variables.
‡Numbers and row percentages.
All statistical analyses were performed using SPSS statistical software, version 22.0 (IBM Corp, Armonk, NY) or R version 3.2.3 [21]. All statistical testes were two-sided, with statistical significance determined by P values below 0.05.
RESULTS
Survival benefit of adjuvant radiation with cancer-directed surgery
We identified 636,181 patients with malignant breast cancer from 18 registries dating from 1988 to 2007 (Supplementary Table 1). Of this cohort, 351,768 patients were stratified into the non-RT group and 284,413 patients were stratified into the RT group. The largest proportion of patients in the non-RT group were those who underwent mastectomy (72.3%), whereas most of the patients in the RT group were treated with BCS (80.2%) (Supplementary Table 1). However, an increase in the use of radiation with surgery was observed over time among all patient groups, including both the BCS group (from 68.3% in 1988–1992 to 70.6% in 2003–2007, Ptrend < 0.001) and the mastectomy group (from 9.8% in 1988–1992 to 22.3% in 2003–2007, Ptrend < 0.001). Overall, the rate increased from 29.0% in 1988–1992 to 49.3% in 2003–2007 (Ptrend < 0.001) (Table 1).
Survival analyses were performed between the non-RT and RT groups, with a median follow-up time of 109 months for patients with malignant breast cancer (interquartile range [IQR], 74–154 months). As a result, patients who received radiation with surgery had better OS (hazard ratio [HR] = 0.79, 95% confidence interval [CI] = 0.79–0.80, P < 0.001) and breast cancer-specific survival (BCSS) (HR = 0.90, 95% CI = 0.88 to 0.91, P < 0.001) than their counterparts (Supplementary Figure 1). Given that surgery with radiation had greater survival benefit than surgery alone for patients with breast cancer, we further investigated whether radiation sequence with surgery was associated with survival outcomes.
Trends in radiation sequence with surgery
Next, we identified all of the eligible patients (n = 1,111,218) in the 18 registries from 1973 to 2013, stratified them into eight groups according to the sequences recorded, and analyzed the rate of sequences in each registry. The data showed that about half of the patients underwent radiation with surgery, and almost all of the patients received PORT; with the exception of Utah, less than one percent of patients in the registries received other sequences. In Utah, 12.9% of cases were treated with PPRT and 27.4% with PORT (Supplementary Table 2).
Hence, we selected out the patients (n = 7,042) registered in Utah from 1988 to 2007 to further analyze the differences in trends and outcomes between PRRT (n = 2,371) and PORT (n = 4,671). Patient clinicopathologic factors and the balance in patient characteristics achieved after multiple imputations and 1:1 (PRRT: PORT) PS matching adjustments to estimate the average treatment effects are listed in Table 2. Most clinicopathologic factors were related to the sequence of radiation and surgery. Patients diagnosed during later years, younger patients, married patients, patients with low-stage cancer, patients with positive LN status, patients with positive ER/PR status, and patients living in smaller urban regions were less likely to receive PRRT (P < 0.05). Between 1988 and 2007, a significant change in treatment sequences was observed. Nearly all of the patients diagnosed between 1988 and 1997 (median percent = 98.8%, IQR = 98.3%-99.1%) underwent PRRT, whereas most of those diagnosed between 1998 and 2007 (median percent = 99.0%, IQR = 97.0%–99.5%) received PORT (Supplementary Figure 2). Moreover, the treatment choice shifted from 1997 (98.0% PRRT) to 1998 (99.4% PORT).
Survival benefit of radiation after surgery over radiation prior to surgery
Outcomes of PRRT and PORT for patients with malignant breast cancer were evaluated using survival analyses based on patients in Utah from 1988 to 2007. The median follow-up time of patients from diagnosis was 120 months (IQR = 80–168). In the overall cohort, breast cancer was identified as the predominant cause of death in 15.8% of women, followed by cardiovascular disease (7.3% of all deaths) and unknown causes (7.4% of all deaths). After that, mortality caused by other malignant disease and pulmonary disease accounted for 4.1% and 1.5% of all deaths, respectively (Table 3 shows data for the original patient cohort and the cohort adjusted by PS matching). OS adjusted by PS matching was higher for patients who underwent PORT (5-year OS = 83.8%, 10-year OS = 56.1%) than those who received PRRT (5-year OS = 79.7%, 10-year OS = 33.7%); this finding was confirmed by both multivariable-adjusted (HR = 0.82, 95%CI = 0.75–0.90, P < 0.001) and PS matching-adjusted (HR = 0.79, 95%CI = 0.71–0.88, P < 0.001) analyses. After PS-matching adjustment, 10-year BCSS was 81.4% in the PORT group and 72.8% in the PRRT group (absolute difference, 8.6%). This result significantly differed from the proportional-hazard assumption in the Cox regression hazard model not only after multivariable adjustment (HR = 0.71, 95%CI = 0.62–0.81, P < 0.001) but also after PS-matching adjustment (HR = 0.69, 95%CI = 0.59–0.82, P < 0.001) (Table 4; data for other clinical factors showing an effect on OM or BCM are listed in Supplementary Tables 3 and 4). Additionally, a higher risk of cardiovascular disease-specific mortality was detected in patients who underwent PRRT compared to those who underwent PORT (PS matching-adjustment: HR = 0.73, 95%CI = 0.57–0.95, P = 0.021). No significant difference in death caused by other malignant disease was observed in the unadjusted groups (P = 0.603) or adjusted groups (PS matching-adjustment, P = 0.828) (Table 4).
Table 3: Causes of mortality stratified by treatment groups in Utah form 1988–2007*
Unadjusted |
PS matching-adjusted |
|||||
|---|---|---|---|---|---|---|
Causes of Death |
PRRT |
PORT |
Total |
PRRT |
PORT |
Total |
Number of patients |
2371 |
4671 |
7042 |
1854 |
1854 |
3708 |
Alive at last follow-up |
1057 (44.6) |
3359 (71.9) |
4416 (62.7) |
851 (45.9) |
1293 (69.7) |
2144 (57.8) |
Cause of death, % |
||||||
Breast cancer |
481 (20.3) |
632 (13.5) |
1113 (15.8) |
374 (20.2) |
250 (13.5) |
624 (16.8) |
Other malignant disease |
143 (6.0) |
148 (3.2) |
291 (4.1) |
107 (5.8) |
64 (3.5) |
171 (4.6) |
Cardiovascular disease |
308 (13.0) |
208 (4.5) |
516 (7.3) |
228 (12.3) |
98 (5.3) |
326 (8.8) |
Pulmonary disease |
62 (2.6) |
45 (1.0) |
107 (1.5) |
50 (2.7) |
19 (1.0) |
69 (1.9) |
Infectious disease |
17 (0.7) |
11 (0.2) |
28 (0.4) |
14 (0.8) |
5 (0.3) |
19 (0.5) |
Diabetes mellitus |
24 (1.0) |
24 (0.5) |
48 (0.7) |
18 (1.0) |
11 (0.6) |
29 (0.8) |
Other/unknown |
279 (11.8) |
244 (5.2) |
523 (7.4) |
212 (11.4) |
114 (6.1) |
326 (8.8) |
*PS: propensity score; PRRT = preoperative radiotherapy; PORT = postoperative radiotherapy.
Table 4: Analysis of OS and DSS between groups (unadjusted, multivariable-adjusted, and PS matching-adjusted Cox proportional hazards regression models) in Utah form 1988–2007*
Treatment |
Unadjusted |
Multivariable-adjusted |
PS matching-adjusted† |
PS matching-adjusted survival rates |
||||
|---|---|---|---|---|---|---|---|---|
HR |
P |
HR |
P |
HR |
P |
5-year (%) |
10-year (%) |
|
Overall survival |
||||||||
PRRT |
Ref. |
Ref. |
Ref. |
79.7 |
33.7 |
|||
PORT |
0.79 (0.73–0.86) |
<.001 |
0.82 (0.75–0.90) |
<.001 |
0.79 (0.71–0.88) |
<.001 |
83.8 |
56.1 |
Breast cancer–specific survival |
||||||||
PRRT |
Ref. |
Ref. |
Ref. |
87.9 |
72.8 |
|||
PORT |
0.80 (0.71–0.91) |
<.001 |
0.71 (0.62–0.81) |
<.001 |
0.69 (0.59–0. 82) |
<.001 |
90.5 |
81.4 |
Other malignant disease–specific survival |
||||||||
PRRT |
Ref. |
Ref. |
Ref. |
98.2 |
88.4 |
|||
PORT |
0.94 (0.73–1.20) |
0.603 |
0.99 (0.77–1.28) |
0.936 |
0.96 (0.69–1.34) |
0.828 |
97.9 |
93.2 |
Cardiovascular disease–specific survival |
||||||||
PRRT |
Ref. |
Ref. |
Ref. |
95.8 |
77.4 |
|||
PORT |
0.61 (0.51–0.74) |
<.001 |
0.93 (0.43–1.97) |
0.839 |
0.73 (0.57–0.95) |
0.021 |
97.1 |
88.9 |
*Cox proportional hazard regression analysis for overall survival and competing risk survival models for breast cancer-specific survival were used (two-sided). Covariates for multivariable/PS matching-adjustment: age, race, Hispanic origin, marital status, place of residence, laterality, tumor grade, stage, LN status, surgery mode, ER status, and PR status. CI = confidence interval; HR = hazard ratio; PS = propensity score; PRRT = preoperative radiotherapy; PORT = postoperative radiotherapy; Ref. = referent; OS = overall survival; DSS = disease-specific survival.
†Multivariate analysis of PS matching-adjusted groups.
Because the largest proportion of overall mortality was due to breast cancer mortality, we further stratified by AJCC stage, one of the major indices for breast cancer-directed surgery in the NCCN treatment guidelines, and analyzed OS and BCSS in patients from the two groups. Significant correlations of the PS matching-adjusted OS and BCSS with AJCC stages were observed; specifically, patients diagnosed at stage IV demonstrated no significant difference in either 10-year OS (absolute difference, 0.5%; log-rank test, P = 0.2069) or 10-year BCSS (absolute difference, 8.5%; log-rank test, P = 0.4133) compared with patients diagnosed at stage III, who exhibited marked increases in OS (absolute difference, 25.4%; log-rank test, P = 0.0003,) and BCSS (absolute difference, 27.4%; log-rank test, P = 0.0011; Figure 1, Table 5). Moreover, patients of stage I and II had a significant increase in 10-year OS (stage I: absolute difference, 27.7%; log-rank test, P = 0.0124; stage II: absolute difference, 20.6%; log-rank test, P = 0.0228, respectively) but not BCS (stage I: absolute difference, 6.1%; log-rank test, P = 0.0578; stage II: absolute difference, 8.4%; log-rank test, P = 0.0763, respectively). These results were confirmed by Cox proportional-hazard regression analyses (Table 5).
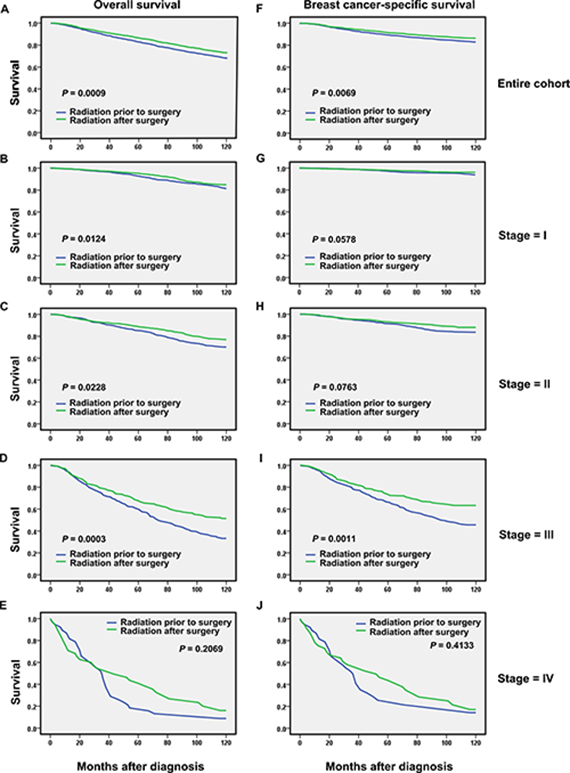
Figure 1: Overall and breast cancer–specific survival by radiation sequence with surgery in the overall group and stratified by stage groups based on propensity score (PS) matching-adjusted survival data in Utah from 1988–2007. All P values based on PS matching-adjusted, two-sided log-rank test. Left column, overall survival: (A) entire cohort, (B) stage I, (C) stage II, (D) stage III, and (E) stage IV. Right column, breast cancer–specific mortality: (F) entire cohort, (G) stage I, (H) stage II, (I) stage III, and (J) stage IV.
Table 5: Subgroup analysis of overall and breast cancer-specific survival, stratified by 4 stage-groups in Utah form 1988–2007*
Treatment |
Unadjusted |
Multivariable-adjusted |
PS matching-adjusted† |
PS matching-adjusted survival rates |
||||
|---|---|---|---|---|---|---|---|---|
HR (95% CI) |
P |
HR (95% CI) |
P |
HR (95% CI) |
P |
5-year (%) |
10-year (%) |
|
Overall survival |
||||||||
Stage I |
||||||||
PRRT |
Ref. |
Ref. |
Ref. |
90.2 |
42.1 |
|||
PORT |
0.89 (0.77–1.02) |
0.097 |
0.85 (0.74–0.98) |
0.028 |
0.78 (0.65–0.95) |
0.011 |
93.5 |
69.8 |
Stage II |
||||||||
PRRT |
Ref. |
Ref. |
Ref. |
81.9 |
39.7 |
|||
PORT |
0.79 (0.67–0.94) |
0.007 |
0.82 (0.68–0.98) |
0.029 |
0.76 (0.60–1.66) |
0.030 |
87.0 |
60.3 |
Stage III |
||||||||
PRRT |
Ref. |
Ref. |
Ref. |
52.1 |
12.1 |
|||
PORT |
0.60 (0.51–0.71) |
<.001 |
0.64 (0.53–0.77) |
<.001 |
0.62 (0.49–0.79) |
<.001 |
64.7 |
37.5 |
Stage IV |
||||||||
PRRT |
Ref. |
Ref. |
Ref. |
13.2 |
2.9 |
|||
PORT |
1.02 (0.71–1.47) |
0.920 |
0.94 (0.61–1.44) |
0.771 |
0.83 (0.50–1.37) |
0.469 |
35.3 |
2.4 |
Breast cancer–specific survival |
||||||||
Stage I |
||||||||
PRRT |
Ref. |
Ref. |
Ref. |
96.1 |
85.6 |
|||
PORT |
0.74 (0.56–0.99) |
0.040 |
0.76 (0.56–1.02) |
0.067 |
0.75 (0.52–1.09) |
0.137 |
97.6 |
91.7 |
Stage II |
||||||||
PRRT |
Ref. |
Ref. |
Ref. |
89.7 |
72.1 |
|||
PORT |
0.78 (0.61–1.00) |
0.048 |
0.79 (0.61–1.03) |
0.083 |
0.79 (0.56–1.12) |
0.190 |
91.9 |
80.5 |
Stage III |
||||||||
PRRT |
Ref. |
Ref. |
Ref. |
60.9 |
29.1 |
|||
PORT |
0.65 (0.54–0.79) |
<.001 |
0.61 (0.49–0.76) |
<.001 |
0.58 (0.44–0.77) |
<.001 |
72.0 |
56.5 |
Stage IV |
||||||||
PRRT |
Ref. |
Ref. |
Ref. |
21.4 |
14.3 |
|||
PORT |
1.14 (0.77–1.68) |
0.527 |
1.08 (0.68–1.71) |
0.737 |
0.92 (0.54–1.56) |
0.750 |
37.6 |
5.8 |
*Cox proportional hazard regression analysis for overall survival and competing risk survival models for breast cancer–specific survival were used (two-sided). Covariates for multivariable/PS matching-adjustment: age, race, Hispanic origin, marital status, place of residence, laterality, tumor grade, stage, LN status, surgery mode, ER status, and PR status. CI = confidence interval; HR = hazard ratio; PS = propensity score; PRRT = preoperative radiotherapy; PORT = postoperative radiotherapy; Ref. = referent.
†Multivariate analysis of PS matching-adjusted groups.
The findings concerning DSS were comparable to those from the secondary 1:1 PS matching-adjusted competing risk analyses (Supplementary Table 5).
DISCUSSION
Our data confirmed the critical role of radiation in the multidisciplinary management of breast cancer [9, 22]. As the use of different sequence patterns for RT and surgery has gained attention in recent clinical trials [23, 24], we analyzed the rate of all the patterns recorded in SEER and found that sequence patterns other than PORT were rarely used, with the exception of in the Utah registry. Treatment trends in Utah shifted abruptly from a median of 98.8% of cases undergoing PRRT before 1988 to a median of 99.0% of cases receiving PORT after 1988. Reasons for this geographical difference as well as the abrupt time variation remain unclear and should be further studied.
Significantly higher risks of both OM and BCM were observed among patients who received PRRT compared to those who underwent PORT. Recent evidence has demonstrated that cancer stem cell (CSC) frequency is correlated not only to outcomes for patients with malignant cancers but also to radiation resistance [25, 26]. After conventional treatment, residual breast tumor cell populations may survive and be enriched with CSCs, resulting in recurrence and reduced long-term survival in breast cancer patients [27–29]. Pathological complete response (pCR) after preoperative therapy leads to visibly reduced tumor size, providing a chance for surgery and improving the rate of complete remission for operable tumors. Nevertheless, the cells that survive RT and are not removed because of the reduced extent of resection are likely to cause the worse outcomes in PRRT than in PORT. Moreover, PRRT may also inhibit the function of hematopoietic system and immune system, which is highly sensitive to radiation (ref), and then may reduce the long-term outcome of patients. In the survival analyses, a strong association was observed between various types of mortality and clinical stage. Significantly worse outcomes were observed for PRRT than PORT in patients diagnosed with stage I, II and III cancer but not stage IV. The small number of patients with stage IV cancer may have led to the non-significant difference between treatments for those patients. These results suggest that further assessment of the long-term treatment efficacy of different modalities of radiation with surgery is warranted and that a less invasive and more restrained and individualized local treatment strategy based on one’s probability of local recurrence and mortality risk should be considered.
Moreover, with regard to mortality from causes other than breast cancer, the group undergoing PRRT was more likely to die of cardiovascular disease than the PORT group. Although the increased risks for cardiac mortality of radiotherapy have been well established [30, 31], further investigation into why the PRRT group had higher cardiotoxicity is needed.
One strength of our study is that it is a novelpopulation-based study to investigate the trends in radiation sequence with surgery and to compare the outcomes between PRRT and PORT. Although similar studies [22, 32] have pointed out the benefit of adjuvant radiotherapy after cancer-directed surgery for patients with cancer, such as metastatic gastric cancer and ductal carcinoma In Situ. However, the difference in outcomes of sequences of surgery and radiation for treatment of cancer hasn’t been systematically addressed. SEER has long employed a consistent algorithm not only to ascertain cause of death but also to ensure that disease-specific survival is determined as accurately as possible [14]. Moreover, advanced statistical methodology to account for the known biases between treatment groups in retrospective data were also applied in our study. Furthermore, our results provide information to guide individual treatment options based on clinical stages and to inform future studies.
There are several limitations to our study. Because unmeasured confounders such as pCR following PRRT and reasons for treatment selection were not available in the SEER database and may have influenced overall results, our results should be interpreted with some caution. To date, whether there is a direct relationship between pCR in neoadjuvant therapy and long-term outcomes is still uncertain [33]. However, if improved pCR is associated with improved long-term survival, differences in outcome between PRRT and PORT may be underestimated for pCR-positive patients in this study. Hence, more prospective studies should be performed to evaluate the survival difference between sequence patterns. Another limitation of our study is the relatively small number of cases included. The geographical characterization and abrupt time variation might have led to bias in treatment outcomes. Finally, although we evaluated the association of treatment with survival endpoints only, it is important to acknowledge that recurrence endpoints and impact on quality of life are also meaningful to patients and thus should be considered in future studies.
CONCLUSIONS
In conclusion, PORT was still the first option of radiation sequence with surgery between 1991 and 2010 in the United States. Compared with patients who underwent PORT, those who received PRRT had a strikingly worse OS and DSS, indicating the need for a more thoughtful and restrained treatment approach to this disease. Therefore, prospective studies aiming to confirm our findings and tailored sequence modalities for malignant breast cancer are urgently needed.
Abbreviations
AJCC: American Joint Committee on Cancer; BCM: breast cancer-specific mortality; BCS: breast-conserving surgery; CI: confidence interval; CSC: cancer stem cells; DSS: disease-specific survival; ER: estrogen receptor; HR: hazard ratio; LN: lymph node; OM: overall mortality; OS: overall survival; PRRT: preoperative radiotherapy; PORT: postoperative radiotherapy; Pathological complete response (pCR); SEER: The Surveillance, Epidemiology, and End Results; PS: propensity score; RT: radiotherapy; PR: progesterone receptor.
Author contributions
W.F., and W.J conceived and designed the study. W.F., H.S, Y.Z., M.C., L.Y., and S.G, participated in the collection, discussion, and analysis of the data. W.F. and W.J. wrote the paper. All authors read and approved the final manuscript.
CONFLICTS OF INTEREST
The authors declare that they have no competing interests.
FUNDING
This work was supported by the grant of National Natural Science Foundation of China (81472669).
REFERENCES
1. Torre LA, Bray F, Siegel RL, Ferlay J, Lortet-Tieulent J, Jemal A. Global cancer statistics, 2012. CA Cancer J Clin. 2015; 65:87–108. https://doi.org/10.3322/caac.21262.
2. DeVita VT Jr, Chu E. A history of cancer chemotherapy. Cancer Res. 2008; 68:8643–53. https://doi.org/10.1158/0008-5472.CAN-07-6611.
3. Siegel RL, Miller KD, Jemal A. Cancer statistics, 2016. CA Cancer J Clin. 2016; 66:7–30. https://doi.org/10.3322/caac.21332.
4. Richards BM. Deoxyribose nucleic acid values in tumour cells with reference to the stem-cell theory of tumour growth. Nature. 1955; 175:259–61. https://doi.org/10.1038/175259a0.
5. Clarke MF, Dick JE, Dirks PB, Eaves CJ, Jamieson CH, Jones DL, Visvader J, Weissman IL, Wahl GM. Cancer stem cells—perspectives on current status and future directions: AACR Workshop on cancer stem cells. Cancer Res. 2006; 66:9339–44. https://doi.org/10.1158/0008-5472.CAN-06-3126.
6. Clarke MF, Fuller M. Stem cells and cancer: two faces of eve. Cell. 2006; 124:1111–15. https://doi.org/10.1016/j.cell.2006.03.011.
7. Eifel P, Axelson JA, Costa J, Crowley J, Curran WJ Jr, Deshler A, Fulton S, Hendricks CB, Kemeny M, Kornblith AB, Louis TA, Markman M, Mayer R, Roter D. National Institutes of Health Consensus Development Conference Statement: adjuvant therapy for breast cancer, November 1-3, 2000. J Natl Cancer Inst. 2001; 93:979–89.
8. National Comprehensive Cancer Network (NCCN). NCCN Clinical Practice Guidelines in Oncology (NCCN Guidelines). Breast Cancer Version2. 2017. http://www.nccn.com.
9. Darby S, McGale P, Correa C, Taylor C, Arriagada R, Clarke M, Cutter D, Davies C, Ewertz M, Godwin J, Gray R, Pierce L, Whelan T, et al, and Early Breast Cancer Trialists’ Collaborative Group (EBCTCG). Effect of radiotherapy after breast-conserving surgery on 10-year recurrence and 15-year breast cancer death: meta-analysis of individual patient data for 10,801 women in 17 randomised trials. Lancet. 2011; 378:1707–16. https://doi.org/10.1016/S0140-6736(11)61629-2.
10. Worni M, Akushevich I, Greenup R, Sarma D, Ryser MD, Myers ER, Hwang ES. Trends in treatment patterns and outcomes for ductal carcinoma in situ. J Natl Cancer Inst. 2015; 107:djv263. https://doi.org/10.1093/jnci/djv263.
11. Clarke M, Collins R, Darby S, Davies C, Elphinstone P, Evans V, Godwin J, Gray R, Hicks C, James S, MacKinnon E, McGale P, McHugh T, et al, and Early Breast Cancer Trialists’ Collaborative Group (EBCTCG). Effects of radiotherapy and of differences in the extent of surgery for early breast cancer on local recurrence and 15-year survival: an overview of the randomised trials. Lancet. 2005; 366:2087–106. https://doi.org/10.1016/S0140-6736(05)67887-7.
12. Touboul E, Lefranc JP, Blondon J, Buffat L, Deniaud E, Belkacémi Y, Benmiloud M, Huart J, Laugier A, Schlienger M. Primary chemotherapy and preoperative irradiation for patients with stage II larger than 3 cm or locally advanced non-inflammatory breast cancer. Radiother Oncol. 1997; 42:219–29. https://doi.org/10.1016/S0167-8140(97)01923-3.
13. Souchon R, Dunst J, Hartmann KA. [Role of radiation therapy on the use of primary (“neoadjuvant”) systemic treatment of breast cancer]. [Article in German]. Strahlenther Onkol. 2006; 182:202–09. https://doi.org/10.1007/s00066-006-1483-2.
14. SEER. National Cancer Institute, Surveillance Epidemiology and End Results. http://seer.cancer.gov/.
15. Curtis RE, Freedman DM, Sherman ME, Fraumeni JF Jr. Risk of malignant mixed mullerian tumors after tamoxifen therapy for breast cancer. J Natl Cancer Inst. 2004; 96:70–74. https://doi.org/10.1093/jnci/djh007.
16. Tichy JR, Lim E, Anders CK. Breast cancer in adolescents and young adults: a review with a focus on biology. J Natl Compr Canc Netw. 2013; 11:1060–69. https://doi.org/10.6004/jnccn.2013.0128.
17. Lund JL, Harlan LC, Yabroff KR, Warren JL. Should cause of death from the death certificate be used to examine cancer-specific survival? A study of patients with distant stage disease. Cancer Invest. 2010; 28:758–64. https://doi.org/10.3109/07357901003630959.
18. Hansen BB, Bowers J. Covariate balance in simple, stratified and clustered comparative studies. Stat Sci. 2008; 23:219–36. https://doi.org/10.1214/08-STS254.
19. Thoemmes F. Propensity score matching in SPSS. arXiv preprint arXiv:12016385. 2012.
20. Fine JP, Gray RJ. A proportional hazards model for the subdistribution of a competing risk. J Am Stat Assoc. 1999; 94:496–509. https://doi.org/10.1080/01621459.1999.10474144.
21. The R Project for Statistical Computing. https://www.r-project.org.
22. Sagara Y, Freedman RA, Vaz-Luis I, Mallory MA, Wong SM, Aydogan F, DeSantis S, Barry WT, Golshan M. Patient prognostic score and associations with survival improvement offered by radiotherapy after breast-conserving surgery for ductal carcinoma in situ: A population-based longitudinal cohort study. J Clin Oncol. 2016; 34:1190–96. https://doi.org/10.1200/JCO.2015.65.1869.
23. Horton JK, Blitzblau RC, Yoo S, Geradts J, Chang Z, Baker JA, Georgiade GS, Chen W, Siamakpour-Reihani S, Wang C, Broadwater G, Groth J, Palta M, et al. Preoperative single-fraction partial breast radiation therapy: a novel phase 1, dose-escalation protocol with radiation response biomarkers. Int J Radiat Oncol Biol Phys. 2015; 92: 846–55. https://doi.org/10.1016/j.ijrobp.2015.03.007.
24. Rocco N, Rispoli C, Iannone L, Testa S, Antonio Della Corte G, Compagna R, Amato B, Accurso A. Intraoperative radiation therapy with electrons in breast cancer conservative treatment: our experience. Int J Surg. 2014 (Suppl 1); 12:S75–78. https://doi.org/10.1016/j.ijsu.2014.05.049.
25. Wolfe AR, Woodward WA. Breast Cancer Stem Cell Correlates as Predicative Factors for Radiation Therapy. Semin Radiat Oncol. 2015; 25:251–59. https://doi.org/10.1016/j.semradonc.2015.05.009.
26. Hu S, Fu W, Li T, Yuan Q, Wang F, Lv G, Lv Y, Fan X, Shen Y, Lin F, Tang Y, Ye X, Yang Y, Lei C. Antagonism of EGFR and Notch limits resistance to EGFR inhibitors and radiation by decreasing tumor-initiating cell frequency. Sci Transl Med. 2017; 9:9. https://doi.org/10.1126/scitranslmed.aag0339.
27. Creighton CJ, Li X, Landis M, Dixon JM, Neumeister VM, Sjolund A, Rimm DL, Wong H, Rodriguez A, Herschkowitz JI, Fan C, Zhang X, He X, et al. Residual breast cancers after conventional therapy display mesenchymal as well as tumor-initiating features. Proc Natl Acad Sci U S A. 2009; 106:13820–25. https://doi.org/10.1073/pnas.0905718106.
28. Pajonk F, Vlashi E, McBride WH. Radiation resistance of cancer stem cells: the 4 R’s of radiobiology revisited. Stem Cells. 2010; 28:639–48. https://doi.org/10.1002/stem.318.
29. Lacerda L, Pusztai L, Woodward WA. The role of tumor initiating cells in drug resistance of breast cancer: implications for future therapeutic approaches. Drug Resist Updat. 2010; 13:99–108. https://doi.org/10.1016/j.drup.2010.08.001.
30. Harris EE, Correa C, Hwang WT, Liao J, Litt HI, Ferrari VA, Solin LJ. Late cardiac mortality and morbidity in early-stage breast cancer patients after breast-conservation treatment. J Clin Oncol. 2006; 24:4100–06. https://doi.org/10.1200/JCO.2005.05.1037.
31. Gagliardi G, Lax I, Ottolenghi A, Rutqvist LE. Long-term cardiac mortality after radiotherapy of breast cancer—application of the relative seriality model. Br J Radiol. 1996; 69:839–46. https://doi.org/10.1259/0007-1285-69-825-839.
32. Shridhar R, Almhanna K, Hoffe SE, Fulp W, Weber J, Chuong MD, Meredith KL. Increased survival associated with surgery and radiation therapy in metastatic gastric cancer: a Surveillance, Epidemiology, and End Results database analysis. Cancer. 2013; 119:1636–42. https://doi.org/10.1002/cncr.27927.
33. Cardoso F, Senkus E. Breast cancer in 2014: A call back to reality! Nat Rev Clin Oncol. 2015; 12:67–68. https://doi.org/10.1038/nrclinonc.2014.226.