
INTRODUCTION
Clear cell renal cell carcinoma (ccRCC) is the most frequent kidney cancer, which is highly vascularized and characterized by malignant renal epithelial cells with clear cytoplasm. Deletion of the short arm of chromosome 3 that includes the von Hippel Lindau tumor suppressor (VHL) gene correlates with increased expression and activity of HIF-1α and HIF-2α in 90% of the ccRCC patient samples [1]. This is because the VHL protein is part of an active E3 ubiquitin ligase complex that targets HIF-1α for ubiquitin-mediated degradation [2]. The HIF proteins are polyubiquitinated and targeted for degradation during normoxia. However, they accumulate in the nucleus during hypoxia and drive the expression of genes that regulate glycolysis, angiogenesis, and metastasis [3].
HIF-2α is negatively regulated during hypoxia by Monocyte Chemoattractant Protein-induced protein 1 (MCPIP1) in the ccRCC cell line, Caki-1 [4]. Moreover, exogenous expression of HIF2-α in Caki-1 cells decreases MCPIP1 protein levels, thereby indicating a negative feedback loop between these two proteins [4]. MCPIP1, also known as Regnase 1, is an RNase that degrades mRNAs and miRNAs [5–7]. The PilT N terminus (PIN) domain is essential for the endonucleolytic activity of MCPIP1 [5, 8]. MCPIP1 negatively regulates expression of various pro-inflammatory cytokines such as IL-6 or IL-1β [5, 8, 9] and also NF-κB or AP-1 transcription factors [10,11]. Furthermore, ectopic overexpression of wild-type MCPIP1 downregulates VEGFA and GLUT1 transcripts that are induced during hypoxia [4]. However, regulation of the whole transcriptome of ccRCC cell line by MCPIP1 has not been studied.
Low MCPIP1 levels have been reported in neuroblastoma [12], breast cancer [13] and ccRCC [4,14]. MCPIP1 inhibits growth of ccRCC and neuroblastoma cell lines [4, 12] by enhancing the decay of anti-apoptotic gene transcripts, including Bcl2L1, Bcl2A1, RelB, Birc3, and Bcl3 [13] and negatively regulating the rate of metabolism and angiogenesis [4]. Furthermore, MCPIP1 regulates the secretion of VEGF, IL-8, and CXCL12, which are factors that promote chemotaxis of microvascular endothelial cells, phosphorylation of VE-cadherin, and increased vascular permeability [14]. In vitro and in vivo studies show that downregulation of MCPIP1 is associated with epithelial to mesenchymal transition (EMT) and progression of ccRCC [14]. Therefore, in this study, we investigated the role of MCPIP1 in global transcriptional regulation by performing RNA-Seq analysis of Caki-1 cells that overexpress wild type or RNase-deficient MCPIP1 proteins.
RESULTS AND DISCUSSION
Global transcriptome changes in Caki-1 cells expressing wild type or mutant MCPIP1
To characterize global transcriptome changes upon MCPIP1 overexpression, we generated Caki-1 cell lines expressing doxycycline-inducible wild-type (MCPIP1) or mutant MCPIP1 (inactivated PIN domain; D141N) using lentiviral vectors. Caki-1 cells transduced with a control lentiviral vector (PURO) were used as control. We performed RNA-Seq analysis of RNA isolated from MCPIP1, D141N and PURO cells, which were grown in media containing puromycin for 10 days. Principal component analysis (PCA) demonstrated differential gene expression in all the 3 cell types (Figure 1A). We performed pairwise comparison of gene expression in MCPIP1 and D141N samples against PURO (adj. p. value < 0.05) and showed that 1189 and 4500 transcripts were upregulated and 1270 and 4201 transcripts were downregulated in MCPIP1 and D141N cells, respectively (Figure 1B, Supplementary Table 1). This accounts for 11.6% and 41.8% of the global transcriptome for MCPIP1 and D141N, respectively, because the AmpliSeq-based RNA-Seq covers 20812 human transcripts.
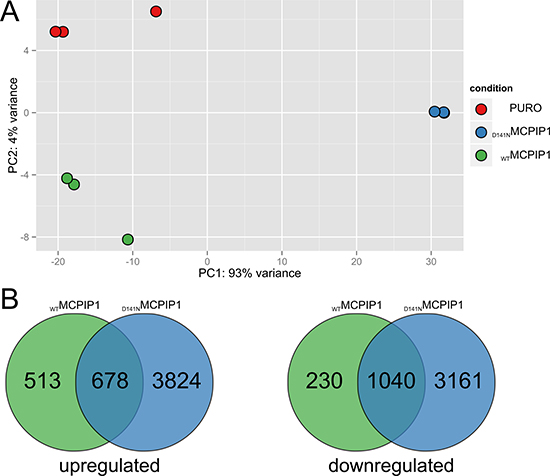
Figure 1: RNA-Seq analysis of global transcriptome changes based on MCPIP1 expression. (A) Principal component analysis (PCA) of RNA-Seq datasets and (B) Venn diagrams show the number of differentially expressed transcripts (adj. P-value < 0.05) in the MCPIP1 and D141N cells relative to the PURO cells (MCPIP1 vs. PURO and D141N vs. PURO datasets). PCA is based on the abundances of all transcripts detected in RNA-Seq analysis.
We performed Gene Ontology (GO) and KEGG enrichment analysis on the differentially expressed genes in the MCPIP1 vs. PURO and D141N vs. PURO groups. The upregulated genes in the MCPIP1 vs. PURO group were enriched in GO terms belonging to 54 biological processes (BP), 4 molecular function (MF), and 13 cellular component (CC) categories (p-adj. < 0.05; Figure 2, Supplementary Table 2). The upregulated genes in the D141N vs. PURO group belonged to 40 BP, 10 MF and 17 CC categories (p-adj. < 0.05; Figure 2 and Supplementary Table 3). The downregulated genes in the MCPIP1 vs. PURO group were enriched in 10 BP, 9 MF, and 7 CC functional categories, whereas the downregulated genes in the D141N vs. PURO group were enriched in 13 BP, 4 MF and 10 CC categories (p-adj. < 0.05; Figure 2, Supplementary Tables 2 and 3). The biological processes upregulated in MCPIP1 and D141N cells (p-adj. < 0.0001) were common in both cell lines and involved in cell cycle, cell division, DNA replication, and DNA repair, whereas those downregulated (p-adj. < 0.01) were distinct in MCPIP1 and D141N cells, and were involved in endoplasmic reticulum stress and nucleotide metabolism, respectively. Moreover, transcripts associated with lysosomes were downregulated in both MCPIP1 and D141N cells.
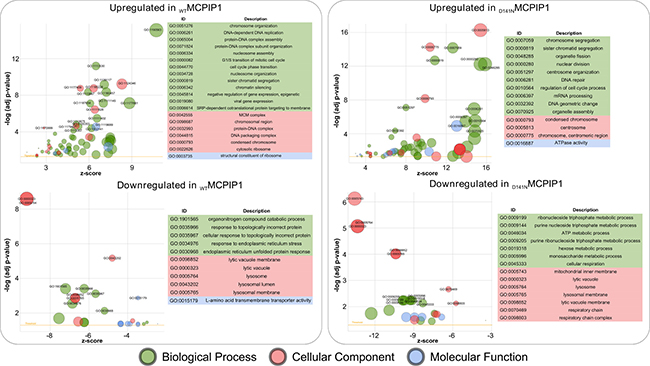
Figure 2: Bubble plot of significantly enriched GO terms in the MCPIP1 vs. PURO and D141N vs. PURO comparative datasets. The differentially regulated genes were based on the cut-off set at adj. p-value of 10-4 and 10-2 for upregulated and downregulated genes, respectively. The y-axis represents the -log10 (p-value) and the x-axis represents the z-score (computed with GOplot R-package). The area of the displayed circles is proportional to the number of genes assigned to the term in the analysis. The threshold indicates adj. p value = 0.05
KEGG enrichment analysis shows 8 upregulated and 2 downregulated pathways in MCPIP1 cells, whereas, 12 upregulated and 7 downregulated pathways were observed in D141N cells (p-adj. < 0.05; Table 1, Supplementary Figure 1, Supplementary Tables 2 and 3). Cell cycle was the top upregulated KEGG pathway, whereas lysosomal regulation was the most downregulated KEGG pathway in MCPIP1 and D141N cells. We additionally analyzed the differentially expressed genes between MCPIP1 and D141N overexpressing cells. GO analysis showed that upregulated genes belonged to 37 BP, 11 MF and 11 CC GO terms, whereas the downregulated genes belonged to 50 BP, 12MF and 20 CC GO terms. KEGG enrichment analysis showed 8 upregulated and 16 downregulated pathways in MCPIP1 cells than in D141N cells. Both GO and KEGG analyses showed that wild-type MCPIP1 downregulated cell cycle, DNA repair and endoplasmic reticulum protein processing (Supplementary Table 4).
Table 1: KEGG pathways overrepresented among genes differentiating control and MCPIP1 and D141N cells
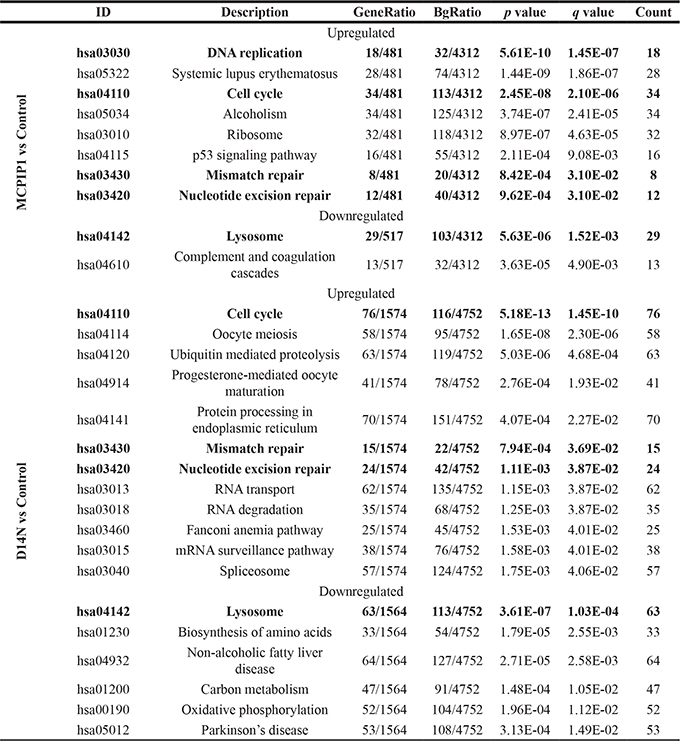
Terms common for both comparisons are bolded. ID – KEGG identifier, GeneRatio – the ratio of number of differentiating genes in a given pathway to the number of differentiating genes with KEGG identifier ; BgRatio – the ratio of number of not differentiating genes in a given pathway to the number of expressed genes with KEGG identifier; p-value - p-value in hypergeometric test; q-value - p-value after FDR correction; Count – number of differentiating genes contributing to a given pathway.
Thus, the RNA-Seq analysis revealed widespread changes in transcript levels in both MCPIP1 and D141N cells. These changes were more pronounced in D141N cells. The functional analysis with GO and KEGG databases demonstrated overlapping and distinct cellular processes for cell lines overexpressing wild type and mutated MCPIP1 protein.
Putative MCPIP1 targets
Next, we analyzed 219 genes that were were downregulated in MCPIP1 cells based on RNA-Seq analysis as possible targets of MCPIP1 RNase. Among these, 183 genes were unchanged in D141N cells (p-adj. < 0.05), whereas, the remaining 36 were upregulated in D141N cells (fold change > 1.5 and p-adj. < 0.05; Supplementary Table 1). On the basis of our functional analysis and on the literature data we selected 15 out of these 219 genes for further validation. These were involved in protein folding, cell cycle regulation, hypoxia response and cell signaling (Table 2). We verified the expression of these 15 selected genes by quantitative real time PCR (qRT-PCR) using the primer sequences listed in Supplementary Table 5.
Table 2: List of 15 transcripts selected for validation based on the RNA-Seq analysis
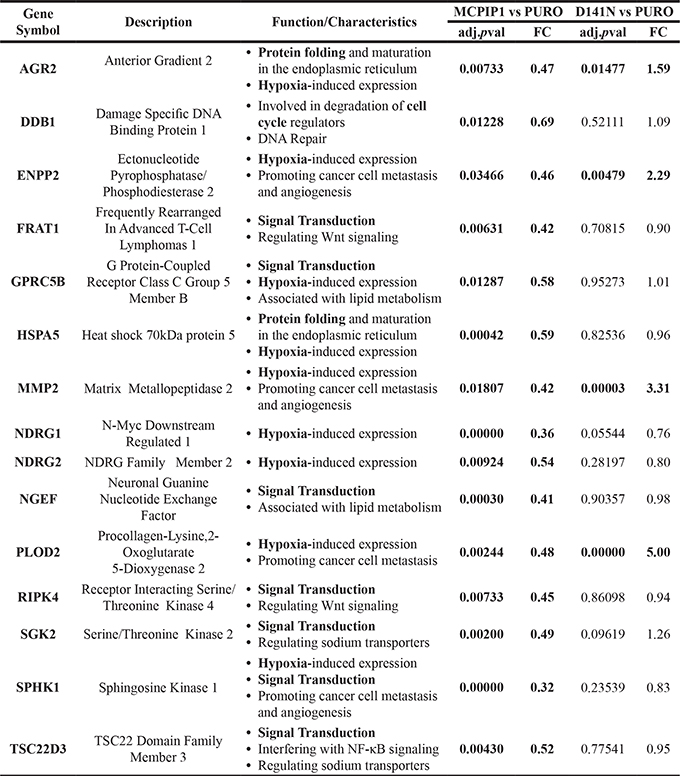
The fold change (FC) and adjusted P-values for the MCPIP1 vs. PURO and D141N vs. PURO comparisons are provided. The full list of transcripts is shown in Supplementary Table 1.
PIN domain is important for viability and proliferation of Caki-1 cells
Previous reports show that overexpression of wild-type MCPIP1 in Caki-1 cells decreases cell survival and proliferation [4]. We confirmed that the MCPIP1 cells showed decreased confluence than in PURO and also in D141N cells. MTT assay also showed that MCPIP1 cells were less viable than PURO and D141N cells (Figure 3A). BrdU incorporation assay showed decreased proliferation of MCPIP1 cells than in PURO and D141N cells (Figure 3A). These results suggest that MCPIP1 regulates proliferation and viability of Caki-1 cells.
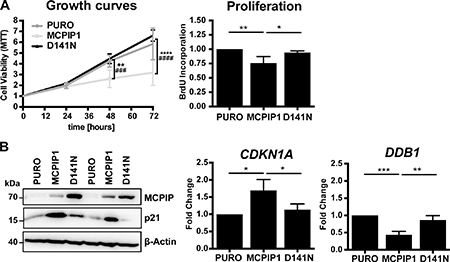
Figure 3: MCPIP1 overexpression decreases growth of Caki-1 cells. (A) Graphical representation of cell viability, proliferation and growth of PURO, MCPIP1 and D141N cells. Cell growth and viability was measured by the MTT assay at 24, 48 and 72 h in the 3 cell lines after induction with doxycycline for 24 h. Cell proliferation was measured by BrdU incorporation for 8 h in the three cell lines after induction with doxycycline for 24 h. (B) Representative western blots show MCPIP1 and p21 expression in PURO, MCPIP1 and D141N cells induced with doxycycline for 24 h. β-Actin is used as a loading control. Histograms show CDKN1A and DDB1 transcript levels relative to RPS13 transcript levels in PURO, MCPIP1 and D141N cells induced with doxycycline for 24 h. Blots represent two out of three identical experiments. Graphs represent mean ± SD from three (B) or four (A) independent experiments. The p-values were estimated by one-way ANOVA followed by Tukey’s HSD tests (*p < 0.05; **p < 0.01; ***p < 0.001; ****p < 0.0001). Note: For the cell growth analysis the two-way ANOVA followed by Tukeys’s independent test was used (* relates to PURO vs. MCPIP1 comparison and # relates to MCPIP1 vs. D141N comparison).
MCPIP1 regulates transcripts of cell cycle regulatory genes
We investigated growth inhibition in MCPIP1 cells by analyzing expression of some cell cycle genes. MCPIP1 cells showed increased expression of the p21Cip1 (CDKN1A) protein and mRNA than in PURO and D141N cells (Figure 3B). The p21Cip1 protein belongs to the Cip/Kip family of inhibitors and blocks cell cycle by inhibiting G1/S and S-phase Cyclin-Cdks (Cyclin D, E and A) [15]. During S phase, p21Cip1 degradation is regulated by the activity of Cul4-DDB1-Cdt2 E3 ligase [16]. In our RNA-Seq analysis, DDB1 (Damage Specific DNA Binding Protein 1) transcript levels were reduced in MCPIP1 cells than in PURO and D141N controls (Table 2 and Supplementary Table 1). QRT-PCR analysis showed that DDB1 mRNA levels were reduced by 2.3-fold and 2-fold in MCPIP1 cells than in PURO and D141N cells (Figure 3B). Therefore, we postulate that lower levels of DDB1 will decrease the growth of MCPIP1 cells by reducing p21Cip1 degradation. Cang et al. showed that conditional knockout of DDB1 in mouse brain blocks the cell cycle and promotes apoptosis [17]. DDB1 knockdown upregulates both p21 protein and mRNA levels, thereby suggesting that regulation of p21 is complex [18].
We also observed that CDT1 (Chromatin Licensing and DNA Replication Factor 1) mRNA levels are upregulated in MCP1P cells (adj. p-value = 3.076E-08 as compared to PURO) and unchanged in D141N cells (Supplementary Table 1). CDT1 is negatively regulated by Cul4-DDB1-Cdt2 complex [17, 19, 20]. It is required for the assembly of pre-replicative complexes (pre-RC) at origins of replication in G1 phase [21]. In human cells, elevated Cdt1 levels promotes re-replication, prevents entry into mitosis and inhibits cell growth by activating Chk1/Chk2 kinases and p21Cip1 [22, 23]. This suggests that MCPIP1 overexpression inhibits cell cycling and growth by upregulating the p21Cip1 cell cycle inhibitor in cells.
MCPIP1 regulates transcripts of factors involved in ER protein misfolding response
MCP1P1 overexpression downregulates transcripts that encode proteins involved in protein folding in the ER (Figure 2, Table 2, Supplementary Table 1). Chaperones facilitate protein re-folding and target misfolded proteins for degradation [24]. The protein folding machinery is dysregulated in MCPIP1 cells, which results in the accumulation of misfolded proteins. This may inhibit their proliferation [25]. We validated expression of HSPA5 and AGR2 transcripts, which are involved in protein folding and are downregulated in MCPIP1 cells (Table 2 and Supplementary Table 1).
HSPA5 is a member of the heat shock protein 70 (HSP70) family, which is induced during various stress conditions such as hypoxia to regulate protein folding and assembly in the ER [26]. QRT-PCR analysis showed that HSPA5 mRNA levels in MCPIP1 cells were reduced by 2.8-fold and 2.4-fold than in PURO and D141N cells, respectively (Figure 4A).
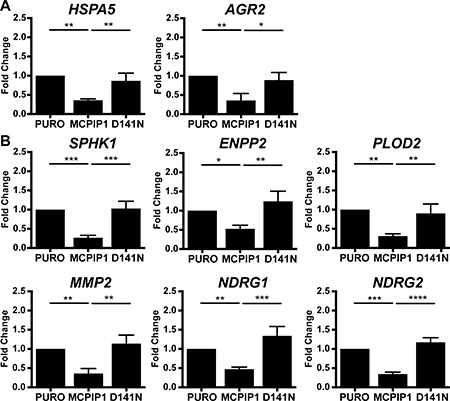
Figure 4: MCPIP1 decreases transcripts of protein folding and hypoxia response genes. (A) QRT-PCR analysis of HSPA5 and AGR2 mRNA levels in PURO, MCPIP1 and D141N cells induced with doxycycline for 24 h. (B) QRT-PCR analysis of SPHK1, ENPP2, PLOD2, MMP2, NDRG1 and NDRG2 mRNA levels in PURO, MCPIP1 and D141N cells induced with doxycycline for 24 h. Transcript levels are normalized to RPS13 mRNA levels as control. Graphs represent mean ± SD of three independent experiments. The p-values were estimated by one-way ANOVA followed by Tukey’s HSD test (* p < 0.05; **p < 0.01; ***p < 0.001; ****p < 0.0001).
Anterior gradient 2 (AGR2) is a member of the family of disulphide isomerases that regulate protein folding, maturation and secretion of proteins in the ER and is regulated by HIF-1α [27]. AGR2 mRNA levels in MCPIP1 cells were 2.8-fold and 2.5-fold lower than in PURO and D141N cells, respectively (Figure 4A). AGR2 specifically binds and stabilizes HIF-1α decreasing its proteasomal degradation [28]. Moreover, AGR2 overexpression is associated with survival, invasion and epithelial-mesenchymal transition of many cancers; for instance head and neck squamous cell carcinoma, pancreatic and breast cancers [29–31]. These data suggest that factors such as HSPA5 and AGR2 protect the cancer cells that reside in a hypoxic environment from ER-stress induced apoptosis.
It was shown that in hypoxic conditions in mouse beta cells downregulation of the protein folding machinery in the ER promotes cell death [32]. Here, we postulate that low MCPIP1 levels promotes growth and progression of ccRCC cells by upregulating factors such as HSPA5 and AGR2, which are involved in protein folding and secretion in the ER.
MCPIP1 downregulates hypoxia-response transcripts
We have already showed that MCPIP1 overexpression negatively regulates vascular endothelial growth factor (VEGF) [4], a well-known pro-angiogenic factor that is upregulated in many tumors [33–35]. In RNA-Seq we consistently found VEGF to be significantly downregulated (adj. p-value = 4.69E-04 as compared to PURO) in MCPIP1 overexpressing cells (Supplementary Table 1). Although the role of MCPIP1 in hypoxia and angiogenesis has been previously reported, the molecular mechanism is not fully elucidated.
As reported above, HSPA5 and AGR2 are two MCPIP1-regulated ER proteins that play an important role in hypoxia. Therefore, we validated a subset of hypoxia-related genes that are downregulated in MCPIP1 cells, but remained unchanged or upregulated in D141N cells (Table 2 and Supplementary Table 1).
Sphingosine Kinase 1 (SPHK1) is classified under the organonitrogen compound catabolic process, one of the top BP term for transcripts that are downregulated in MCPIP1 vs. PURO group (Figure 2 and Supplementary Table 2). SPHK1 catalyzes phosphorylation of sphingosine to sphingosine-1-phosphate (S1P), which promotes proliferation; meanwhile, sphingosine induces cell growth arrest and apoptosis (reviewed in [36, 37]). During hypoxia, SPHK1 regulates expression of HIF1α and HIF2α [38, 39]. SPHK1 overexpression promotes angiogenesis by inducing VEGFA and MMP2 expression in many tumors [40, 41]. SPHK1 transcript levels were reduced by 3.7-fold and 3.8-fold in MCPIP1 cells than in PURO and D141N cells, respectively (Figure 4B). Therefore, we postulate that low MCPIP1 expression in ccRCC cells increase S1P levels by enhancing SPHK1, which results in higher proliferation rates.
RNA-Seq data also showed that ENPP2 (Ectonucleotide Pyrophosphatase/ Phosphodiesterase family member 2) transcript levels were significantly downregulated in MCPIP1 cells (Supplementary Table 1 and Table 2). ENPP2 or autotaxin functions as a phosphodiesterase and phospholipase that generates lysophosphatidic acid (LPA), which stimulates cell proliferation and chemotaxis [42]. ENPP2 is upregulated in several carcinomas and promotes angiogenesis [42, 43]. Hypoxia stimulates expression of ENPP2 as well as production of LPA [44]. Moreover, LPA induces HIF1α expression in colon cancer cells at the transcriptional level [45]. ENPP2 transcript levels were reduced in MCPIP1 cells by 1.9-fold and 2.4-fold than in PURO and D141N cells, respectively (Figure 4B). Since VEGF-A and LPA is a are both proangiogenic factors, our findings suggest that MCPIP1 overexpression inhibits angiogenesis in Caki-1 cells by downregulating VEGFA and ENPP2.
We further showed that the transcript encoding PLOD2 (Procollagen-Lysine 2-Oxoglutarate 5-Dioxygenase 2) was downregulated in MCPIP1 cells by 3.2-fold and 2.9 than in PURO and D141N cells, respectively (Figure 4B). Similarly, transcript encoding MMP2 (matrix metalloproteinase) was also decreased by 2.8-fold and 3.2-fold in MCPIP1 cells than in PURO and D141N cells, respectively (Figure 4B). PLOD2 is an enzyme that catalyzes the hydroxylation of lysyl residues in collagen-like peptides and is involved in extracellular matrix remodeling and hypoxia-induced breast cancer metastasis [46]. PLOD2 expression is induced in hypoxia by HIF1α [46–48]. MMP2 is also activated by hypoxia and facilitates vascular invasion during angiogenesis [49–51]. MMP2 cleaves extracellular matrix proteins and is involved in signal transduction. Hypoxia-driven MMP2 activation promotes cancer progression and metastasis [52, 53]. Zhu et al. showed that high MMP-2 expression was associated with poor prognosis and rapid progression of RCC [54]. These results suggest that MCPIP1 modulates extracellular matrix remodeling in angiogenesis and various cancers by regulating expression of factors such as MMP2 and PLOD2.
N-Myc downstream-regulated gene 1 (NDRG1) and NDRG Family Member 2 (NDRG2) are two other hypoxia-related transcripts that are downregulated in MCPIP1 cells. NDRG1 transcript levels were decreased by 2.1-fold and 2.8-fold in MCPIP1 cells than in PURO and D141N cells, respectively (Figure 4B). NDRG1 is involved in stress and hormone responses as well as cell growth and differentiation. NDRG1 is necessary for p53-mediated caspase activation and apoptosis [55]. High NDRG1 expression has shown potential as a prognostic biomarker in many types of cancers [56, 57], including ccRCC [58]. Moreover, NDRG1 expression is differentially regulated during diverse physiological and pathological conditions such as hypoxia, cellular differentiation, heavy metal response and neoplasia [56, 59–61]. NDRG2 mRNA levels were reduced by 2.9-fold and 3.4-fold in MCPIP1 cells than in PURO and D141N, respectively (Figure 4B). NDRG2 suppresses renal cell carcinoma proliferation and invasion [62, 63]. NDRG2 regulation is complex and involves both N-Myc and MCPIP1 [64].
MCPIP1 negatively regulates transcripts encoding signaling mediators
Finally, we validated six transcripts that encode signaling pathway mediators, which were downregulated in MCPIP1 cells (Supplementary Table 1; Table 2 and Figure 5). These included the transcript encoding for neuronal guanine nucleotide exchange factor (NGEF) or Ephexin1. NGEF gene polymorphism is associated with obesity and adipose tissue content [65, 66]. Moreover, ccRCC is composed of cells whose cytoplasm is filled with lipid droplets [67, 68]. We previously reported the role of MCPIP1 in adipocyte differentiation [69] and that forced expression of MCPIP1 reduces differentiation potential of pre-adipocytes [70]. NGEF mRNA levels were reduced by 2.7-fold and 4.3-fold in MCPIP1 cells than in PURO and D141N cells, respectively (Figure 5). We postulate that changes in NGEF mRNA levels may impact lipid storage in Caki-1 cells.
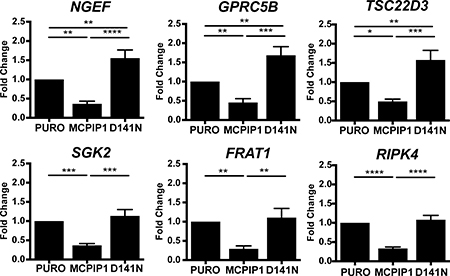
Figure 5: MCPIP1 decreases transcripts of signaling mediators. QRT-PCR analysis of NGEF, GPRC5B, TSC22D3, SGK2, FRAT1 and RIPK4 mRNA levels relative to RPS13 in PURO, MCPIP1 and D141N cells induced with doxycycline for 24 h Graphs represent mean ± SD of three independent experiments. The p-values were estimated by one-way ANOVA followed by Tukey’s HSD test ((* p <0.05; **p <0.01; ***p <0.001; ****p <0.0001).
G-protein coupled receptor family C group 5 member B (GPRC5B) is a putative glutamate G-protein coupled receptor [71–75], which is associated with obesity by promoting adipose inflammation [76–78]. We observed that the GPRC5B mRNA levels in MCPIP1 were reduced by 2.2-fold and 3.7-fold than in PURO and D141N cells, respectively (Figure 5).
TSC22D3 (TSC22 Domain Family Member 3) transcript encodes the glucocorticoid-induced leucine zipper (GILZ) protein, which inhibits adipogenesis by downregulating PPARγ and CEBPα [79]. Moreover, GILZ protein is an important mediator of anti-inflammatory effects in gastric cancer [80–85]. GILZ binds to NF-κB and inhibits its nuclear translocation [86–88]. It mediates anti-inflammatory effects by directly interacting with AP-1 [89] and/or inhibiting upstream signaling pathways by binding to Ras and Raf-1 kinase [90, 91]. Similar to the other hypoxia-related transcripts that are downregulated in MCPIP1 cells, GILZ is induced by hypoxia [92]. Moreover, GILZ is involved in the epithelial Na+ transport by cooperating with SGK2 (Serine/Threonine Kinase 2), which regulates the expression of sodium-coupled transporters that mediate transmembrane transport of important metabolites [93–100]. Figure 5 shows that TSC2DD3 transcript levels were reduced by 2-fold and 3.2-fold in the MCPIP1 cells relative to PURO and D141N cells, respectively (Figure 5). The levels of SGK2 mRNA were 2.7-fold and 3.1-fold lower in MCPIP1 cells than in PURO and D141N cells (Figure 5)
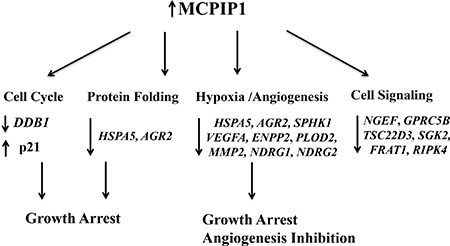
Figure 6: Schematic diagram shows transcriptome regulation by MCPIP1 in Caki-1 cells. Detailed description is included in the Results and Discussion section.
We also observed a 3.4-fold and 3.8-fold reduction in FRAT1 (Frequently Rearranged in Advanced T-cell lymphomas 1) and 3-fold and 3.3 fold RIPK4 (Receptor Interacting Serine/Threonine Kinase 4) mRNA levels in the MCPIP1 cells relative to PURO and D141N cells (Figure 5). FRAT1 and RIPK4 modulate the Wnt signaling pathway, which is a crucial player in initiation and development of many cancers [101]. FRAT1 is a member of the GSK-3 (Glycogen Synthase Kinase 3) binding protein family, which selectively inhibits GSK3-mediated phosphorylation that is critical for stabilization and accumulation of β-catenin in cancer cells [102–106]. FRAT1 overexpression leads to aberrant activation β-catenin in many types of cancers [107–114]. Similarly, RIPK4 serine/threonine protein kinase overexpression has been reported in many cancers [115] and is attributed to aberrant activation of Wnt signaling [116]. Therefore, we postulate that MCPIP overexpression promotes growth inhibition and apoptosis in Caki-1 cells by downregulating FRAT1 and RIPK4, thereby decreasing Wnt signaling.
In conclusion, we identified 219 transcripts that are downregulated in MCPIP1 cells, but are unchanged or upregulated in D141N cells that overexpress MCPIP1 that lacks the functional PIN domain. We further validated 15 selected transcripts by qRT-PCR. As shown in Figure 6, MCPIP1 overexpression leads to large scale changes in transcript levels, especially those involved in protein folding, cell cycle progression, hypoxia response, angiogenesis and cell signaling.
MATERIALS AND METHODS
Cell culture
The human ccRCC cell line, Caki-1, was cultured in Eagle minimal essential medium (EMEM; Lonza) containing 10% fetal bovine serum (FBS; BioWest) at 37ºC and 5% CO2. Cells were passaged at 80–90% confluence, thrice a week.
Transfection of Caki-1 with lentiviral constructs
We used the doxycycline-dependent TetON overexpression system for stable expression of wild type MCPIP1 and mutant form of MCPIP1 with inactivated PIN domain (D141N) (pLIX MCPIP1, pLIX D141N). Lentiviruses with the empty lentiviral vector (pLIX PURO) were transduced into Caki-1 cells to generate the negative control cells. Caki-1 cells were transduced with the lentiviruses carrying the different expression constructs at an MOI of 50 when they were 50–70% confluent. After 24 h, the virus containing media was replaced with fresh media for 24 h followed by selection in media containing 2 μg/ml puromycin (InvivoGen) for 10 days to select stably transduced cells.
BrdU cell proliferation assay
Cell proliferation was measured with the BrdU Cell Proliferation Assay Kit (Roche). We seeded 5 × 10³ MCPIP1, D141N and PURO cells in 96-well plates and stimulated them with 1 μg/ml doxycycline (BioShop) for 24 h. Then, the cells were incubated with 10 μM BrdU for 8 h and the incorporated BrdU was quantified according to the manufacturer’s instructions by measuring the chemiluminescence with the Tecan Spectra Fluor Plus Microplate Reader (Tecan Group Ltd.). The experiment was performed four times and the data was presented as the mean luminescence value (percentage) for each sample relative to the PURO cells. Mean luminescence of the PURO cells was set as 100%.
MTT cell viability assay
Cell viability was measured with the colorimetric MTT assay (Sigma). We seeded MCPIP1, D141N and PURO cells (5 × 10³ per well) in 96-well plates and stimulated them with doxycycline (DOX) for 24 h. Then, MTT assay was performed at 24, 48 and 72 h and measured the absorbance at 570 nm relative to 690 nm in a Tecan Spectra Fluor Plus Microplate Reader (Tecan Group Ltd.). The experiment was performed four times with quintuplicate samples in each experiment. Data was expressed as the mean absorbance of each sample relative to PURO cells.
Statistical analysis
All statistical analyses were performed using GraphPad Prism (ver. 6.0). Statistical data is expressed as mean ± SD from at least three independent replicate experiments. Analysis of multiple datasets was performed by a one-way ANOVA analysis followed by Tukey’s HSD (honest significant difference) test. The significant p-values were marked as follows: * denotes p < 0.05; ** denotes p < 0.01; *** denotes p < 0.001; **** denotes p < 0.0001.
RNA isolation
Total RNA was isolated from stably transfected Caki-1 cells stimulated with doxycycline for 24 h with the guanidium isothiocyanate (GTC) method. Total RNA preparation was checked by 1% denaturing formaldehyde agarose gel electrophoresis for ribosomal RNA and DNA contamination. Total RNA concentration and its purity were assessed by determining the A260/280 and A260/230 ratios, respectively (NanoDrop).
Generation of the transcriptome library and RNA sequencing
RNA integrity was assessed with the Agilent RNA 6000 Nano Kit on 2100 Bioanalyzer (Agilent) followed by library preparation with the Ion AmpliSeq Transcriptome Human Gene Expression Panel (Thermo) according to the manufacturer’s protocol [117]. Briefly, equal amounts of total RNA from all samples were reverse transcribed and the cDNAs were subjected to multiplex PCR to amplify parts of the target transcripts. The resultant amplicons were partially digested AND ligated with adapters. Ligation products were then purified with AMPure® XP beads (Beckman). The library was quantified in the Bioanalyzer 2100 and the concentration was adjusted to ~100 pM prior for template preparation. Then, eight barcoded library templates were clonally amplified on Ion Sphere particles (ISPs) with the Ion PI IC 200 Kit (Thermo) on the Ion Chef Instrument (Thermo Fisher Scientific, USA), loaded onto Ion PI chips and sequenced on an Ion Proton sequencer (Thermo) with the Ion PI IC 200 Kit, according to the manufacturer’s instructions.
Analysis of RNA-sequence reads
The raw reads were processed by the Torrent Suite analysis pipeline and mapped to the human genome assembly hg19 AmpliSeqTranscriptome version by TMAP. The reads corresponding to each gene were counted with htseq-count [118]. The data was normalized and the differential expression of various genes was determined by DESeq2 using default parameters [119]. Overrepresentation of gene ontology (GO) terms was determined by the R/BioConductor package clusterProfiler with the hypergeometric test [120]. GO visualization was performed with the GOplot R package [121]. KEGG visualization was performed with the Pathview package [122]. The RNA-Seq data (Accession number: PRJEB20908) was deposited as BAM files in the European Nucleotide Archive (https://www.ebi.ac.uk/ena).
Quantitative real-time PCR
We validated the selected transcripts by qRT-PCR. Total RNA was isolated from PURO, MCPIP1 and D141N cells from three independent experiments with the guanidium isothiocyanate (GTC) method as described.. Subsequently, 1 μg of total RNA was reverse-transcribed with oligo (dT15) primers (Promega) and M-MLV reverse transcriptase (Promega). The cDNA was diluted 5-times and real-time PCR was carried out using Eco Real-Time PCR System (Illumina) with the SYBR Green master mix (A&A Biotechnology) and primers that are listed in Supplementary Table 5. The relative levels of the transcripts were determined relative to RPS13 (ribosomal protein S13) by ΔΔCT method.
Western Blot
Total protein lysates were prepared from MCPIP1, D141N and PURO cells and quantified with the bicinchoninic acid assay. Equal amounts of protein samples were resolved by SDS/PAGE on 10% Bis-Tris acrylamide gels at a constant voltage of 120V. The resolved proteins were then transferred to a PVDF membrane (Millipore) for 90 minutes at a constant voltage of 90 V. Then, the membranes were blocked with 5% non-fat milk in Tris-buffered saline containing 0.1% Tween-20 (TBST; BioShop) for 1 h at room temperature. Membranes were incubated with primary antibodies against MCPIP1 (1:2000; GeneTex 1:2000), p21 Waf1/Cip1 (12D1; 1:1000; Cell Signaling Technology) and β-actin (1:3000; Sigma), overnight at 40C. Then, the membranes were incubated with HRP-conjugated secondary antibodies (anti-rabbit IgG or anti-mouse IgG, Sigma 1:30000). For signal detection, Immobilon Western HRP substrate (Millipore) was used and the chemiluminescence was determined in a ChemiDoc system (BioRad).
Author contributions
ALC, RP, JL, AK and DDD performed experiments and acquired data; MK, AP, JO and MM performed and interpreted the RNA-Seq experiments; DDD, MW, MM and KM interpreted the data interpretation; JJ designed the experiments and drafted the manuscript; ALC and MM edited the manuscript. All the authors approved the final content for journal submission and publication. Current address of JL is as follow: Division of Biochemistry, Faculty of Medicine and Health Sciences, Andrzej Frycz Modrzewski Krakow University, Krakow, Poland.
CONFLICTS OF INTEREST
The authors declare that there are no conflicts of interest.
FUNDING
This research was supported by the grants from the National Science Center (Grant Nos. 2011/03/B/NZ1/00023 and 2015/17/B/NZ3/01051 to J. Jura). The Faculty of Biochemistry, Biophysics and Biotechnology of the Jagiellonian University is a partner of the Leading National Research Center (KNOW) supported by the Ministry of Science and Higher Education.
REFERENCES
1. Zbar B, Brauch H, Talmadge C, Linehan M. Loss of alleles of loci on the short arm of chromosome 3 in renal cell carcinoma. Nature. 1987; 327:721–4. https://doi.org/10.1038/327721a0.
2. Maxwell PH, Wiesener MS, Chang GW, Clifford SC, Vaux EC, Cockman ME, Wykoff CC, Pugh CW, Maher ER, Ratcliffe PJ. The tumour suppressor protein VHL targets hypoxia-inducible factors for oxygen-dependent proteolysis. Nature. 1999; 399:271–5. https://doi.org/10.1038/20459.
3. Semenza GL. Hypoxia-inducible factors in physiology and medicine. Cell. 2012; 148:399–408. https://doi.org/10.1016/j.cell.2012.01.021.
4. Ligeza J, Marona P, Gach N, Lipert B, Miekus K, Wilk W, Jaszczynski J, Stelmach A, Loboda A, Dulak J, Branicki W, Rys J, Jura J. MCPIP1 contributes to clear cell renal cell carcinomas development. Angiogenesis. 2017; 20:325–340. https://doi.org/10.1007/s10456-017-9540-2.
5. Matsushita K, Takeuchi O, Standley DM, Kumagai Y, Kawagoe T, Miyake T, Satoh T, Kato H, Tsujimura T, Nakamura H, Akira S. Zc3h12a is an RNase essential for controlling immune responses by regulating mRNA decay. Nature. 2009; 458:1185–90. https://doi.org/10.1038/nature07924.
6. Suzuki HI, Arase M, Matsuyama H, Choi YL, Ueno T, Mano H, Sugimoto K, Miyazono K. MCPIP1 ribonuclease antagonizes dicer and terminates microRNA biogenesis through precursor microRNA degradation. Mol Cell. 2011; 44:424–36. https://doi.org/10.1016/j.molcel.2011.09.012.
7. Jura J, Skalniak L, Koj A. Monocyte chemotactic protein-1-induced protein-1 (MCPIP1) is a novel multifunctional modulator of inflammatory reactions. Biochim Biophys Acta. 2012; 1823:1905–13. https://doi.org/10.1016/j.bbamcr.2012.06.029.
8. Mizgalska D, Wegrzyn P, Murzyn K, Kasza A, Koj A, Jura J, Jarzab B, Jura J. Interleukin-1-inducible MCPIP protein has structural and functional properties of RNase and participates in degradation of IL-1β mRNA. FEBS J. 2009; 276:7386–99. https://doi.org/10.1111/j.1742-4658.2009.07452.x.
9. Liang J, Wang J, Saad Y, Warble L, Becerra E, Kolattukudy PE. Participation of MCP-induced protein 1 in lipopolysaccharide preconditioning-induced ischemic stroke tolerance by regulating the expression of proinflammatory cytokines. J Neuroinflammation. 2011; 8:182. https://doi.org/10.1186/1742-2094-8-182.
10. Liang J, Saad Y, Lei T, Wang J, Qi D, Yang Q, Kolattukudy PE, Fu M. MCP-induced protein 1 deubiquitinates TRAF proteins and negatively regulates JNK and NF-κB signaling. J Exp Med. 2010; 207:2959–73. https://doi.org/10.1084/jem.20092641.
11. Skalniak L, Mizgalska D, Zarebski A, Wyrzykowska P, Koj A, Jura J. Regulatory feedback loop between NF-kB and MCP-1-induced protein 1 RNase. FEBS J. 2009; 276:5892–905. https://doi.org/10.1111/j.1742-4658.2009.07273.x.
12. Boratyn E, Nowak I, Horwacik I, Durbas M, Mistarz A, Kukla M, Kaczõwka P, Łastowska M, Jura J, Rokita H. Monocyte Chemoattractant Protein-Induced Protein 1 Overexpression Modulates Transcriptome, Including MicroRNA, in Human Neuroblastoma Cells. J Cell Biochem. 2016; 117:694–707. https://doi.org/10.1002/jcb.25354.
13. Lu W, Ning H, Gu L, Peng H, Wang Q, Hou R, Fu M, Hoft DF, Liu J. MCPIP1 Selectively Destabilizes Transcripts Associated with an Antiapoptotic Gene Expression Program in Breast Cancer Cells That Can Elicit Complete Tumor Regression. Cancer Res. 2016; 76:1429–40. https://doi.org/10.1158/0008-5472.CAN-15-1115.
14. Marona P, Gorka J, Mazurek Z, Wilk W, Rys J, Majka M, Jura J, Miekus K. MCPIP1 downregulation in clear cell renal cell carcinoma promotes vascularization and metastatic progression. Cancer Res. 2017; 77:4905–20. https://doi.org/10.1158/0008-5472.CAN-16-3190.
15. Sherr CJ, Roberts JM. CDK inhibitors: positive and negative regulators of G1-phase progression. Genes Dev. 1999; 13:1501–12.
16. Nishitani H, Shiomi Y, Iida H, Michishita M, Takami T, Tsurimoto T. CDK inhibitor p21 is degraded by a proliferating cell nuclear antigen-coupled Cul4-DDB1Cdt2 pathway during S phase and after UV irradiation. J Biol Chem. 2008; 283:29045–52. https://doi.org/10.1074/jbc.M806045200.
17. Cang Y, Zhang J, Nicholas SA, Bastien J, Li B, Zhou P, Goff SP. Deletion of DDB1 in Mouse Brain and Lens Leads to p53-Dependent Elimination of Proliferating Cells. Cell. 2006; 127:929–40. https://doi.org/10.1016/j.cell.2006.09.045.
18. Hu Z, Holzschuh J, Driever W. Loss of DDB1 leads to transcriptional p53 pathway activation in proliferating cells, cell cycle deregulation, and apoptosis in zebrafish embryos. PLoS One. 2015; 10:e0134299. https://doi.org/10.1371/journal.pone.0134299.
19. Jin J, Arias EE, Chen J, Harper JW, Walter JC. A family of diverse Cul4-Ddb1-interacting proteins includes Cdt2, which is required for S phase destruction of the replication factor Cdt1. Mol Cell. 2006; 23:709–21. https://doi.org/10.1016/j.molcel.2006.08.010.
20. Hu J, McCall C, Ohta T, Xiong Y. Targeted ubiquitination of CDT1 by the DDB1-CUL4A-ROC1 ligase in response to DNA damage. Nat Cell Biol. 2004; 6:1003–9. https://doi.org/10.1038/ncb1172.
21. Blow JJ, Dutta A. Preventing re-replication of chromosomal DNA. Nat Rev Mol Cell Biol. 2005; 6:476–86. https://doi.org/10.1038/nrm1663.
22. Vaziri C, Saxena S, Jeon Y, Lee C, Murata K, Machida Y, Wagle N, Hwang DS, Dutta A. A p53-Dependent Checkpoint Pathway Prevents Rereplication. Mol Cell. 2003; 11:997–1008. https://doi.org/10.1016/S1097-2765(03)00099-6.
23. Machida YJ, Dutta A. Cellular Checkpoint Mechanisms Monitoring Proper Initiation of DNA Replication. J Biol Chem. 2005; 280:6253–6. https://doi.org/10.1074/jbc.R400037200.
24. Tyedmers J, Mogk A, Bukau B. Cellular strategies for controlling protein aggregation. Nat Rev Mol Cell Biol. 2010; 11:777–88. https://doi.org/10.1038/nrm2993.
25. Arslan MA, Chikina M, Csermely P, Soti C. Misfolded proteins inhibit proliferation and promote stress-induced death in SV40-transformed mammalian cells. FASEB J. 2012; 26:766–77. https://doi.org/10.1096/fj.11-186197.
26. Zhang XY, Zhang TT, Song DD, Zhou JH, Han R, Qin ZH, Sheng R. Endoplasmic reticulum chaperone GRP78 is involved in autophagy activation induced by ischemic preconditioning in neural cells. Mol Brain. 2015; 8:20. https://doi.org/10.1186/s13041-015-0112-3.
27. Hong XY, Wang J, Li Z. AGR2 Expression is Regulated by HIF-1 and Contributes to Growth and Angiogenesis of Glioblastoma. Cell Biochem Biophys. 2013; 67:1487–95. https://doi.org/10.1007/s12013-013-9650-4.
28. Li Z, Zhu Q, Hu L, Chen H, Wu Z, Li D. Anterior gradient 2 is a binding stabilizer of hypoxia inducible factor-1α that enhances CoCl2 -induced doxorubicin resistance in breast cancer cells. Cancer Sci. 2015; 106:1041-49. http://dx.doi.org/10.1111/cas.12714.
29. Ramachandran V, Arumugam T, Wang H, Logsdon CD. Anterior gradient 2 is expressed and secreted during the development of pancreatic cancer and promotes cancer cell survival. Cancer Res. 2008; 68:7811–8. https://doi.org/10.1158/0008-5472.CAN-08-1320.
30. Ma SR, Wang WM, Huang CF, Zhang WF, Sun ZJ. Anterior gradient protein 2 expression in high grade head and neck squamous cell carcinoma correlated with cancer stem cell and epithelial mesenchymal transition. Oncotarget. 2015; 6:8807–21. https://doi.org/10.18632/oncotarget.3556.
31. Vanderlaag KE, Hudak S, Bald L, Fayadat-Dilman L, Sathe M, Grein J, Janatpour MJ. Anterior gradient-2 plays a critical role in breast cancer cell growth and survival by modulating cyclin D1, estrogen receptor-alpha and survivin. Breast Cancer Res. 2010; 12:R32. https://doi.org/10.1186/bcr2586.
32. Bensellam M, Maxwell EL, Chan JY, Luzuriaga J, West PK, Jonas JC, Gunton JE, Laybutt DR. Hypoxia reduces ER-to-Golgi protein trafficking and increases cell death by inhibiting the adaptive unfolded protein response in mouse beta cells. Diabetologia. 2016; 59:1492–502. https://doi.org/10.1007/s00125-016-3947-y.
33. Hicklin DJ, Ellis LM. Role of the vascular endothelial growth factor pathway in tumor growth and angiogenesis. J Clin Oncol. 2005; 23:1011–27. https://doi.org/10.1200/JCO.2005.06.081.
34. Carmeliet P. VEGF as a key mediator of angiogenesis in cancer. Oncology. 2005; 69:4–10. https://doi.org/10.1159/000088478.
35. Labedz-Maslowska A, Lipert B, Berdecka D, Kedracka-Krok S, Jankowska U, Kamycka E, Sekula M, Madeja Z, Dawn B, Jura J, Zuba-Surma EK. Monocyte Chemoattractant Protein-Induced Protein 1 (MCPIP1) Enhances Angiogenic and Cardiomyogenic Potential of Murine Bone Marrow-Derived Mesenchymal Stem Cells. Qin G, editor. PLoS One. 2015; 10:e0133746. https://doi.org/10.1371/journal.pone.0133746.
36. Spiegel S, Milstien S. Sphingosine-1-phosphate: An enigmatic signalling lipid. Nat Rev Mol Cell Biol. 2003; 4:397–407. https://doi.org/10.1038/nrm1103.
37. Strub GM, Maceyka M, Hait NC, Milstien S, Spiegel S. Extracellular and intracellular actions of sphingosine-1-phosphate. Adv Exp Med Biol. 2010; 688:141–55. https://doi.org/10.1007/978-1-4419-6741-1_10.
38. Ader I, Brizuela L, Bouquerel P, Malavaud B, Cuvillier O. Sphingosine kinase 1: a new modulator of hypoxia inducible factor 1alpha during hypoxia in human cancer cells. Cancer Res. 2008; 68:8635–42. https://doi.org/10.1158/0008-5472.CAN-08-0917.
39. Bouquerel P, Gstalder C, Müller D, Laurent J, Brizuela L, Sabbadini RA, Malavaud B, Pyronnet S, Martineau Y, Ader I, Cuvillier O. Essential role for SphK1/S1P signaling to regulate hypoxia-inducible factor 2α expression and activity in cancer. Oncogenesis. 2016; 5:e209. https://doi.org/10.1038/oncsis.2016.13.
40. Zhang Y, Wang Y, Wan Z, Liu S, Cao Y, Zeng Z. Sphingosine kinase 1 and cancer: A systematic review and meta-analysis. PLoS One. 2014; 9:e90362. https://doi.org/10.1371/journal.pone.0090362.
41. Sun HY, Wei SP, Xu RC, Xu PX, Zhang WC. Sphingosine-1-phosphate induces human endothelial VEGF and MMP-2 production via transcription factor ZNF580: Novel insights into angiogenesis. Biochem Biophys Res Commun. 2010; 395:361–6. https://doi.org/10.1016/j.bbrc.2010.04.019.
42. van Meeteren LA, Moolenaar WH. Regulation and biological activities of the autotaxin-LPA axis. Prog Lipid Res. 2007; 46:145–60. https://doi.org/10.1016/j.plipres.2007.02.001.
43. Ptaszynska MM, Pendrak ML, Stracke ML, Roberts DD. Autotaxin signaling via lysophosphatidic acid receptors contributes to vascular endothelial growth factor-induced endothelial cell migration. Mol Cancer Res. 2010; 8:309–21. https://doi.org/10.1158/1541-7786.MCR-09-0288.
44. Cheng HY, Dong A, Panchatcharam M, Mueller P, Yang F, Li Z, Mills G, Chun J, Morris AJ, Smyth SS. Lysophosphatidic acid signaling protects pulmonary vasculature from hypoxia-induced remodeling. Arterioscler Thromb Vasc Biol. 2012; 32:24–32. https://doi.org/10.1161/ATVBAHA.111.234708.
45. Lee SJ, No YR, Dang DT, Dang LH, Yang VW, Shim H, Yun CC. Regulation of hypoxia-inducible factor 1α (HIF-1α) by lysophosphatidic acid is dependent on interplay between p53 and Krüppel-like factor 5. J Biol Chem. 2013; 288:25244–53. https://doi.org/10.1074/jbc.M113.489708.
46. Gilkes DM, Bajpai S, Wong CC, Chaturvedi P, Hubbi ME, Wirtz D, Semenza GL. Procollagen Lysyl Hydroxylase 2 Is Essential for Hypoxia-Induced Breast Cancer Metastasis. Mol Cancer Res. 2013; 11:456–66. https://doi.org/10.1158/1541-7786.MCR-12-0629.
47. Gilkes DM, Bajpai S, Chaturvedi P, Wirtz D, Semenza GL. Hypoxia-inducible f0actor 1 (HIF-1) promotes extracellular matrix remodeling under hypoxic conditions by inducing P4HA1, P4HA2, and PLOD2 expression in fibroblasts. J Biol Chem. 2013; 288:10819–29. https://doi.org/10.1074/jbc.M112.442939.
48. Noda T, Yamamoto H, Takemasa I, Yamada D, Uemura M, Wada H, Kobayashi S, Marubashi S, Eguchi H, Tanemura M, Umeshita K, Doki Y, Mori M, et al. PLOD2 induced under hypoxia is a novel prognostic factor for hepatocellular carcinoma after curative resection. Liver Int. 2012; 32:110–8. https://doi.org/10.1111/j.1478-3231.2011.02619.x.
49. Silletti S, Kessler T, Goldberg J, Boger DL, Cheresh DA. Disruption of matrix metalloproteinase 2 binding to integrin alpha vbeta 3 by an organic molecule inhibits angiogenesis and tumor growth in vivo. Proc Natl Acad Sci U S A. 2001; 98:119–24. https://doi.org/10.1073/pnas.011343298.
50. Chen PS, Zhai WR, Zhou XM, Zhang JS, Zhang YE, Ling YQ, Gu YH. Effects of hypoxia, hyperoxia on the regulation of expression and activity of matrix metalloproteinase-2 in hepatic stellate cells. World J Gastroenterol. 2001; 7:647–51. https://doi.org/10.3748/wjg.v7.i5.647.
51. Ridgway PF, Ziprin P, Alkhamesi N, Paraskeva PA, Peck DH, Darzi AW. Hypoxia augments gelatinase activity in a variety of adenocarcinomas in vitro. J Surg Res. 2005; 124:180–6. https://doi.org/10.1016/j.jss.2004.10.020.
52. Muñoz-Nájar UM, Neurath KM, Vumbaca F, Claffey KP. Hypoxia stimulates breast carcinoma cell invasion through MT1-MMP and MMP-2 activation. Oncogene. 2006; 25:2379–92. https://doi.org/10.1038/sj.onc.1209273.
53. Lüke J, Vukoja V, Brandenbusch T, Nassar K, Rohrbach JM, Grisanti S, Lüke M, Tura A. CD147 and matrix-metalloproteinase-2 expression in metastatic and non-metastatic uveal melanomas. BMC Ophthalmol. 2016; 16:74. https://doi.org/10.1186/s12886-016-0222-4.
54. Liu Q, Zhang GW, Zhu CY, Wei JX, Tian X, Li Y, Li XD. Clinicopathological significance of matrix metalloproteinase 2 protein expression in patients with renal cell carcinoma: A case-control study and meta-analysis. Cancer Biomark. 2016; 16:281-9 . https://doi.org/10.3233/CBM-150566.
55. Stein S, Thomas EK, Herzog B, Westfall MD, Rocheleau JV, Jackson RS 2nd, Wang M, Liang P. NDRG1 is necessary for p53-dependent apoptosis. J Biol Chem. 2004; 279:48930–40. https://doi.org/10.1074/jbc.M400386200.
56. Cangul H, Salnikow K, Yee H, Zagzag D, Commes T, Costa M. Enhanced overexpression of an HIF-1/hypoxia-related protein in cancer cells. Environ Health Perspect. 2002; 110:783–8.
57. Wang Z, Wang F, Wang WQ, Gao Q, Wei WL, Yang Y, Wang GY. Correlation of N-myc downstream-regulated gene 1 overexpression with progressive growth of colorectal neoplasm. World J Gastroenterol. 2004; 10:550–4. https://doi.org/10.3748/wjg.v10.i4.550.
58. Hosoya N, Sakumoto M, Nakamura Y, Narisawa T, Bilim V, Motoyama T, Tomita Y, Kondo T. Proteomics identified nuclear N-myc downstream-regulated gene 1 as a prognostic tissue biomarker candidate in renal cell carcinoma. Biochim Biophys Acta. 2013; 1834:2630–9. https://doi.org/10.1016/j.bbapap.2013.08.009.
59. Lachat P, Shaw P, Gebhard S, Van Belzen N, Chaubert P, Bosman FT. Expression of NDRG1, a differentiation-related gene, in human tissues. Histochem Cell Biol. 2002; 118:399–408. https://doi.org/10.1007/s00418-002-0460-9.
60. Sibold S, Roh V, Keogh A, Studer P, Tiffon C, Angst E, Vorburger SA, Weimann R, Candinas D, Stroka D. Hypoxia increases cytoplasmic expression of NDRG1, but is insufficient for its membrane localization in human hepatocellular carcinoma. FEBS Lett. 2007; 581:989–94. https://doi.org/10.1016/j.febslet.2007.01.080.
61. Said HM, Stein S, Hagemann C, Polat B, Staab A, Anacker J, Schoemig B, Theobald M, Flentje M, Vordermark D. Oxygen-dependent regulation of NDRG1 in human glioblastoma cells in vitro and in vivo. Oncol Rep. 2009; 21:237–46. doi.org/10.3892/or_00000214.
62. Ma JJ, Liao CG, Jiang X, Zhao HD, Yao LB, Bao TY. NDRG2 suppresses the proliferation of clear cell renal cell carcinoma cell A-498. J Exp Clin Cancer Res. 2010; 29:103. https://doi.org/10.1186/1756-9966-29-103.
63. Ma JJ, Kong LM, Liao CG, Jiang X, Wang Y, Bao TY. Suppression of MMP-9 activity by NDRG2 expression inhibits clear cell renal cell carcinoma invasion. Med Oncol. 2012; 29:3306–13. https://doi.org/10.1007/s12032-012-0265-1.
64. Boratyn E, Nowak I, Durbas M, Horwacik I, Sawicka A, Rokita H. MCPIP1 Exogenous Overexpression Inhibits Pathways Regulating MYCN Oncoprotein Stability in Neuroblastoma. J Cell Biochem. 2017; 118:1741–55. https://doi.org/10.1002/jcb.25832.
65. Norris JM, Langefeld CD, Talbert ME, Wing MR, Haritunians T, Fingerlin TE, Hanley AJ, Ziegler JT, Taylor KD, Haffner SM, Chen YD, Bowden DW, Wagenknecht LE. Genome-wide association study and follow-up analysis of adiposity traits in Hispanic Americans: the IRAS Family Study. Obesity (Silver Spring). 2009; 17:1932–41. https://doi.org/10.1038/oby.2009.143.
66. Kim HJ, Park JH, Lee S, Son HY, Hwang J, Chae J, Yun JM, Kwon H, Kim JI, Cho B. A Common Variant of NGEF Is Associated with Abdominal Visceral Fat in Korean Men. PLoS One. 2015; 10:e0137564. https://doi.org/10.1371/journal.pone.0137564.
67. Gebhard RL, Clayman RV, Prigge WF, Figenshau R, Staley NA, Reesey C, Bear A. Abnormal cholesterol metabolism in renal clear cell carcinoma. J Lipid Res. 1987; 28:1177–84.
68. Krishnan B, Truong LD. Renal epithelial neoplasms: The diagnostic implications of electron microscopic study in 55 cases. Hum Pathol. 2002; 33:68–79. https://doi.org/10.1053/hupa.2002.30210.
69. Lipert B, Wegrzyn P, Sell H, Eckel J, Winiarski M, Budzynski A, Matlok M, Kotlinowski J, Ramage L, Malecki M, Wilk W, Mitus J, Jura J. Monocyte chemoattractant protein-induced protein 1 impairs adipogenesis in 3T3-L1 cells. Biochim Biophys Acta. 2014; 1843:780–8. https://doi.org/10.1016/j.bbamcr.2014.01.001.
70. Losko M, Lichawska-Cieslar A, Kulecka M, Paziewska A, Rumienczyk I, Mikula M, Jura J. Ectopic overexpression of MCPIP1 impairs adipogenesis by modulating microRNAs. Biochim Biophys Acta. 2018; 1865:186–95. https://doi.org/10.1016/j.bbamcr.2017.09.010.
71. Robbins MJ, Michalovich D, Hill J, Calver AR, Medhurst AD, Gloger I, Sims M, Middlemiss DN, Pangalos MN. Molecular cloning and characterization of two novel retinoic acid-inducible orphan G-protein-coupled receptors (GPRC5B and GPRC5C). Genomics. 2000; 67:8–18. https://doi.org/10.1006/geno.2000.6226.
72. Sano T, Kim YJ, Oshima E, Shimizu C, Kiyonari H, Abe T, Higashi H, Yamada K, Hirabayashi Y. Comparative characterization of GPRC5B and GPRC5C LacZ knockin mice; behavioral abnormalities in GPRC5B-deficient mice. Biochem Biophys Res Commun. 2011; 412:460–5. https://doi.org/10.1016/j.bbrc.2011.07.118.
73. Kurabayashi N, Nguyen MD, Sanada K. The G protein-coupled receptor GPRC5B contributes to neurogenesis in the developing mouse neocortex. Development. 2013; 140:4335–46. https://doi.org/10.1242/dev.099754.
74. Tomita H, Ziegler ME, Kim HB, Evans SJ, Choudary PV, Li JZ, Meng F, Dai M, Myers RM, Neal CR, Speed TP, Barchas JD, Schatzberg AF, et al. G protein-linked signaling pathways in bipolar and major depressive disorders. Front Genet. 2013; 4. https://doi.org/10.3389/fgene.2013.00297.
75. Chung HJ, Kim JD, Kim KH, Jeong NY. G protein-coupled receptor, family C, group 5 (GPRC5B) downregulation in spinal cord neurons is involved in neuropathic pain. Korean J Anesthesiol. 2014; 66:230–6. https://doi.org/10.4097/kjae.2014.66.3.230.
76. Speliotes EK, Willer CJ, Berndt SI, Monda KL, Thorleifsson G, Jackson AU, Lango Allen H, Lindgren CM, Luan J, Mägi R, Randall JC, Vedantam S, Winkler TW, et al, and Procardis Consortium. Association analyses of 249,796 individuals reveal 18 new loci associated with body mass index. Nat Genet. 2010; 42:937–48. https://doi.org/10.1038/ng.686.
77. Kim YJ, Sano T, Nabetani T, Asano Y, Hirabayashi Y. GPRC5B activates obesity-associated inflammatory signaling in adipocytes. Sci Signal. 2012; 5:ra85. https://doi.org/10.1126/scisignal.2003149.
78. Albayrak Ö, Pütter C, Volckmar AL, Cichon S, Hoffmann P, Nöthen MM, Jöckel KH, Schreiber S, Wichmann HE, Faraone SV, Neale BM, Herpertz-Dahlmann B, Lehmkuhl G, et al, and Psychiatric GWAS Consortium: ADHD Subgroup. Common obesity risk alleles in childhood attention-deficit/hyperactivity disorder. Am J Med Genet B Neuropsychiatr Genet. 2013; 162B:295 013;305. https://doi.org/10.1002/ajmg.b.32144.
79. Shi X, Shi W, Li Q, Song B, Wan M, Bai S, Cao X. A glucocorticoid-induced leucine-zipper protein, GILZ, inhibits adipogenesis of mesenchymal cells. EMBO Rep. 2003; 4:374–80. https://doi.org/10.1038/sj.embor.embor805.
80. Eddleston J, Herschbach J, Wagelie-Steffen AL, Christiansen SC, Zuraw BL. The anti-inflammatory effect of glucocorticoids is mediated by glucocorticoid-induced leucine zipper in epithelial cells. J Allergy Clin Immunol. 2007; 119:115–22. https://doi.org/10.1016/j.jaci.2006.08.027.
81. Berrebi D, Bruscoli S, Cohen N, Foussat A, Migliorati G, Bouchet-Delbos L, Maillot MC, Portier A, Couderc J, Galanaud P, Peuchmaur M, Riccardi C, Emilie D. Synthesis of glucocorticoid-induced leucine zipper (GILZ) by macrophages: An anti-inflammatory and immunosuppressive mechanism shared by glucocorticoids and IL-10. Blood. 2003; 101:729–38. https://doi.org/10.1182/blood-2002-02-0538.
82. Beaulieu E, Ngo D, Santos L, Yang YH, Smith M, Jorgensen C, Escriou V, Scherman D, Courties G, Apparailly F, Morand EF. Glucocorticoid-induced leucine zipper is an endogenous antiinflammatory mediator in arthritis. Arthritis Rheum. 2010; 62:2651–61. https://doi.org/10.1002/art.27566.
83. Hahn RT, Hoppstadter J, Hirschfelder K, Hachenthal N, Diesel B, Kessler SM, Huwer H, Kiemer AK. Downregulation of the glucocorticoid-induced leucine zipper (GILZ) promotes vascular inflammation. Atherosclerosis. 2014; 234:391–400. https://doi.org/10.1016/j.atherosclerosis.2014.03.028.
84. Fan H, Kao W, Yang YH, Gu R, Harris J, Fingerle-Rowson G, Bucala R, Ngo D, Beaulieu E, Morand EF. Macrophage migration inhibitory factor inhibits the antiinflammatory effects of glucocorticoids via glucocorticoid-induced leucine zipper. Arthritis Rheumatol. 2014; 66:2059–70. https://doi.org/10.1002/art.38689.
85. Vago JP, Tavares LP, Garcia CC, Lima KM, Perucci LO, Vieira ÉL, Nogueira CRC, Soriani FM, Martins JO, Silva PMR, Gomes KB, Pinho V, Bruscoli S, et al. The role and effects of glucocorticoid-induced leucine zipper in the context of inflammation resolution. J Immunol. 2015; 194:4940–50. https://doi.org/10.4049/jimmunol.1401722.
86. Ayroldi E, Migliorati G, Bruscoli S, Marchetti C, Zollo O, Cannarile L, D’Adamio F, Riccardi C. Modulation of T-cell activation by the glucocorticoid-induced leucine zipper factor via inhibition of nuclear factor kappaB. Blood. 2001; 98:743–53. doi.org/10.1182/blood.V98.3.743.
87. Riccardi C, Bruscoli S, Ayroldi E, Agostini M, Migliorati G. GILZ, a glucocorticoid hormone induced gene, modulates T lymphocytes activation and death through interaction with NF-kB. Adv Exp Med Biol. 2001; 495:31–9. https://doi.org/10.1007/978-1-4615-0685-0_5.
88. Di Marco B, Massetti M, Bruscoli S, Macchiarulo A, Di Virgilio R, Velardi E, Donato V, Migliorati G, Riccardi C. Glucocorticoid-induced leucine zipper (GILZ)/NF-kappaB interaction: role of GILZ homo-dimerization and C-terminal domain. Nucleic Acids Res. 2007; 35:517–28. https://doi.org/10.1093/nar/gkl1080.
89. Mittelstadt PR, Ashwell JD. Inhibition of AP-1 by the Glucocorticoid-inducible Protein GILZ. J Biol Chem. 2001; 276:29603–10. https://doi.org/10.1074/jbc.M101522200.
90. Ayroldi E, Zollo O, Macchiarulo A, Di Marco B, Marchetti C, Riccardi C. Glucocorticoid-induced leucine zipper inhibits the Raf-extracellular signal-regulated kinase pathway by binding to Raf-1. Mol Cell Biol. 2002; 22:7929–41. https://doi.org/10.1128/MCB.22.22.7929-7941.2002.
91. Bruscoli S, Velardi E, Di Sante M, Bereshchenko O, Venanzi A, Coppo M, Berno V, Mameli MG, Colella R, Cavaliere A, Riccardi C. Long glucocorticoid-induced leucine zipper (L-GILZ) protein interacts with ras protein pathway and contributes to spermatogenesis control. J Biol Chem. 2012; 287:1242–51. https://doi.org/10.1074/jbc.M111.316372.
92. Wang Y, Ma YY, Song XL, Cai HY, Chen JC, Song LN, Yang R, Lu J. Upregulations of glucocorticoid-induced leucine zipper by hypoxia and glucocorticoid inhibit proinflammatory cytokines under hypoxic conditions in macrophages. J Immunol. 2012; 188:222–9. https://doi.org/10.4049/jimmunol.1002958.
93. Friedrich B, Feng Y, Cohen P, Risler T, Vandewalle A, Bröer S, Wang J, Pearce D, Lang F. The serine/threonine kinases SGK2 and SGK3 are potent stimulators of the epithelial Na+ channel alpha,beta,gamma-ENaC. Pflügers Arch Eur J Physiol. 2003; 445:693–6. https://doi.org/10.1007/s00424-002-0993-8.
94. Rexhepaj R, Grahammer F, Völkl H, Remy C, Wagner CA, Sandulache D, Artunc F, Henke G, Nammi S, Capasso G, Alessi DR, Lang F. Reduced intestinal and renal amino acid transport in PDK1 hypomorphic mice. FASEB J. 2006; 20:2214–22. https://doi.org/10.1096/fj.05-5676com.
95. Rexhepaj R, Artunc F, Metzger M, Skutella T, Lang F. PI3-Kinase-dependent electrogenic intestinal transport of glucose and amino acids. Pflügers Arch Eur J Physiol. 2007; 453:863–70. https://doi.org/10.1007/s00424-006-0154-6.
96. Wang H, Xu D, Toh MF, Pao AC, You G. Serum- and glucocorticoid-inducible kinase SGK2 regulates human organic anion transporters 4 via ubiquitin ligase Nedd4-2. Biochem Pharmacol. 2016; 102:120–9. https://doi.org/10.1016/j.bcp.2015.11.024.
97. Muller OG, Parnova RG, Centeno G, Rossier BC, Firsov D, Horisberger JD. Mineralocorticoid effects in the kidney: correlation between alphaENaC, GILZ, and Sgk-1 mRNA expression and urinary excretion of Na+ and K+. J Am Soc Nephrol. 2003; 14:1107–15. https://doi.org/10.1097/01.ASN.0000061777.67332.77.
98. Soundararajan R, Zhang TT, Wang J, Vandewalle A, Pearce D. A novel role for glucocorticoid-induced leucine zipper protein in epithelial sodium channel-mediated sodium transport. J Biol Chem. 2005; 280:39970–81. https://doi.org/10.1074/jbc.M508658200.
99. Bhalla V, Soundararajan R, Pao AC, Li H, Pearce D. Disinhibitory pathways for control of sodium transport: regulation of ENaC by SGK1 and GILZ. Am J Physiol Renal Physiol. 2006; 291:F714-21. https://doi.org/10.1152/ajprenal.00061.2006.
100. Soundararajan R, Wang J, Melters D, Pearce D. Glucocorticoid-induced Leucine zipper 1 stimulates the epithelial sodium channel by regulating serum- and glucocorticoid-induced kinase 1 stability and subcellular localization. J Biol Chem. 2010; 285:39905–13. https://doi.org/10.1074/jbc.M110.161133.
101. Polakis P. Wnt signaling in cancer. Cold Spring Harb Perspect Biol. 2012; 4:9. https://doi.org/10.1101/cshperspect.a008052.
102. Culbert AA, Brown MJ, Frame S, Hagen T, Cross DAE, Bax B, Reith AD. GSK-3 inhibition by adenoviral FRAT1 overexpression is neuroprotective and induces Tau dephosphorylation and β-catenin stabilisation without elevation of glycogen synthase activity. FEBS Lett. 2001; 507:288–94. https://doi.org/10.1016/S0014-5793(01)02990-8.
103. Thomas GM, Frame S, Goedert M, Nathke I, Polakis P, Cohen P. A GSK3-binding peptide from FRAT1 selectively inhibits the GSK3-catalysed phosphorylation of axin and beta-catenin. FEBS Lett. 1999; 458:247–51. https://doi.org/10.1016/S0014-5793(99)01161-8.
104. Fraser E, Young N, Dajani R, Franca-Koh J, Ryves J, Williams RSB, Yeo M, Webster MT, Richardson C, Smalley MJ, Pearl LH, Harwood A, Dale TC. Identification of the Axin and Frat binding region of glycogen synthase kinase-3. J Biol Chem. 2002; 277:2176–85. https://doi.org/10.1074/jbc.M109462200.
105. Bax B, Carter PS, Lewis C, Guy AR, Bridges A, Tanner R, Pettman G, Mannix C, Culbert AA, Brown MJB, Smith DG, Reith AD. The structure of phosphorylated GSK-3beta complexed with a peptide, FRATtide, that inhibits beta-catenin phosphorylation. Structure. 2001; 9:1143–52. https://doi.org/10.1016/S0969-2126(01)00679-7.
106. Franca-Koh J, Yeo M, Fraser E, Young N, Dale TC. The regulation of glycogen synthase kinase-3 nuclear export by Frat/GBP. J Biol Chem. 2002; 277:43844–8. https://doi.org/10.1074/jbc.M207265200.
107. Jonkers J, Korswagen HC, Acton D, Breuer M, Berns A. Activation of a novel proto-oncogene, Frat1, contributes to progression of mouse T-cell lymphomas. EMBO J. 1997; 16:441–50. https://doi.org/10.1093/emboj/16.3.441.
108. Jonkers J, Weening JJ, van der Valk M, Bobeldijk R, Berns A. Overexpression of Frat1 in transgenic mice leads to glomerulosclerosis and nephrotic syndrome, and provides direct evidence for the involvement of Frat1 in lymphoma progression. Oncogene. 1999; 18:5982–90. https://doi.org/10.1038/sj.onc.1202995.
109. Wang Y, Hewitt SM, Liu S, Zhou X, Zhu H, Zhou C, Zhang G, Quan L, Bai J, Xu N. Tissue microarray analysis of human FRAT1 expression and its correlation with the subcellular localisation of beta-catenin in ovarian tumours. Br J Cancer. 2006; 94:686–91. https://doi.org/10.1038/sj.bjc.6602988.
110. Wang Y, Liu S, Zhu H, Zhang W, Zhang G, Zhou X, Zhou C, Quan L, Bai J, Xue L, Lu N, Xu N. FRAT1 overexpression leads to aberrant activation of β-catenin/TCF pathway in esophageal squamous cell carcinoma. Int J Cancer. 2008; 123:561–8. https://doi.org/10.1002/ijc.23600.
111. Guo G, Mao X, Wang P, Liu B, Zhang X, Jiang X, Zhong C, Huo J, Jin J, Zhuo Y. The expression profile of FRAT1 in human gliomas. Brain Res. 2010; 1320:152–8. https://doi.org/10.1016/j.brainres.2010.01.037.
112. Zhang Y, Yu JH, Lin XY, Miao Y, Han Y, Fan CF, Dong XJ, Dai SD, Wang EH. Overexpression of Frat1 correlates with malignant phenotype and advanced stage in human non-small cell lung cancer. Virchows Arch. 2011; 459:255–63. https://doi.org/10.1007/s00428-011-1135-5.
113. He L, Yang Z, Zhou J, Wang W. The clinical pathological significance of FRAT1 and ROR2 expression in cartilage tumors. Clin Transl Oncol. 2015; 17:438–45. https://doi.org/10.1007/s12094-014-1254-y.
114. Yuan Y, Yang Z, Miao X, Li D, Liu Z, Zou Q. The clinical significance of FRAT1 and ABCG2 expression in pancreatic ductal adenocarcinoma. Tumour Biol. 2015; 36:9961–8. https://doi.org/10.1007/s13277-015-3752-0.
115. Liu DQ, Li FF, Zhang JB, Zhou TJ, Xue WQ, Zheng XH, Chen YB, Liao XY, Zhang L, Zhang SD, Hu YZ, Jia WH. Increased RIPK4 expression is associated with progression and poor prognosis in cervical squamous cell carcinoma patients. Sci Rep. 2015; 5:11955. https://doi.org/10.1038/srep11955.
116. Huang X, McGann JC, Liu BY, Hannoush RN, Lill JR, Pham V, Newton K, Kakunda M, Liu J, Yu C, Hymowitz SG, Hongo JA, Wynshaw-Boris A, et al. Phosphorylation of Dishevelled by Protein Kinase RIPK4 Regulates Wnt Signaling. Science. 2013; 339:1441–5. https://doi.org/10.1126/science.1232253.
117. Li W, Turner A, Aggarwal P, Matter A, Storvick E, Arnett DK, Broeckel U. Comprehensive evaluation of AmpliSeq transcriptome, a novel targeted whole transcriptome RNA sequencing methodology for global gene expression analysis. BMC Genomics. 2015; 16:1069. https://doi.org/10.1186/s12864-015-2270-1.
118. Anders S, Pyl PT, Huber W. HTSeq-A Python framework to work with high-throughput sequencing data. Bioinformatics. 2015; 31:166–9. https://doi.org/10.1093/bioinformatics/btu638.
119. Love MI, Huber W, Anders S. Moderated estimation of fold change and dispersion for RNA-seq data with DESeq2. Genome Biol. 2014; 15:550. https://doi.org/10.1186/s13059-014-0550-8.
120. Yu G, Wang L-G, Han Y, He Q-Y. clusterProfiler: an R package for comparing biological themes among gene clusters. OMICS. 2012; 16:284–7. https://doi.org/10.1089/omi.2011.0118.
121. Walter W, Sánchez-Cabo F, Ricote M. GOplot: an R package for visually combining expression data with functional analysis. Bioinformatics. 2015; 31:2912–4. https://doi.org/10.1093/bioinformatics/btv300.
122. Luo W, Brouwer C. Pathview: an R/Bioconductor package for pathway-based data integration and visualization. Bioinformatics. 2013; 29:1830–1. https://doi.org/10.1093/bioinformatics/btt285.