
INTRODUCTION
Colorectal cancer (CRC) is the third most prevalent cancer globally. Over a million cases are diagnosed each year and there are almost 700,000 deaths due to it annually [1–3]. It occurs more in developed countries [4, 5], with the highest rates in Australia, New Zealand, Europe and the USA.
CRC risk is strongly related to age and sex, and is most common in men and older people. Only a small proportion of colorectal cancers are thought to be due to inherited genetic abnormalities, while lifestyle factors such as diet, obesity, smoking, and lack of physical activity are much more influential. In about 20% of all cases there is a family history of colon cancer, and around 4% are due to the inherited genetic disorders familial adenomatous polyposis (FAP) and hereditary non-polyposis colon cancer (HNPCC) [4].
The acquisition of somatic mutations in oncogenes such as KRAS, RAF, and PI3K are often seen in colon cancer. Upregulation of the WNT and TGF-β signaling pathways results in increased activity of MYC, an important effector of colorectal cancer [6]. However, epigenetic changes are more frequent in colon cancer than mutations in genes; often a colon tumor has only one or two oncogene driver mutations, one to five tumor suppressor driver mutations, with around sixty passenger mutations, while there are hundreds of epigenetic changes. CpG island methylation of the DNA sequences encoding miR-34b/c, miR-124a, miR-137 and miR-342 resulting in their reduced expression can affect expression of hundreds of target genes in each case and are associated with colorectal cancer [7, 8, 9]. Hypermethylation or hypomethylation of CpG islands and changes in histones and chromosomal architecture are other (epigenetic) changes that can cause colorectal cancers. The development of clinical sequencing has enabled pre-treatment sequencing of relevant MAPK pathway genes such as KRAS, BRAF and MEK1, that predict response to EGFR targeted therapies such as cetuximab and panitumumab [10].
Guiding treatments using characterization of tumor biomarkers such as immunohistochemistry and genomic sequencing across many cancer types has resulted in better outcomes [11, 12]. We looked at the efficacy of one such method (outside the context of clinical KRAS and BRAF sequencing) from Caris Life Sciences, for colorectal adenocarcinomas. The effect of this profiling approach on overall survival and drug use was assessed.
RESULTS
Patient characteristics
Data describing advanced colorectal adenocarcinoma patients who underwent treatment was divided into two groups depending upon if treatments matched recommendations that used tumor molecular profiles. In the matched group, 42 patients received at least one recommended drug subsequent to collection for profiling and none that were not. In the unmatched group 53 patients all received one or more drugs predicted by profiling to lack benefit after sample collection. Patients and their tumors are summarized in Table 1.
Table 1: Matched and unmatched groups compared against all patients
Group |
Patient & Tumor Information |
||||||
|---|---|---|---|---|---|---|---|
Age |
Ethnicity |
Histology |
Grade |
Stage |
Survival (Days) |
Mortality |
|
All patients (95) |
59.9 |
White: 80; Black/African American: 10; Asian: 2; Hawaiian/Pacific Islander: 1; Other/unknown: 2 |
Adenocarcinoma, NOS: 69; Mucinous adenocarcinoma: 11; Adenocarcinoma, intestinal type: 9; Adenocarcinoma in adenomatous polyp: 2; Squamous cell carcinoma, NOS: 2; Signet ring cell carcinoma: 1; Tubular adenoma, NOS: 1 |
Grade 2 / Moderately differentiated: 63 (66%); Grade 3/ Poorly differentiated: 16 (17%); Unknown / Not determined: 9 (10%); Grade 1 / Well differentiated: 3 (3%); Grade 4 / Undifferentiated: 2 (2%);None / Not applicable: 2 (2%) |
IV: 38 (40%); III no IIIC: 23 (24%); IIIC: 11 (12%); II: 9 (10%); I: 6 (6%); Unknown: 8 (8%) |
497 |
36% |
Matched only (42) |
60.3 |
White: 32; Asian: 1; Black/African American: 8; Hawaiian/Pacific Islander: 1; Other/unknown: 0 |
Adenocarcinoma, NOS: 29; Adenocarcinoma, intestinal type: 5; Mucinous adenocarcinoma: 3; Squamous cell carcinoma, NOS: 2; Adenocarcinoma in adenomatous polyp: 2; Signet ring cell carcinoma: 1 |
Grade 2 / Moderately differentiated: 29 (69%); Unknown / Not determined: 6 (14%); Grade 3/ Poorly differentiated: 4 (10%); Grade 4 / Undifferentiated: 2 (5%); None / Not applicable: 1 (2%) |
IV: 14 (33%); III no IIIC: 13 (31%); IIIC: 3 (7%); II: 4 (9%); I: 4 (9%); Unknown: 4 (9%) |
442 |
19% |
Unmatched (53) |
59.5 |
White: 48; Black/African American: 2; Asian: 1; Hawaiian/Pacific Islander: 0; Other/unknown: 2 |
Adenocarcinoma, NOS: 40; Mucinous adenocarcinoma: 8; Adenocarcinoma, intestinal type: 4; Tubular adenoma, NOS: 1 |
Grade 2 / Moderately differentiated: 34 (64%); Grade 3/ Poorly differentiated: 12 (22%); Unknown / Not determined: 3 (6%); Grade 1 / Well differentiated: 3 (6%); None / Not applicable: 1 (2%) |
IV: 24 (45%); III no IIIC: 10 (19%); IIIC: 8 (15%); II: 5 (9%); I: 2 (4%); Unknown: 4 (8%) |
541 |
49% |
Treatment analysis
Waterfall plots showing drugs received and survival for both treatment groups are shown in Figure 1. The clinical information for the 42 matched and 53 unmatched patients are depicted as columns (on the left and right of the figure respectively), where green shows administration of drugs expected to be of benefit, red is drugs that lack benefit, and yellow is both of these types in combination.
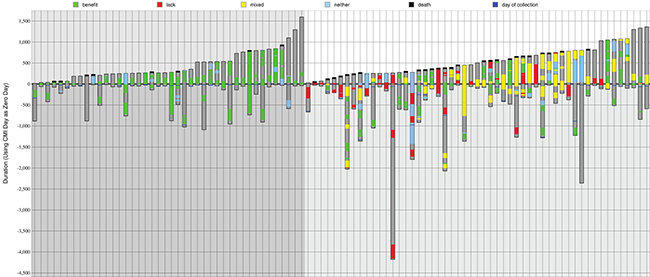
Figure 1: Summary of drug treatments and outcomes. Treatment schedules are shown in ascending post-profiling survival time for 42 matched (on the left, darker gray background) and 53 unmatched patients (on the right, lighter gray background). A black line at the top of a bar shows that the patient was deceased. Dark gray within a bar is time monitored to either death or last follow-up. Green is time on a drug of benefit. Red is a lack of benefit treatment. Yellow is a combination therapy composed of both benefit and lack of benefit drugs. Blue is a neutral therapy (neither benefit nor lack of benefit).
The drugs that were given are shown in Table 2. The number of patients that received a particular drug is shown in the first column, and the number of continuous treatment periods of a drug is shown in all other columns, i.e. treatments of the same patient with an intervening time are counted separately. The drugs given to the most number of patients were fluorouracil (87 patients), oxaliplatin (81), leucovorin calcium (77), bevacizumab (52) and irinotecan hydrochloride (47).
Table 2: Most common drugs given more than once, and those that were profiled to be of benefit, of no benefit, or classed as neither of these
Number of Patients |
Most Frequently Administered Drugs (Total Treatment Periods) |
|||||||
|---|---|---|---|---|---|---|---|---|
All patients treated |
All patients (95) – treatment periods |
Matched only patients (42), all treatments |
Matched, after profiling treatments only |
Unmatched patients (53), all treatments |
Unmatched, after profiling treatments only |
Drugs predicted of benefit |
Drugs predicted to lack benefit |
Drugs with no prediction (neither of benefit or lack of benefit) |
fluorouracil – 87 patients |
fluorouracil = 168 |
fluorouracil = 47 |
fluorouracil = 16 |
fluorouracil = 121 |
fluorouracil = 49 |
fluorouracil = 115 |
irinotecan hydrochloride = 34 |
leucovorin calcium = 120 |
oxaliplatin – 81 patients |
leucovorin calcium = 127 |
oxaliplatin = 36 |
bevacizumab = 13; oxaliplatin = 13 |
leucovorin calcium = 92 |
leucovorin calcium = 39 |
oxaliplatin = 46 |
oxaliplatin =28 |
bevacizumab = 59 |
leucovorin calcium – 77 patients |
oxaliplatin = 109 |
leucovorin calcium = 35 |
- |
bevacizumab = 75 |
irinotecan hydrochloride = 27 |
bevacizumab = 33 |
fluorouracil = 25 |
oxaliplatin = 26 |
bevacizumab – 52 patients |
bevacizumab = 96 |
bevacizumab = 21 |
leucovorin calcium = 12 |
oxaliplatin = 73 |
bevacizumab = 24 |
irinotecan hydrochloride = 21 |
cetuximab = 9 |
capecitabine = 24 |
irinotecan hydrochloride – 47 patients |
irinotecan hydrochloride = 62 |
capecitabine = 18 |
capecitabine = 9 |
irinotecan hydrochloride = 49 |
oxaliplatin = 16 |
capecitabine = 14 |
capecitabine = 5 |
fluorouracil = 18 |
capecitabine – 31 patients |
capecitabine = 47 |
irinotecan hydrochloride = 13 |
irinotecan hydrochloride = 7 |
capecitabine = 29 |
cetuximab = 13 |
cetuximab = 6 |
panitumumab = 3 |
ziv-aflibercept = 9 |
cetuximab – 15 patients |
cetuximab = 17 |
l-leucovorin = 2; |
l-leucovorin = 2; |
cetuximab = 16 |
capecitabine = 7 |
doxorubicin hydrochloride = 2 |
- |
l-leucovorin = 6 |
ziv-aflibercept – 8 patients |
ziv-aflibercept = 9 |
- |
- |
ziv-aflibercept = 7 |
ziv-aflibercept = 6 |
- |
- |
cyclophosphamide = 3 |
l-leucovorin; panitumumab – 6 patients |
l-leucovorin = 6; panitumumab = 6 |
- |
- |
panitumumab = 5 |
panitumumab = 3; l-leucovorin = 3 |
- |
- |
cetuximab = 2; irinotecan hydrochloride = 2; |
- |
- |
- |
- |
l-leucovorin = 4 |
- |
- |
- |
- |
Patients received 6.63 treatments on average; 38% were profiled to be beneficial, 17% had no benefit, and 45% were neither of these. Matched patients had 4.17 treatments on average; 53% of these were predicted of benefit, 0% no benefit, and 47% neither. Unmatched patients had an average of 8.58 drug treatments; 33% of which were of benefit, 23% lacked benefit and 44% neither of these. 8% of unmatched patients had one or more drug treatments of benefit, and 7% had at least two of these types of treatment. Before profiling, patients received 3.92 lines of treatment on average.
The drugs that were profiled as beneficial that were most often given were fluorouracil (115 treatments), oxaliplatin (46), bevacizumab (33), irinotecan hydrochloride (21), and capecitabine (14). The drugs lacking benefit that were most commonly prescribed were irinotecan hydrochloride (34 times), oxaliplatin (28), fluorouracil (25), and cetuximab (9).
Some of the drugs did not have a recommendation, and this neither category constituted 47% of treatments in the matched group and 44% in the unmatched cohort. Of this type, leucovorin calcium was given most often - 120 times, which was 19% of all treatments.
Fluorouracil was given far more often when it was profiled to be of benefit - 115 times that it was given coincided with beneficial predictions, whereas 25 did not. Oxaliplatin was given for 46 periods of time when predicted to be useful, whereas 28 treatments were expected to lack benefit, and 26 neither. Irinotecan hydrochloride was less optimal in its use, with 21 beneficial treatments, 34 lacking benefit, and two being of neither type. Interestingly, given the reliance on 5FU related compounds in the systemic treatment of CRC, we found that thymidylate synthase (TS) was a marker for worse outcomes in CRC (Figure 2). The literature already documents worse outcomes with high levels of TS [13]. However, only patients with unmatched treatments had positive biomarker results when IHC testing for TS.
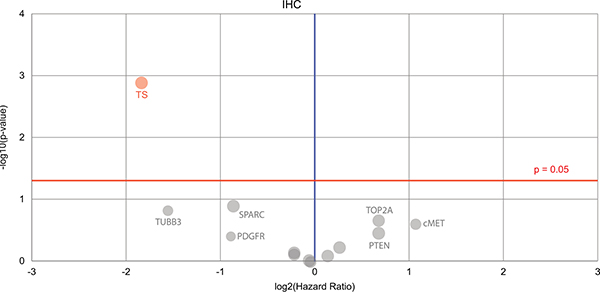
Figure 2: A Volcano plot is shown denoting the biomarkers’ prognostic value. Only one biomarker of significance is found (on the top left), the immunohistochemistry thymidylate synthase (TS) marker. Red circle = the hazard rate of a positive biomarker result is significantly higher than that of a negative biomarker result, gray = the difference between a positive biomarker result and a negative biomarker result is not significant. Red line = significance threshold.
Mismatch repair (MMR) deficient cancers are targets for anti-PD-1 therapy [14], and recently the FDA has approved Keytruda (pembrolizumab) for unresectable or metastatic solid tumors that have been identified as having a biomarker for MSI-H (microsatellite instability-high) or MMR deficient. We observe that although only three patients in this cohort had IHC markers tested for PD-L1 and the mismatch repair related markers MSH2, MSH6, PMS2 and MLH1; in all cases PD-L1 was negative while all of the MMR markers were positive.
Survival analysis
In the matched group 19% of patients were deceased by the end of monitoring, and 49% of the unmatched group (P = 0.0022). The matched group survived for 442 days on average and the unmatched survived for 541 days (P = 0.1773) after profiling. A Kaplan–Meier curve in Figure 3 (top-right) shows the overall survival for matched patients and unmatched patients. There is also a survival plot in Figure 3 (mid-right). The matched group have a lower mortality, but survive on average for less time after profiling when measuring up to the last time of monitoring. However, it can be seen that the matched group shown on the left of Figure 1 have been monitored for less time overall; the matched group’s average number of contact days after diagnosis is 733, and the unmatched group’s is 1150 days. This may explain why in this cohort mortality is lower for matched treatments while time that patients are known to have survived is lower.
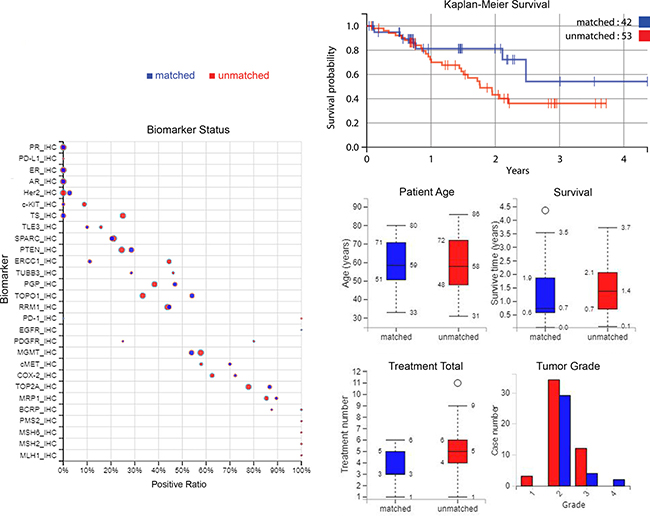
Figure 3: Plots of biomarker statuses, survival, and patient and tumor characteristics. Left: biomarker statuses in the treatment groups, where the size of the circle indicates the number of cases. Top-right: A Kaplan–Meier curve of overall survival from time of profiling, comparing treatment groups. Middle-right to lower-right: a summary of patient ages, survival time, treatment numbers, and grade of samples. Blue = matched patients, red = unmatched patients.
Biomarker values are compared between matched and unmatched in Figure 3 also (on the left), and some demographic and tumor information is summarized (middle-right to lower-right).
DISCUSSION
Here we looked at the benefit of profiling tumors using biomarkers to tailor clinical therapies accordingly, by investigating the differences in response between patients that followed such recommendations to those that did not completely adhere to them. We used clinical data for a colorectal adenocarcinoma cohort of patients, whose clinicians received treatment suggestions that used tumor molecular profiling by Caris Life Sciences and received associated treatment predictions.
The unmatched group received 6.6 more drug therapies than the matched group on average, and had a poorer survival prognosis, although these patients did have tumors that were more advanced than in the matched group, as shown in Table 2. We find that thymidylate synthase (TS) as an immunohistochemical marker is associated with significantly worse outcomes in this cohort (Figure 2).
The survival curves for the different treatment groups overlap but then diverge. This indicates that therapy predictions guided by tumor profiling have a positive effect on the choice of therapies and leads to an improved outcome, as would be expected if correct stratification of treatments occurs in the clinic. A reduction in mortality was also detected. Overall this gives a good indication that there is a benefit from tumor molecular profiling in this colorectal adenocarcinoma cohort using this technology.
MATERIALS AND METHODS
The Caris CODE database (version 1.0) contains tumor molecular profile data for 841 patients with solid tumors. It also contains demographic information about these patients, the drug treatments that they received before and after molecular profiling and records of their clinical outcomes while they were still being monitored. There are 95 colorectal adenocarcinoma patients within this database, and this colorectal cancer cohort was mined after web scraping the data from the Caris CODE website, to understand if molecular characterization affected drug selection by treating physicians, and if any molecular subsets had different outcomes across tumor types. Table 1 describes the clinical characteristics of the patients that were profiled. According to Caris Life Sciences, 36% of cases used here had a metastatic sample profiled.
As shown in Figure 1, the amount of time that patients were monitored varied, although on average patients’ treatment records were available for 966 days (733 for matched treatment patients, 1150 for unmatched patients), and on average the time of monitoring after profiling was 497 days. The longest amount of time that records were available, i.e. before and after diagnosis, up until the last contact day, was 4442 days. The longest period of monitoring after tumor profiling (the patient represented on the furthest right of Figure 1) was 1594 days; this was 1634 days after diagnosis.
The data were analysed independently of Caris. Patients were covered under 1 of 4 different protocols or exemptions, listed as follows. (1). The Caris Registry Protocol (TCREG-001-00-V2-1209) was approved by WIRB (WIRB Tracking #20092285) and has an NCT# of NCT02678754. (2). The Caris POA Prospective Repository (COE-001-0815) was approved by WIRB (WIRB Tracking #20162864) and has an NCT# of NCT03324841. (3). The Caris POA Retrospective Repository (COE-002-0116) was approved by WIRB (WIRB Tracking #20162657) and has an NCT# of NCT 00326499. (4). ION data is covered under an IRB exemption. All data are retrospective and have been de-identified prior to Caris receiving it and authors performing independent analyses.
Abbreviations
CRC, colorectal cancer; FAP, familial adenomatous polyposis; HNPCC, hereditary non-polyposis colon cancer; TS, thymidylate synthase.
Author contributions
All authors contributed equally to the work described in this paper and were involved in writing it.
ACKNOWLEDGMENTS
Thanks to Caris Life Sciences for the provision of their CODE database, and assistance by Dr David Spetzler, Todd Maney, Dr Jia Zeng, Dr Tina Liu, Dr Nick Xiao and Stephanie Ratliff in the use of this resource. We are also grateful to the patients involved in this study.
CONFLICTS OF INTEREST
No authors declare a conflict of interest and received no honoraria for these publications.
FUNDING
This work was supported by the Action Against Cancer charity (http://www.aacancer.org/). Infrastructure support was provided by the Imperial Experimental Cancer Medicine Centre, the CRUK Imperial Centre, and the Imperial NIHR Biomedical Research Centre.
REFERENCES
1. World Cancer Report 2014. World Health Organization. 2014. pp. Chapter 1.1.
2. Cunningham D, Atkin W, Lenz HJ, Lynch HT, Minsky B, Nordlinger B, Starling N. Colorectal cancer. Lancet. 2010; 375:1030–47.
3. Lozano R, Naghavi M, Foreman K, Lim S, Shibuya K, Aboyans V, Abraham J, Adair T, Aggarwal R, Ahn SY, Alvarado M, Anderson HR, Anderson LM, et al. Global and regional mortality from 235 causes of death for 20 age groups in 1990 and 2010: a systematic analysis for the Global Burden of Disease Study 2010. Lancet. 2012; 380:2095–128.
4. World Cancer Report 2014. World Health Organization. 2014. pp. Chapter 5.5.
5. Merika E, Saif MW, Katz A, Syrigos K, Morse M. Review. Colon cancer vaccines: an update. In Vivo. 2010; 24:607–28.
6. Muzny DM, Bainbridge MN, Chang K, Dinh HH, Drummond JA, Fowler G, Kovar CL, Lewis LR, Morgan MB, Newsham IF, Reid JG, Santibanez J, Shinbrot E, et al, and Cancer Genome Atlas Network. Comprehensive molecular characterization of human colon and rectal cancer. Nature. 2012; 487:330–37.
7. Balaguer F, Link A, Lozano JJ, Cuatrecasas M, Nagasaka T, Boland CR, Goel A. Epigenetic silencing of miR-137 is an early event in colorectal carcinogenesis. Cancer Res. 2010; 70:6609–18.
8. Deng G, Kakar S, Kim YS. MicroRNA-124a and microRNA-34b/c are frequently methylated in all histological types of colorectal cancer and polyps, and in the adjacent normal mucosa. Oncol Lett. 2011; 2:175–80.
9. Grady WM, Parkin RK, Mitchell PS, Lee JH, Kim YH, Tsuchiya KD, Washington MK, Paraskeva C, Willson JK, Kaz AM, Kroh EM, Allen A, Fritz BR, et al. Epigenetic silencing of the intronic microRNA hsa-miR-342 and its host gene EVL in colorectal cancer. Oncogene. 2008; 27:3880–8.
10. Leto SM, Trusolino L. Primary and acquired resistance to EGFR-targeted therapies in colorectal cancer: impact on future treatment strategies. J Mol Med (Berl). 2014; 92:709–22.
11. Frampton GM, Fichtenholtz A, Otto GA, Wang K, Downing SR, He J, Schnall-Levin M, White J, Sanford EM, An P, Sun J, Juhn F, Brennan K, et al. Development and validation of a clinical cancer genomic profiling test based on massively parallel DNA sequencing. Nat Biotechnol. 2013; 31:1023–31.
12. Khirade MF, Lal G, Bapat SA. Derivation of a fifteen gene prognostic panel for six cancers. Sci Rep. 2015; 5:13248.
13. Popat S, Matakidou A, Houlston RS. J Clin Oncol. Thymidylate synthase expression and prognosis in colorectal cancer: a systematic review and meta-analysis. 2004; 22:529–36.
14. Kelderman S, Schumacher TN, Kvistborg P. Cancer Cell. Mismatch Repair-Deficient Cancers Are Targets for Anti-PD-1 Therapy. 2015; 28:11–3.