
INTRODUCTION
Colorectal carcinogenesis is driven by sequential genetic and epigenetic alteration of epithelial cells and is also influenced by tumor-host interaction [1–3]. A well-known example of this interaction is the strong histological reaction of tumor infiltrating lymphocytes (TILs) that globally constitute a robust prognostic parameter of favorable clinical outcome in colorectal cancer (CRC) patients, acting as the gatekeepers in preventing tumor dissemination [4]. However, tumors are rarely rejected spontaneously, because of their ability to create an immunosuppressive microenvironment through the activation of immune checkpoints such as PD-L1, CTLA-4, LAG-3, TIM-3 [5]. Programmed cell death-1 (PD-1) and PD-L1 (natural ligand of PD-1) pathway is one of the most studied immune checkpoint and it is crucial both in physiological conditions (for the maintenance of self-tolerance and to avoid autoimmune diseases) [6] and to evade antitumor immunity [7]. The specific binding between PD-1 and PD-L1 inhibits interleukin II production by T cells and increases the T lymphocyte apoptosis [8].
PD-1 is an immune-inhibitory receptor that is constitutively expressed by activated T lymphocytes and macrophages whereas other non-T lymphocytes, such as B cells and natural killer cells, express PD-1 only on induction [9, 10]. High levels of expression of PD-1 are induced on T lymphocytes as a result of persistent inflammatory stimuli that determine their exhaustion or anergy [11].
PD-L1 is constitutively expressed by T and B cells, macrophages and dendritic cells and is up-regulated by many inflammatory mediators and cytokines [12–14]. PD-L1 is also expressed on tumor cells in several cancer types and its expression implies a weakened host immune response and consequent poor prognosis in several malignancies as malignant melanoma, lung cancer (NSCLC), thymoma, bladder, ovarian, renal cell carcinomas (RCC) [15, 16], and GEP-NEN [17]. The prognostic role of PD-L1 in CRC is less clear, with some studies reporting conflicting results [18, 19].
Because immune checkpoints are one of the steps for immune escape and tumor development, inhibition of these molecules with monoclonal antibodies may restore host immune response and, consequently, stop tumor growth and even cause tumor regression. For this reason immunotherapy using immune checkpoint inhibitors is a rapidly growing modality for the treatment of some human cancer [5, 20–22]. One of the most studied predictive biomarkers for response to checkpoint blockade is the immunohistochemical expression of PD-L1. Studies have shown that inhibitors targeting PD-L1 or PD-1 protein can improve clinical outcomes in various types of cancers such as malignant melanoma, NSCLC, RCC, and bladder cancer. Although initial trials have suggested no role for immunotherapy in CRC [23], Le et al. [24] showed that 40% of patients with CRC-mismatch repair deficiency (dMMR), treated with Pembrolizumab (MAb anti-PD-1) responded to therapy vs 0% of patients with CRC-mismatch repair proficiency (pMMR) .
Although the majority of CRCs develops via a chromosomal instability pathway, approximately 12–15% have dMMR which is responsible for microsatellite instability (MSI) [25, 26]. This defect produce an increased mutational burden that leads to the creations of aberrant proteins, acting as neo-antigens eliciting an immune response by TILs [27, 28]. MSI CRC shows a T immune infiltration that is geographically associated with the upregulation of T cell checkpoints such as PD-L1. MSI CRCs are most frequently right-sided, poorly differentiated, mucinous, lymphocyte-rich neoplasias and show a more favorable prognosis than other types of CRCs.
Since it has been shown that not all MSI CRCs respond [24, 29], it is important to identify new targets that allow better selection of the eligible patients to immunotherapy.
The aim of this study is to investigate the immunohistochemical expression of PD-L1 in colorectal cancer cells and in its microenvironment and to correlate with microsatellite instability status and morphological and molecular characteristics.
RESULTS
PD-L1 immunohistochemical expression
A total of 63 CRC specimens were included in this study. The clinicopathological characteristics of patients are listed in Table 1.
Table 1: Clinicopathological and molecular characteristics of 63 CRCs
n (%) |
|
|---|---|
Sex |
|
Male |
31 (50.8)* |
Female |
30 (49.2)* |
Age (M ± DS) |
58.87±14.84 |
Tumor site |
|
Right colon |
31 (49.21) |
Left colon |
32 (50.79) |
Histological type |
|
Adenocarcinoma |
52 (82.54) |
Medullary |
11 (17.46) |
Tumor grade |
|
G1+G2 |
33 (52.38) |
G3 |
30 (47.62) |
Pattern of advancing border |
|
Pushing |
28 (44.44) |
Infiltrating |
35 (55.56) |
Tumor Budding |
|
Absent |
11 (17.46) |
Present |
52 (82.54) |
IICs |
|
Absent/Mild |
19 (30.16) |
Moderated/Marked |
44 (69.84) |
TANs |
|
Sporadic |
19 (30.16) |
Massive |
44 (69.84) |
pN status |
|
N0 |
46 (73.02) |
N1 |
17 (26.98) |
RAS status |
|
Mutant |
22 (34.92) |
Wild-type |
41 (65.08) |
BRAF status |
|
Mutant |
9 (14.28) |
Wild-type |
54 (85.72) |
MSI status |
|
MSI |
26 (41.27) |
MSS |
37 (58.73) |
Abbreviations: TANs = Tumor Associated Neutrophils; IICs = Infiltrating Immune Cells.
* = One male and one female have 2 synchronous tumors.
The male patient has both MSS tumors, the female has both MSI.
PD-L1 staining was observed with different rate both in neoplastic cells (NCs) and in infiltrating immune cells (IICs). NCs were positive in 25% of samples, while IICs in 78% (Table 2). The normal colonic mucosa did not show any staining. A predominately membranous staining was observed in positive NCs cells. In these cells either a focal or a diffuse PD-L1 positive pattern, with the prevalence of the former was detected. When the pattern was focal, the positivity of NCs was prevalently localized along the tumor-stromal interface. Rarely scattered single or small nests of positive NCs dispersed in an otherwise negative tumor plate were observed. In IICs the membranous expression was more difficult to distinguish and a diffuse positive pattern was prevalent. Representative images of PD-L1 expression in NCs and IICs are shown in Figure 1.
Table 2: Clinicopathological and molecular characteristics of 63 CRCs with PD-L1 expression in NCs and in IICs
PD-L1 expression |
||||||
|---|---|---|---|---|---|---|
NCs |
IICs |
|||||
PD-L1 + n = 16 (25%) |
PD-L1 - n = 47 (75%) |
P-Value |
PD-L1 + n = 49 (78%) |
PD-L1 - n = 14 (22%) |
P-Value |
|
Sex |
NS |
NS |
||||
Male |
9 (56.25) |
25 (53.19) |
25 (51.02) |
9 (64.29) |
||
Female |
7 (43.75) |
22 (46.81) |
24 (48.98) |
5 (35, 71) |
||
Age (M ± DS) |
66.25 ± 16.26 |
56.36 ± 13.62 |
0.04 |
59.90 ± 14.36 |
55.29 ± 16.48 |
NS |
Tumor site |
0.004 |
0.005 |
||||
Right colon |
13 (81.25) |
18 (38.30) |
29 (59.18) |
2 (14.29) |
||
Left colon |
3 (18.75) |
29 (61.70) |
20(40.82) |
12 (85.71) |
||
Histological type |
< 0.001 |
NS |
||||
Adenocarcinoma |
6 (37.50) |
46 (97.87) |
38 (77.55) |
14 (100) |
||
Medullary |
10 (62.50) |
1 (2.13) |
11 (22.45) |
0 (0) |
||
Tumor grade |
< 0.001 |
NS |
||||
G1+G2 |
0 (0) |
33 (70.21) |
23 (46.94) |
10 (71.43) |
||
G3 |
16 (100) |
14 (29.79) |
26 (53.06) |
4 (28.57) |
||
Pattern of advancing border |
NS |
NS |
||||
Pushing |
7 (43.75) |
21 (44.68) |
22 (44.90) |
6 (42.86) |
||
Infiltrating |
9 (56.25) |
26 (55.32) |
27 (55.10) |
8 (57.14) |
||
Tumor Budding |
NS |
NS |
||||
Absent |
1 (6.25) |
10 (21.28) |
8 (57.14) |
3 (21.43) |
||
Present |
15 (93.75) |
37 (78.72) |
41 (83.67) |
11 (78.57) |
||
IICs |
NS |
<0.001 |
||||
Absent/Mild |
3 (18.75) |
16 (34.04) |
7 (14.28) |
12 (85.71) |
||
Moderated/Marked |
13 (81.25) |
31 (65.96) |
42 (85.72) |
2 (14.29) |
||
TANs |
0.003 |
NS |
||||
Sporadic |
10 (62.50) |
9 (19.15) |
14 (28.57) |
5 (35.71) |
||
Massive |
6 (37.50) |
38 (80.85) |
35 (71.43) |
9 (64.29) |
||
pN status |
NS |
NS |
||||
N0 |
9 (56.25) |
37 (78.72) |
37 (75.51) |
9 (64.29) |
||
N1 |
7 (43.75) |
10(21.28) |
12 (24.49) |
5 (35.71) |
||
RAS status |
NS |
NS |
||||
Mutant |
5 (31.25) |
17 (36.17) |
17 (34.69) |
5 (37.51) |
||
Wild-type |
11 (68.75) |
30 (63.83) |
32 (65.31) |
9 (64.29) |
||
BRAF status |
0.001 |
NS |
||||
Mutant |
7 (43.75) |
2 (4.26) |
9 (18.37) |
0 (0) |
||
Wild-type |
9 (56.25) |
45 (95.74) |
40 (81.63) |
14 (100) |
||
MSI status |
0.003 |
0.03 |
||||
MSI |
12 (75.00) |
14 (29.79) |
24 (48.98) |
2 (14.29) |
||
MSS |
4 (25.00) |
33 (70.21) |
25 (51.02) |
12 (85.71) |
||
Abbreviations: NCs = Neoplastic Cells; TANs = Tumor Associated Neutrophils; IICs = Infiltrating Immune Cells.
NS = not significant.
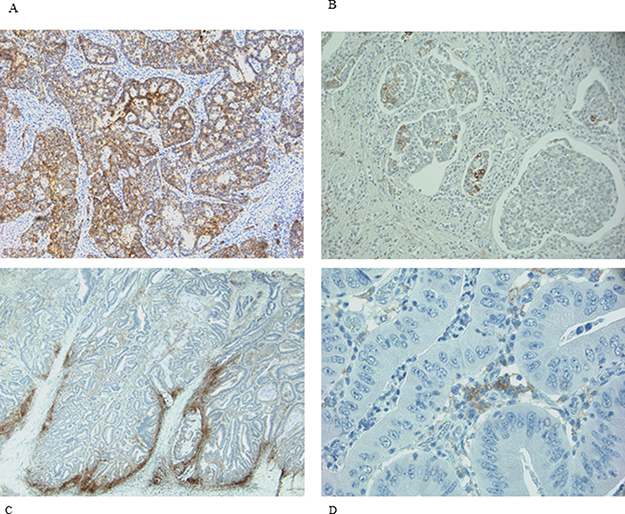
Figure 1: IHC expression of PD-L1 in NCs and IICs. (A and B) representative diffuse and focal expression in NCs; (C and D) representative diffuse and focal expression in IICs.
PD-L1 in NCs
The association between PD-L1 expression in NCs and clinicopathological and molecular parameters is shown in Table 2. PD-L1 expression was significantly associated with older age (p = 0.04), right sided location (p = 0.004), medullary histology (p < 0.001), G3 tumor grade (p < 0.001), sporadic tumor associated neutrophils (TANs) (p = 0.003), BRAF mutation (p = 0.001), and MSI (p = 0.003). On the contrary, the other features such as sex, pattern of advancing border, tumor budding, IICs density, pN status, and RAS status were not associated with PD-L1 expression in tumor cells. By multivariate analysis, after adjusting for sex and age, right sided location (OR 6.25; 95% CI 1.44–27.17; p = 0.01), medullary histology (OR 62.81; 95% CI 6.61–596.77; p < 0.001), sporadic TANs (OR 6.41; 95% CI 1.70–24.13; p = 0.006), N1 status (OR 5.33; 95% CI 1.20–23.66; p = 0.03), BRAF mutation (OR 18.41; 95% CI 2.15–157.93; p = 0.008) and MSI status (OR 10.79; 95% CI 2.37–49.12; p = 0.002) were significantly associated with PD-L1 expression.
PD-L1 in IICs
The association between PD-L1 expression in IICs and clinicopathological and molecular parameters is shown in Table 2. PD-L1 expression in IICs was significantly associated with right sided location (p = 0.005), moderate/marked IICs density (p < 0.001), and MSI (p = 0.03). Instead the other features (sex, age, histological type, tumor grade, pattern of advancing border, tumor budding, TANs, pN status, RAS and BRAF status ) were not associated with PD-L1 expression in IICs.
By multivariate analysis, after adjusting for sex and age, right sided location (OR 7.94; 95% CI 1.51–41.70; p = 0.01) and MSI status (OR 5.48; 95% CI 1.06–28.21; p = 0.04) were significantly associated with PD-L1 expression.
Pattern of PD-L1 expression in tumor microenvironment
All specimens PD-L1 positive in NCs showed PD-L1 expression also in IICs. There were no specimens positive only in NCs. Following these findings three groups can be assembled: group A (14 samples negative both in NCs and in IICs); group B (33 samples positive only in IICs); group C (16 samples positive both in NCs and IICs). The comparison among groups is shown in Table 3. Samples of group A compared with those of group B are prevalently localized on the left colon (p = 0.01). Samples of group C compared with those of group A are prevalently localized on the right colon (p < 0.0001), are associated with medullary histological type (p < 0.0001), G3 tumor grade (p < 0.0001), BRAF mutation (p = 0.001) and MSI status (p < 0.0001). Samples of group B compared with those of group C are prevalently localized on the left colon (p = 0.02), are associated with adenocarcinoma histological type (p < 0.0001), G1/G2 tumor grade (p < 0.0001), massive TANs (p = 0.0005), N0 status (p = 0.05), BRAF wild-type (p = 0.007) and microsatellite stability status (MSS) (p = 0.008).
Table 3: Comparison between groups A , B, C
A NCs-/IICs- n = 14 (23%) |
B NCs-/IICs+ n = 33 (52%) |
C NCs+/IICs+ n = 16 (25%) |
P-Value |
Comparison |
|||
|---|---|---|---|---|---|---|---|
A vs B |
C vs A |
B vs C |
|||||
Sex |
NS |
||||||
Males |
9 (64.29) |
16 (48.48) |
9 (56.25) |
NS |
NS |
NS |
|
Age (M ± DS) |
55.28±16.47 |
56.82±12.47 |
66.25±16.26 |
NS |
NS |
NS |
NS |
Tumor site |
0.01 |
||||||
Right colon |
2 (14.29) |
16 (48.48) |
13 (81.25) |
0.01 |
<0.0001 |
0.02 |
|
Histological type |
<0.001 |
||||||
Medullary |
0 (0.00) |
1 (3.03) |
10 (62.50) |
NS |
<0.0001 |
<0.0001 |
|
Tumor grade |
<0.001 |
||||||
G3 |
4 (28.57) |
10 (30.30) |
16 (100.00) |
NS |
<0.0001 |
<0.0001 |
|
Pattern of advancing border |
NS |
||||||
Infiltrating |
8 (57.14) |
18 (54.55) |
9 (56.25) |
NS |
NS |
NS |
|
Tumor Budding |
NS |
||||||
Present |
11 (78.57) |
26 (78.79) |
15 (93.75) |
NS |
NS |
NS |
|
IICs |
<0.001 |
||||||
Absent/Mild |
12 (85.71) |
4 (12.12) |
3 (18.75) |
<0.0001 |
<0.001 |
NS |
|
TANs |
0.001 |
||||||
Sporadic |
5 (35.71) |
4 (12.12) |
10 (62.50) |
NS |
NS |
0.0005 |
|
pN status |
NS |
||||||
N1 |
5 (35.71) |
5 (15.15) |
7 (43.75) |
NS |
NS |
0.05 |
|
RAS status |
NS |
||||||
Mutant |
5 (35.71) |
12 (36.36) |
5 (31.25) |
NS |
NS |
NS |
|
BRAF status |
0.001 |
||||||
Mutant |
0 (0.00) |
2 (6.06) |
7 (43.75) |
NS |
0.001 |
0.007 |
|
MSI status |
0.003 |
||||||
MSI |
2 (14.29) |
12 (36.36) |
12 (75.00) |
NS |
0.0001 |
0.008 |
|
Abbreviations: NCs = Neoplastic Cells; TAN s= Tumor Associated Neutrophils; IICs = Infiltrating Immune Cells.
NS = not significant.
DISCUSSION
PD-1/PD-L1 pathway is a significant mechanism of immune suppression within tumor microenvironment. MAbs to PD-1 and PD-L1 could block this pathway and reverse T cell exhaustion inducing tumor regression. In the treatment of malignancies including melanoma, NSCLC, renal cell carcinoma, bladder cancer these MAbs have an overall response rates ranging from 16% to 100% [30, 31]. Although initial trials have suggested no role for immunotherapy in patients with CRC, more recently it has been demonstrated that a specific subset of patients did benefit [4, 29].
Le et al. [24] in a phase II clinical trial, after the administration of Pembrolizumab (an anti-PD-L1 Mab), showed a partial objective response rate of 40% and 0% for dMMR and pMMR CRC patients, respectively. The phase II trial by Overman et al. [29] is, to date, the largest immunotherapy trial in CRC and highlighted a partial response to Nivolumab alone or in association with Ipilimumab in 31% of MSI patients versus 10% of MSS patients.
Despite these results being encouraging, it is clear that most MSI CRCs do not respond to immunotherapy and this represents the rational for testing other markers able to predict cancer population who be eligible for personalized immune approaches.
There is an apparent paradox: both MSI CRC and medullary carcinoma which have many overlapping clinical and morphological features, are generally characterized by better prognosis [32]. It is believed that this is associated with the rich lymphocyte infiltration which would give a robust immune response against the tumor. On the other hand, the prognostic unfavorable significance of PD-L1, often expressed by both of these tumor types, appears to be in contrast to the well-known favorable prognosis of MSI CRC and medullary carcinoma. However, not all MSI CRCs and medullary carcinomas have better survival [33]. Furthermore, the analysis of different types of tumors showed that PD-L1 status may correlate with either good or bad prognosis, or have no influence [34–38]. Therefore, if the expression of PD-L1 on NCs membrane could be the trick to escape an efficient immune-mediated antitumor response, then PD-L1 positivity in NCs of MSI CRC and/or medullary histological type, might be the predictive marker of that subset of samples with worse prognosis.
PD-L1 immunohistochemical expression in NSCLC and melanoma is used as marker to select patients who may be successful in the treatment with Pembrolizumab and Nivolumab [30, 31].
Assessing PD-L1 expression is complicated by many challenges: different immunohistochemical assays (i.e. different primary antibodies and assays conditions) and different PD-L1 evaluation methods (i.e. different scoring methods and PD-L1 positivity cut-offs) complicate the comparative evaluation between clinical studies [11, 18, 27, 39–44].
We used MAb E1L3N to PD-L1 immunohistochemical detection and cut-off of 5% positive cells. Most studies on CRC evaluated the expression of PD-L1 using a 1% or 5% cut-off value [39–44]. We used the latter value for the objective difficulties in the detection of very rare positive neoplastic cells and to avoid overestimating of PD-L1 expression. In addition, like few other studies [39–41], we evaluated PD-L1 not only in neoplastic cells but also in immune cells.
We found 25% of cases with PD-L1 positive in NCs and 78% in IICs. Our positivity rate is higher than that described in other studies using the same MAb E1L3N and the same 5% cut-off [11, 39, 42, 43]. Our results can be due to several factors. We carried out the immunohistochemical detection on whole section of tissue versus most of the studies carried on tissue microarrays (TMA). The limited amount of TMA tissue could underestimate focal expression of PD-L1. Indeed in most our samples there was a focal PD-L1 positivity in NCs (Figure 1). In addition, unlike Kim et al. [39], we evaluated the membranous positive staining regardless intensity, including the cases with weak but clear immunohistochemical staining. We think that the peculiar membrane stain (Figure 2) compared to the absence of PD-L1 expression is sufficient to categorize as positive also specimens with weak intensity of staining. Furthermore, to enrolling our cohort, in addition to MSI we selected 11 medullary carcinoma samples of which 10 resulted positive to PD-L1, helping to increase the rate of positivity.
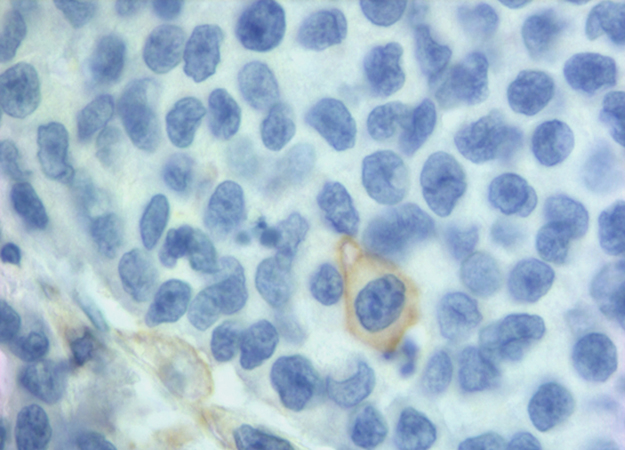
Figure 2: A clear membranous IHC expression of PD-L1 in a single neoplastic cell.
Thus, in agreement with the literature [11, 39, 42, 43, 45], we found that the expression of PD-L1 on NCs is significantly associated with older age, right sided location, medullary histology, G3 tumor grade, BRAF mutation, and MSI status (Table 2). In addition we also found an association between PD-L1 expression in NCs with the sporadic TANs.
On the contrary, PD-L1 expression in IICs is significantly associated with right sided location (p = 0.005), moderate/marked IICs (p < 0.001), and MSI (p = 0.03) (Table 2).
Our results have clearly shown that there is no positivity of PD-L1 in NCs without positivity in IICs. These data allows to outline three types of tumors: tumor PD-L1 negative both in NCs and in IICs (group A), tumors PD-L1 positive only in IICs (group B), tumors PD-L1 positive both in NCs and IICs (group C). The association between the three groups and the variables in observation are shown in Table 3.
Many cells with immune functions populate the tumor microenvironment: T cells, B cells, NK cells, macrophages, neutrophils, dendritic cells. This heterogeneous population, together with stromal cells such as fibroblasts and endothelial cells, contribute to forming an activated immune system against the cancer. The crosstalk between these different cellular populations exploits cytokines and other molecules that interact with other cells in the microenvironment. Unfortunately the complex of mechanisms that regulate the antitumor response of the immune system is yet to be completely elucidated.
In CRC, especially MSI ones, it is believed that the neo-epitopes burden produced by a large number of mutation induces a T-cell mediated immune-response with three possible sequential scenarios. In a first phase (elimination phase), the stimulated immune system produced many costimulating cytokines (TNFα, IL1, IFNα, TLR, ICAM1, IL2, IL12, IFNγ,) and less inhibitors (IL10, IL4, IL13, PD1/PD-L1, prostaglandins, LAG-3, TGFβ) resulting in efficient tumor cell killing. Subsequently, an equilibrium phase takes over, in which cancer cells activate biochemical pathways inducing a dynamic state of immune tolerance. The third phase (escape phase) begins when cancer cells become capable of binding and activating the co-inhibitory molecules on the T lymphocytes (CTLA-4, PD-1, LAG-3, TIM-3), and secreting soluble immunosuppressive or inducing the secretion of mediators such as IDO, TGFβ, IL10. The final result is the blockade of the immune system and the cancer survival [2].
In addition to T-mediated mechanism, another line of defense against cancers are neutrophil granulocytes, the most abundant leukocytes. Recent studies have shown the independent unfavorable prognostic role in several humans tumor [46–50] including CRC [51].
Shaul et al. [52], in a murine model, have shown that TANs has two different patterns of expression against tumor. The first pattern (N1) has an antitumorigenic phenotype, the second (N2) has a protumorigenic phenotype, working with opposite regulatory balancing, probably TGFβ and IFNβ mediated. High levels of TGFβ and low levels of IFNβ would elicit the protumorigenic phenotype of TANs. In addition, it has been shown that TANs isolated in early stage tumours would be more cytotoxic than those isolated in advanced tumors. So the transition from N1 to N2 phenotype would occur during tumor progression. In N1 phenotype TANs express high levels of proinflammatory cytokines and chemoattractive substances for macrophages and T cells. On the contrary, TANs with N2 phenotype secrete CCL-17 with consequent recruitment of CD4 Treg displaying protumour activity. Indeed depletion of neutrophils reduces the CD4 Treg chemoattractive effect [53].
Therefore, a delicate and still not fully known crosstalk mechanism seem to play a fundamental role in determining the density and function of immune population involved in the tumor microenvironment.
The data of this small retrospective study on a CRC cohort with and without microsatellite instability clearly demonstrate that the type and density of inflammatory cells populating the tumor microenvironment together with PD-L1 expression identify three different tumor groups (A, B, C).
Group A, maybe due to neo-antigen scarcity, shows a poor IICs-mediated immune response and a strong granulocytes-mediated immune response. It would then be formed by very little immunogenic CRCs, so that the lymphocyte response is absent/mild and on the contrary it is massive the granulocytic one. In fact to the group A belongs prevalent MSS CRCs and not PD-L1 expressing (both in NCs and IICs) tumors.
Group B, maybe due to the presence of more neo-antigens, has a strong IICs-mediated immune response, with or without granulocyte participating and the positivity of IICs to PD-L1 is probably linked to the perfect and vigorous functioning of the immune response that elicits self-control mechanisms. To this group belong a prevalence of MSS CRCs. In addition, Housseau et al. [54] suggest that in MSS CRCs the nature more than the number of intratumor mutations may drive immunogenicity. This could explain the immunogenic features of some MSS CRC belonging to B group.
Group C, often shows a moderated/marked component of IICs with sporadic TANs. In this group there is probably a remarkable neo-antigens production with an equally remarkable T-cell immuno-mediated response counterbalanced by checkpoint inhibitor signaling, e.g. PD-L1, on both IICs and NCs, that would guarantee tumor tolerance and favor tumor progression. Indeed in group C there is an high percentage of MSI and medullary carcinomas, probably the subset of these tumors with unfavorable prognosis.
If this theoretical setting is true, you might suggest that therapy with immune checkpoint inhibitors is useless in group A because another type of response works, while it might be strongly recommended in group C where the immunological response could be exhausted.
Group B is less clearly outlined. It is generally conspicuous both the IICs and the TANs. Although the biologic significance of this distinct pattern of PD-L1 expression is currently not clear, it likely reflects the combined effect of innate and adaptive cellular and soluble factors that shape the tumor microenvironment [44]. In addition, the presence of a significant TANs infiltrate indicates that the response of the entire immune system is likely to be more complex and involves several actors with different roles.
In conclusion our study shows that: it is important the comprehensive assessment of PD-L1 expression both in NCs and IICs; PD-L1 on NCs may have heterogeneous and focal expression; in agreement with other published data in CRCs the PD-L1 expression on NCs associates with right sided tumors and high grade, medullary histological type, MSI status, marked IICs; the granulocyte infiltration also contributes to separating CRCs with different immune microenvironments; the combination of density and type of inflammatory cells together with the expression of PD-L1 on NCs and IICs defines three tumor groups variously associated to MSI status, medullary histology and other clinicopathological features; theoretically the group A (high TANs, low IICs, PD-L1 negative) would not benefit from anti-PD-L1 therapy otherwise the third group (low TANs, high IICs, both IICs and NCs PD-L1 expressing) would be the ideal candidate for this type of therapy; further studies are needed to validate these hypotheses and to check within the group B (high TANs and IICs, PD-L1 expressing exclusively on IICs ) other predictive features able to select candidate patients for the blockade immunotherapy.
MATERIALS AND METHODS
Patients and tumor characteristics
This study encompasses 63 formalin-fixed paraffin-embedded colorectal carcinoma specimens from 61 patients (31 males and 30 females) underwent surgical resection (between the years of 2010 and 2016) at our National Institute of Gastroenterology.
For selection, we have reviewed written pathology reports searching for keywords “adeno”, and “medullary” and in addition, within these histological types, we have selected those carcinomas with known MSS or MSI status. All the tumors had been surgically resected in a single surgery unit of our Institute and underwent pathological and molecular testing in our molecular pathology laboratory.
Therefore, we collected 37 MSS (33 adenocarcinomas and 4 medullary), 26 MSI-H (19 adenocarcinomas and 7 medullary) CRCs. All MSI were sporadic CRCs.
The same paraffin block on which molecular assays had been performed was chosen. Hematoxylin and eosin-stained sections of all formalin-fixed paraffin-embedded blocks were reviewed by a pathologist (MP) to confirm the presence of adequate tumor tissue and to evaluate tumor grade, pN status, pattern of advancing border, tumor budding, TANs, and IICs encompassing intra and peritumoral lymphocytes, macrophages, plasma cells. The IICs were evaluated as absent/mild when few cells were highlighted within the tumor and/or at the tumor-stroma interface, moderate/marked when the infiltrate was of greater density with the tendency to flow into plagues and infiltrate neoplastic epithelium. We evaluated TANs at the tumor-stroma interface and graduated as sporadic (Supplementary Figure 1) when only a few and spread granulocytes were present and massive when they were much more abundant and confluent into stromal or intraglandular abscesses (Figure 3). The study was approved by the institutional review board.
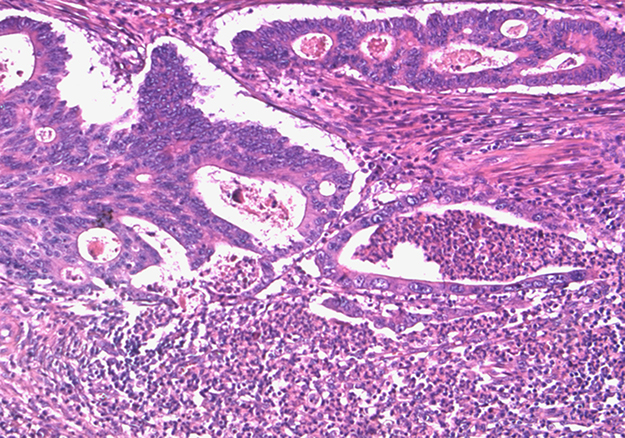
Figure 3: Massive TANs infiltration at tumoral edge with abscessual features.
Immunohistochemistry
Immunohistochemistry (IHC) analysis was carried out in sections (4 micron thick) mounted on positively charged slides and dewaxed in an oven for 20’ at 60°C followed by two serial xylene dippings. Sections were then rehydrated in grades alcohols and incubated in 3% hydrogen peroxide for 10’ to block endogenous peroxidase activity. Sections were retrieved in EDTA buffer (pH 8) at 98°C for 30′. For PD-L1 IHC, has been used a monoclonal antibody against cytoplasmic domain of PD-L1 (clone E1L3N, dilution 1:800; Cell Signaling Technology, Danvers, MA, USA), on an automated autostainer (Dako, Glostrup, Denmark). The dilution factor of this antibody and target retrieval buffer were optimized by using tonsil and placental tissues as positive control.
Dako Real ENVISION (Dako, Glostrup, Denmark) was used as visualization reagent and the 3,3’-DAB as chromogen, according to the manufacturer´s instructions.
Human placenta was included as positive control on each staining run. Negative rabbit IgG controls were used and did not show any staining.
PD-L1 immunoreactivity was evaluated separately for NCs and IICs. PD-L1 positivity was defined as PD-L1 expression on ≥ 5% of membranous positive cell staining of any intensity. Cytoplasmic staining was not considered in this study. The immunostains were independently evaluated by two pathologists (MLC, MP). For discordant cases, the results were confirmed by discussion of the two pathologists.
CD3 (Polyclonal antibody, dilution 1:200; Dako, Glostrup, Denmark) and CD68 (clone KP1, dilution 1:1000; Dako, Glostrup, Denmark) immunostains were performed on each specimen by using the same protocol of PD-L1, except antigen retrieval that was carried out in 10mM Citrate buffer (pH 6). The CD3 and the CD68 stains were used to better interpret the topographical distribution and the composition of PD-L1 expressing immune infiltrate (Supplementary Figure 2).
KRAS, NRAS, and BRAF Mutation analysis
The protocols were performed according to the manufacturer’s instructions. Two sections (10 micron thick) of FFPE tissue were used for DNA extraction using the QIAamp DNA FFPE Tissue Kit (Qiagen, Hilden, Germany). As a first step we evaluated, by pyrosequencing (Pyromark Q24, Qiagen, Hilden, Germany), the status of KRAS codons 12, 13 of all specimens enrolled in this study. Later, on 12/13 wild type samples, it was performed RAS extension (KRAS codons 59, 61, 117, 146 and NRAS codons 12, 13, 59, 61,117, 146) and BRAF (V600E) analysis [55]. Briefly, 50 ng of genomic DNA combined with codon-specific primers were used for the initial 25 μL PCR reaction volume. After PCR, 10 μL of the amplicons were immobilized on streptavidin-coated beads and denatured to produce single-stranded products. Single-stranded DNA was prepared and the corresponding sequencing primers were allowed to anneal to the DNA. Sequence analysis was performed using PyroMark Q24 software in the AQ (allele quantification) analysis mode. The quality thresholds for the mutational analysis were a required peak height of 30 relative units for “passed” quality and 10 relative units for “check” quality. A negative control (without DNA) and a wild type control were run with each series of samples.
Samples with a reported potential low-level mutation were considered positive for the mutation, if confirmed by re-running in duplicate with wild type DNA control.
MSI testing
MSI testing was performed on paraffin-embedded tumor tissue using a PCR-based assay with five National Cancer Institute recommended markers (BAT25, BAT 26, D5S346, D17S250, and D2S123) [56, 57].
MSI testing required DNA from both normal and tumor tissue for each patient. PCR amplification was performed in a total reaction volume of 20 μl, containing 100 μM dNTPs, 0.5 μM each primer, 0.25 U of Taq Polymerase Platinum, 1.5 mM MgCl2 and 200 ng DNA. PCR cycling conditions were: denaturation at 95° for 5 minutes, followed by 30 cycles of 95°C for 30 seconds, 55°C for 30 seconds, 72°C for 30 seconds, and a final elongation at 72°C for 5 minutes. The PCR products were controlled on 1.5% agarose gel and were separated on a vertical denaturing 6M Urea polyacrilamide gel (acrylamide/bis-acrylamide 19:1). Polyacrilamide gel was stained with Silver Nitrate. On the basis of the MSI status, CRCs can be classified into three groups: MSI-Low if only one of the five microsatellite markers shows instability, MSI-High if two or more of the five microsatellite markers show instability and MSS if none of the markers shows instability [56, 57].
Statistical analysis
Means and standard deviations (M ± SD) for continuous variables, and relative frequency (%) for categorical variables, were used as indices of centrality and dispersion of the distribution.
Chi-square test or Fisher exact test, depending on the number of observations, for categorical variables, Kruskal-Wallis rank test and Wilcoxon rank-sum test (Mann-Whitney test) for continuous variables were used to test differences among the groups. In the logistic regression models the absence of PD-L1 expression was considered as a reference category.
All models were adjusted for gender and age. Results were presented as Odds-Ratio (OR) and with 95% Confidence Intervals (C.I.). The Odds-Ratio represents the risk for one-unit variation of the predictor variable. When testing the hypothesis of significant association, p-value was < 0.05, two tailed for all analysis. All statistical computations used STATA 10.0 Statistical Software, (StataCorp), College Station, TX, USA.
CONFLICTS OF INTEREST
None.
REFERENCES
1. Tariq K, Ghias K. Colorectal cancer carcinogenesis: a review of mechanisms. Cancer Biol Med. 2016; 13:120–135. https://doi.org/10.28092/j.issn.2095-3941.2015.0103.
2. Rabinovich GA, Gabrilovich D, Sotomayor E. Immunosuppressive strategies that are mediated by tumor cells. Annu Rev Immunol. 2007; 25:267–296. https://doi.org/10.1146/annurev.immunol.25.022106.141609.
3. Jass JR, Do KA, Simms LA, Iino H, Wynter C, Pillay SP, Searle J, Radford-Smith G, Young J, Leggett B. Morphology of sporadic colorectal cancer with DNA replication errors. Gut. 1998; 42:673–679.
4. Kwak Y, Koh J, Kim DW, Kang SB, Kim WH, Lee HS. Immunoscore encompassing CD3+ and CD8+ T cell densities in distant metastasis is a robust prognostic marker for advanced colorectal cancer. Oncotarget. 2016; 7:81778–90. https://doi.org/10.18632/oncotarget.13207.
5. Lynch D, Murphy A. The emerging role of immunotherapy in colorectal cancer. Ann Transl Med. 2016; 4:305. doi:10.21037/atm.2016.08.29.
6. Nishimura H, Honjo T. PD-1: an inhibitory immunoreceptor involved in peripheral tolerance. Trends Immunol. 2001; 22:265–268.
7. Boussiotis VA. Molecular and biochemical aspects of the PD-1 checkpoint pathway. N Engl J Med. 2016; 375:1767–1778. https://doi.org/10.1056/NEJMra1514296.
8. Passardi A, Canale M, Valgiusti M, Ulivi P. Immune checkpoints as a target for colorectal cancer treatment. Int J Mol Sci. 2017; 18:E1324. https://doi.org/10.3390/ijms18061324.
9. Fanoni D, Tavecchio S, Recalcati S, Balice Y, Venegoni L, Fiorani R, Crosti C, Berti E. New monoclonal antibodies against B-cell antigens: possible new strategies for diagnosis of primary cutaneous B-cell lymphomas. Immunol Lett. 2011; 134:157–160. https://doi.org/10.1016/j.imlet.2010.09.022.
10. Terme M, Ullrich E, Aymeric L, Meinhardt K, Desbois M, Delahaye N, Viaud S, Ryffel B, Yagita H, Kaplanski G, Prévost-Blondel A, Kato M, Schultze JL, et al. IL-18 induces PD-1-dependent immunosuppression in cancer. Cancer Res. 2011; 71:5393–5399. https://doi.org/10.1158/0008-5472.CAN-11-0993.
11. Inaguma S, Lasota J, Wang Z, Felisiak-Golabek A, Ikeda H, Miettinen M. Clinicopathologic profile, immunophenotype, and genotype of CD274 (PD-L1)-positive colorectal carcinomas. Mod Pathol. 2017; 30:278–285. https://doi.org/10.1038/modpathol.2016.185.
12. Okazaki T, Honjo T. The PD-1-PD-L pathway in immunological tolerance. Trends Immunol. 2006; 27:195–201. https://doi.org/10.1016/j.it.2006.02.001.
13. Keir ME, Liang SC, Guleria I, Latchman YE, Qipo A, Albacker LA, Koulmanda M, Freeman GJ, Sayegh MH, Sharpe AH. Tissue expression of PD-L1 mediates peripheral T cell tolerance. J Exp Med. 2006; 203:883–895. https://doi.org/10.1084/jem.20051776.
14. Keir ME, Butte MJ, Freeman GJ, Sharpe AH. PD-1 and its ligands in tolerance and immunity. Annu Rev Immunol. 2008; 26:677–704. https://doi.org/10.1146/annurev.immunol.26.021607.090331.
15. Hino R, Kabashima K, Kato Y, Yagi H, Nakamura M, Honjo T, Okazaki T, Tokura Y. Tumor cell expression of programmed cell death-1 ligand 1 is a prognostic factor for malignant melanoma. Cancer. 2010; 116:1757–1766. https://doi.org/10.1002/cncr.24899.
16. Wu P, Wu D, Li L, Chai Y, Huang J. PD-L1 and survival in solid tumors: a meta-analysis. PLoS One. 2015; 10:e0131403. https://doi.org/10.1371/journal.pone.0131403.
17. Cavalcanti E, Armentano R, Valentini AM, Chieppa M, Caruso ML. Role of PD-L1 expression as a biomarker for GEP neuroendocrine neoplasm grading. Cell Death Dis. 2017; 8:e3004. https://doi.org/10.1038/cddis.2017.401.
18. Droeser RA, Hirt C, Viehl CT, Frey DM, Nebiker C, Huber X, Zlobec I, Eppenberger-Castori S, Tzankov A, Rosso R, Zuber M, Muraro MG, Amicarella F, et al. Clinical impact of programmed cell death ligand 1 expression in colorectal cancer. Eur J Cancer. 2013; 49:2233–2242. https://doi.org/10.1016/j.ejca.2013.02.015.
19. Song M, Chen D, Lu B, Wang C, Zhang J, Huang L, Wang X, Timmons CL, Hu J, Liu B, Wu X, Wang L, Wang J, Liu H. PTEN loss increases PD-L1 protein expression and affects the correlation between PD-L1 expression and clinical parameters in colorectal cancer. PLoS One. 2013; 8:e65821. https://doi.org/10.1371/journal.pone.0065821.
20. Andrews MC, Wargo JA. Immunotherapy resistance: the answers lie ahead - not in front - of us. J Immunother Cancer. 2017; 5:10. https://doi.org/10.1186/s40425-017-0212-y.
21. Pardoll DM. The blockade of immune checkpoints in cancer immunotherapy. Nat Rev Cancer. 2012; 12:252–264. https://doi.org/10.1038/nrc3239.
22. Herbst RS, Soria JC, Kowanetz M, Fine GD, Hamid O, Gordon MS, Sosman JA, McDermott DF, Powderly JD, Gettinger SN, Kohrt HEK, Horn L, Lawrence DP, et al. Predictive correlates of response to the anti-PD-L1 antibody MPDL3280A in cancer patients. Nature. 2014; 515:563–567. doi:10.1038/nature14011.
23. Bupathi M, Wu C. Biomarkers for immune therapy in colorectal cancer: mismatch-repair deficiency and others. J Gastrointest Oncol. 2016; 7:713–720. https://doi.org/10.21037/jgo.2016.07.03.
24. Le DT, Uram JN, Wang H, Bartlett BR, Kemberling H, Eyring AD, Skora AD, Luber BS, Azad NS, Laheru D, Biedrzycki B, Donehower RC, Zaheer A, et al. PD-1 blockade in tumors with mismatch-repair deficiency. N Engl J Med. 2015; 372:2509–2520. https://doi.org/10.1056/NEJMoa1500596.
25. Williams DS, Bird MJ, Jorissen RN, Yu YL, Walker F, Zhang HH, Nice EC, Burgess AW. Nonsense mediated decay resistant mutations are a source of expressed mutant proteins in colon cancer cell lines with microsatellite instability. PLoS One. 2010; 5:e16012. https://doi.org/10.1371/annotation/53805ecf-7d10-4d99-9cec-f27f5e0d4166.
26. Mlecnik B, Bindea G, Angell HK, Maby P, Angelova M, Tougeron D, Church SE, Lafontaine L, Fischer M, Fredriksen T, Sasso M, Bilocq AM, Kirilovsky A, et al. Integrative analyses of colorectal cancer show immunoscore is a stronger predictor of patient survival than microsatellite instability. Immunity. 2016; 44:698–711. https://doi.org/10.1016/j.immuni.2016.02.025.
27. Llosa NJ, Cruise M, Tam A, Wicks EC, Hechenbleikner EM, Taube JM, Blosser RL, Fan H, Wang H, Luber BS, Zhang M, Papadopoulos N, Kinzler KW, et al. The vigorous immune microenvironment of microsatellite instable colon cancer is balanced by multiple counter-inhibitory checkpoints. Cancer Discov. 2015; 5:43–51. doi:10.1158/2159-8290.CD-14-0863.
28. Dudley JC, Lin MT, Le DT, Eshleman JR. Microsatellite instability as a biomarker for PD-1 blockade. Clin Cancer Res. 2016; 22:813–820. https://doi.org/10.1158/1078-0432.CCR-15-1678.
29. Overman MJ, McDermott R, Leach JL, Lonardi S, Lenz HJ, Morse MA, Desai J, Hill A, Axelson M, Moss RA, Goldberg MV, Cao ZA, Ledeine JM, et al. Nivolumab in patients with metastatic DNA mismatch repair-deficient or microsatellite instability-high colorectal cancer (CheckMate 142): an open-label, multicentre, phase 2 study. Lancet Oncol. 2017; 18:1182–1191. https://doi.org/10.1016/S1470-2045(17)30422-9.
30. Ohaegbulam KC, Assal A, Lazar-Molnar E, Yao Y, Zang X. Human cancer immunotherapy with antibodies to the PD-1 and PD-L1 pathway. Trends Mol Med. 2015; 21:24–33. https://doi.org/10.1016/j.molmed.2014.10.009.
31. Spigel DR, Gettinger SN, Horn L, Herbst RS, Gandhi L, Gordon MS, Cruz C, Conkling P, Cassier PA, Antonia SJ, Burris HA, Fine GD, Mokatrin A, et al. Clinical activity, safety, and biomarkers of MPDL3280A, an engineered PD-L1 antibody in patients with locally advanced or metastatic non-small cell lung cancer (NSCLC). J Clin Oncol. 2013; 31:15 suppl, 8008–8008.
32. Lanza G, Gafà R, Matteuzzi M, Santini A. Medullary-type poorly differentiated adenocarcinoma of the large bowel: a distinct clinicopathologic entity characterized by microsatellite instability and improved survival. J Clin Oncol. 1999; 17:2429–2438.
33. Venderbosch S, Nagtegaal ID, Maughan TS, Smith CG, Cheadle JP, Fisher D, Kaplan R, Quirke P, Seymour MT, Richman SD, Meijer GA, Ylstra B, Heideman DA, et al. Mismatch repair status and BRAF mutation status in metastatic colorectal cancer patients: a pooled analysis of the CAIRO, CAIRO2, COIN, and FOCUS studies. Clin Cancer Res. 2014; 20:5322–5330. https://doi.org/10.1158/1078-0432.CCR-14-0332.
34. Taube JM, Anders RA, Young GD, Xu H, Sharma R, McMiller TL, Chen S, Klein AP, Pardoll DM, Topalian SL, Chen L. Colocalization of inflammatory response with B7-h1 expression in human melanocytic lesions supports an adaptive resistance mechanism of immune escape. Sci Transl Med. 2012; 4:127ra37. https://doi.org/10.1126/scitranslmed.3003689.
35. Thompson RH, Gillett MD, Cheville JC, Lohse CM, Dong H, Webster WS, Krejci KG, Lobo JR, Sengupta S, Chen L, Zincke H, Blute ML, Strome SE, et al. Costimulatory B7-H1 in renal cell carcinoma patients: indicator of tumor aggressiveness and potential therapeutic target. Proc Natl Acad Sci U S A. 2004; 101:17174–17179. https://doi.org/10.1073/pnas.0406351101.
36. Hamanishi J, Mandai M, Iwasaki M, Okazaki T, Tanaka Y, Yamaguchi K, Higuchi T, Yagi H, Takakura K, Minato N, Honjo T, Fujii S. Programmed cell death 1 ligand 1 and tumor-infiltrating CD8+ T lymphocytes are prognostic factors of human ovarian cancer. Proc Natl Acad Sci U S A. 2007;104:3360–3365. https://doi.org/10.1073/pnas.0611533104.
37. Ohigashi Y, Sho M, Yamada Y, Tsurui Y, Hamada K, Ikeda N, Mizuno T, Yoriki R, Kashizuka H, Yane K, Tsushima F, Otsuki N, Yagita H, et al. Clinical significance of programmed death-1 ligand-1 and programmed death-1 ligand-2 expression in human esophageal cancer. Clin Cancer Res. 2005; 11:2947–2953. https://doi.org/10.1158/1078-0432.CCR-04-1469.
38. Wu C, Zhu Y, Jiang J, Zhao J, Zhang XG, Xu N. Immunohistochemical localization of programmed death-1 ligand-1 (PD-L1) in gastric carcinoma and its clinical significance. Acta Histochem. 2006;108:19–24. https://doi.org/10.1016/j.acthis.2006.01.003.
39. Kim JH, Park HE, Cho NY, Lee HS, Kang GH. Characterisation of PD-L1 positive subsets of microsatellite-unstable colorectal cancers. Br J Cancer. 2016; 115:490–496. https://doi.org/10.1038/bjc.2016.211.
40. Taube JM, Klein A, Brahmer JR, Xu H, Pan X, Kim JH, Chen L, Pardoll DM, Topalian SL, Anders RA. Association of PD-1, PD-1 ligands, and other features of the tumor immune microenvironment with response to anti-PD-1 therapy. Clin Cancer Res. 2014; 20:5064–5074. https://doi.org/10.1158/1078-0432.CCR-13-3271.
41. El Jabbour T, Ross JS, Sheehan CE, Affolter KE, Geiersbach KB, Boguniewicz A, Ainechi S, Bronner MP, Jones DM, Lee H. PD-L1 protein expression in tumour cells and immune cells in mismatch repair protein-deficient and -proficient colorectal cancer: the foundation study using the SP142 antibody and whole section immunohistochemistry. J Clin Pathol. 2018; 71:46–51. https://doi.org/10.1136/jclinpath-2017-204525.
42. Lee LH, Cavalcanti MS, Segal NH, Hechtman JF, Weiser MR, Smith JJ, Garcia-Aguilar J, Sadot E, Ntiamoah P, Markowitz AJ, Shike M, Stadler ZK, Vakiani E, et al. Patterns and prognostic relevance of PD-1 and PD-L1 expression in colorectal carcinoma. Mod Pathol. 2016; 29:1433–1442. https://doi.org/10.1038/modpathol.2016.139.
43. Rosenbaum MW, Bledsoe JR, Morales-Oyarvide V, Huynh TG, Mino-Kenudson M. PD-L1 expression in colorectal cancer is associated with microsatellite instability, BRAF mutation, medullary morphology and cytotoxic tumor-infiltrating lymphocytes. Mod Pathol. 2016; 29:1104–1112. https://doi.org/10.1038/modpathol.2016.95.
44. Scognamiglio G, De Chiara A, Di Bonito M, Tatangelo F, Losito NS, Anniciello A, De Cecio R, D’Alterio C, Scala S, Cantile M, Botti G. Variability in Immunohistochemical Detection of Programmed Death Ligand 1 (PD-L1) in Cancer Tissue Types. Int J Mol Sci. 2016; 17:E790. https://doi.org/10.3390/ijms17050790.
45. Friedman K, Brodsky AS, Lu S, Wood S, Gill AJ, Lombardo K, Yang D, Resnick MB. Medullary carcinoma of the colon: a distinct morphology reveals a distinctive immunoregulatory microenvironment. Mod Pathol. 2016; 29:528–541. https://doi.org/10.1038/modpathol.2016.54.
46. Donskov F, von der Maase H. Impact of immune parameters on long-term survival in metastatic renal cell carcinoma. J Clin Oncol. 2006; 24:1997–2005. https://doi.org/10.1200/JCO.2005.03.9594.
47. Jensen HK, Donskov F, Marcussen N, Nordsmark M, Lundbeck F, von der Maase H. Presence of intratumoral neutrophils is an independent prognostic factor in localized renal cell carcinoma. J Clin Oncol. 2009; 27:4709–4717. https://doi.org/10.1200/JCO.2008.18.9498.
48. Jensen TO, Schmidt H, Møller HJ, Donskov F, Høyer M, Sjoegren P, Christensen IJ, Steiniche T. Intratumoral neutrophils and plasmacytoid dendritic cells indicate poor prognosis and are associated with pSTAT3 expression in AJCC stage I/II melanoma. Cancer. 2012; 118:2476–2485. https://doi.org/10.1002/cncr.26511.
49. Li YW, Qiu SJ, Fan J, Zhou J, Gao Q, Xiao YS, Xu YF. Intratumoral neutrophils: a poor prognostic factor for hepatocellular carcinoma following resection. J Hepatol. 2011; 54:497–505. https://doi.org/10.1016/j.jhep.2010.07.044.
50. Gu FM, Gao Q, Shi GM, Zhang X, Wang J, Jiang JH, Wang XY, Shi YH, Ding ZB, Fan J, Zhou J. Intratumoral IL-17+ cells and neutrophils show strong prognostic significance in intrahepatic cholangiocarcinoma. Ann Surg Oncol. 2012;19:2506–2514. https://doi.org/10.1245/s10434-012-2268-8.
51. Rao HL, Chen JW, Li M, Xiao YB, Fu J, Zeng YX, Cai MY, Xie D. Increased intratumoral neutrophil in colorectal carcinomas correlates closely with malignant phenotype and predicts patients’ adverse prognosis. Plos One. 2012; 7:e30806. https://doi.org/10.1371/journal.pone.0030806.
52. Shaul ME, Fridlender ZG. Neutrophils as active regulators of the immune system in the tumor microenvironment. J Leukoc Biol. 2017; 102:343–349. https://doi.org/10.1189/jlb.5MR1216-508R.
53. Mishalian I, Bayuh R, Eruslanov E, Michaeli J, Levy L, Zolotarov L, Singhal S, Albelda SM, Granot Z, Fridlender ZG. Neutrophils recruit regulatory T-cells into tumors via secretion of CCL17--a new mechanism of impaired antitumor immunity. Int J Cancer. 2014; 135:1178–1186. https://doi.org/10.1002/ijc.28770.
54. Housseau F, Llosa NJ. Immune checkpoint blockade in microsatellite instable colorectal cancers: Back to the clinic. Oncoimmunology. 2015; 4:e1008858. https://doi.org/10.1080/2162402X.2015.1008858.
55. Valentini AM, Cavalcanti E, Di Maggio M, Caruso ML. RAS-expanded mutations and HER2 expression in metastatic colorectal cancer: a new step of precision medicine. Appl Immunohistochem Mol Morphol. https://doi.org/10.1097/PAI.0000000000000475.
56. Buhard O, Cattaneo F, Wong YF, Yim SF, Friedman E, Flejou JF, Duval A, Hamelin R. Multipopulation analysis of polymorphisms in five mononucleotide repeats used to determine the microsatellite instability status of human tumors. J Clin Oncol. 2006; 24:241–51. https://doi.org/10.1200/JCO.2005.02.7227.
57. Boland CR, Thibodeau SN, Hamilton SR, Sidransky D, Eshleman JR, Burt RW, Meltzer SJ, Rodriguez-Bigas MA, Fodde R, Ranzani GN, Srivastava S. A National Cancer Institute Workshop on Microsatellite Instability for cancer detection and familial predisposition: development of international criteria for the determination of microsatellite instability in colorectal cancer. Cancer Res. 1998; 58:5248–5257.