
INTRODUCTION
MicroRNA is a group of 19–22 nucleotide, small, single-stranded and conserved non-coding RNA that acts as a regulator of gene expression at both the post-transcriptional and the translational levels through acting on the 3’-untranslated region (UTR) of messenger RNA (mRNA) [1]. MicroRNAs involve in various biological processes associated with the tumorigenesis such as the cellular proliferation, differentiation, metabolism as well as apoptosis [2, 3]. It is available to isolate the microRNAs from the clinical specimens including the plasma, serum, sputum and tissue. Meanwhile, it has a high stability. Due to these advantages, the microRNAs are increasingly becoming an ideal tool for the detection of human cancer.
Aberrant expression of miR-486 (miR-486-5p) has been reported to be associated with different types of human cancer such as hepatocellular carcinoma (HCC) [4, 5], lung cancer [6], breast cancer [7], esophageal squamous cell carcinoma (ESCC) [8] and pancreatic cancer (PC) [9, 10]. It can act as both the tumor suppressor and oncogene to participant in the development and progression of tumors. The down-regulation of miR-486 can promote the progression of lung cancer [6], HCC [4, 5], breast cancer [7] and osteosarcoma [11], while it is usually up-regulated in PC [9, 10], chronic myeloid leukemia [12] and gliomas [13]. Recently, a series of articles have identified that miR-486 might be applied as a biomarker for cancer detection and prognosis. However, as a result of the small sample sizes, different microRNA profiling and the differences of the specimen and ethnicity, many articles showed conflicting conclusions and no meta-analysis was conducted to explore the association between miR-486 and diagnosis as well as the prognosis of human cancer. Therefore, this meta-analysis was performed to assess the performance of miR-486 in the detection and prognosis for human cancer.
RESULTS
Literature search and the studies’ characteristics
As described in Figure 1A, based on the primary literature research, 402 eligible articles were included, of which 368 articles were removed as duplicate and unrelated articles. And then 7 reviews and 3 articles about miR-486-3p were also excluded, leaving 24 articles with full texts. After carefully reading, another 3 articles were then removed: 1 article without complete data and 2 articles with the same population with other articles. Ultimately, 21 articles [14–33] with 29 studies were published from 2010 to 2017. 15 articles [14–28] with 22 studies were about the value of miR-486 for cancer detection while the remaining 6 articles [29–33] with 7 studies were about the cancer prognosis.
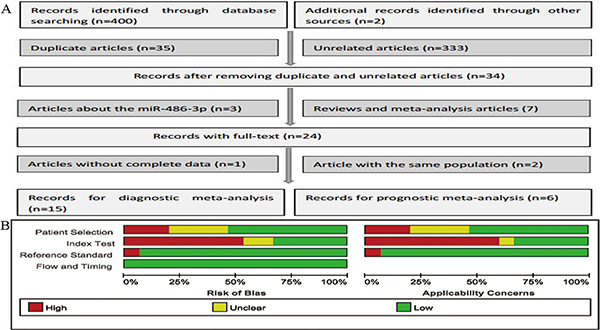
Figure 1: Flow chart of this meta-analysis of miR-486 in cancer detection (A) and the quality of these included articles according to the QUADAS-2 guidelines: proportion of articles with risk of bias (left) and proportion of articles with regarding applicability (right) (B).
Diagnostic meta-analysis
Studies’ characteristics and quality assessment
A total of 15 articles with 22 studies involving in 1315 cases and 1013 controls were analyzed. The main characteristics of the 22 studies were shown in Table 1. Types of cancer included lung cancer, non-small cell lung cancer (NSCLC), gastric cancer (GC), renal cell cancer (RCC) and pancreatic cancer (PC).The quantitative real-time polymerase chain reaction (qRT-PCR) was used in these studies to test the expression level of miR-486, and the most common reference miRNAs used as the endogenous controls for normalization were RNU6B (U6), miR-39 and miR-16. The quality of the included studies turned out to be generally good and was summarized in Figure 1B.
Table 1: The main features of 22 included studies in diagnostic meta-analysis
1:miR-451,miR-1290,miR-636,miR-30c,miR-22-3p,miR-19b,miR-486-5p,miR-20b,miR-93,miR-34b,miR-185,miR-126-5p,miR-93-3p,miR-1274a,miR-142-5p,miR-628-5p,miR-486-3p,miR-425,miR-645,miR-24.
2: let-7a, let-7b, let-7d, miR-103, miR-126, miR-133b, miR-139, miR-140, miR-142, miR-142, miR-148a, miR-148b, miR-17, miR-191, miR-22, miR-223, miR-26a, miR-26b, miR-28, miR-29a, miR-30b, miR-30c, miR-32, miR-328, miR-331, miR-342, miR-374, miR-376a, miR-432, miR-484, miR-486, miR-566, miR-92a and miR-98. 3: miR-197, miR-19b, miR-24, miR-146, miR-15b, miR-19a. Abbreviation: N, number of samples; HC, healthy control; BD, benign disease; SEN, sensitivity; SPE, specificity. NSCLC, non-small cell lung cancer; RCC, renal cell cancer; PC, pancreatic cancer; GC, gastric cancer; LAD, lung adenocarcinoma.
Pooled diagnostic performance
The significant heterogeneity was observed since I2 for SEN and SPE were 62.12% (95% CI: 44.65–79.58%) and 69.43% (95% CI: 56.08–82.78%) respectively. Therefore, we used a random-effect model for this analysis. Results showed that overall pooled SEN and SPE for these 22 studies were 82% (95% CI: 78-85%) and 88% (95% CI: 83–92%) respectively to distinguish patients with cancer from the controls (Figure 2). The positive likelihood ratio (PLR) and negative likelihood ratio (NLR) were 6.9 (95% CI: 4.8–9.7) and 0.21 (95% CI: 0.17–0.26) respectively, and the diagnostic odds ratio (DOR) was 33 (95% CI: 20–55). The summary receiver operating characteristic (SROC) curve was performed and the AUC was 0.91 (95% CI: 0.88–0.93) (Figure 3A).
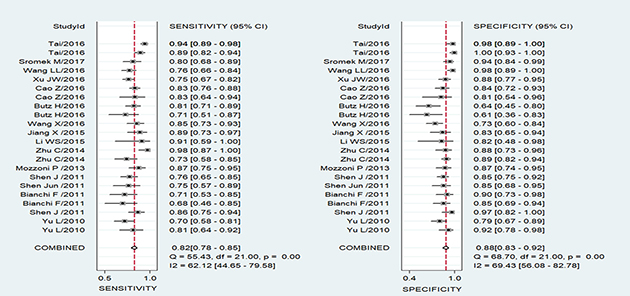
Figure 2: Forest plots of sensitivity and specificity for the cancer diagnosis of miR-486. Both the sensitivity and specificity of each study were showed by square with its 95% Confidence interval showed by the error bars.
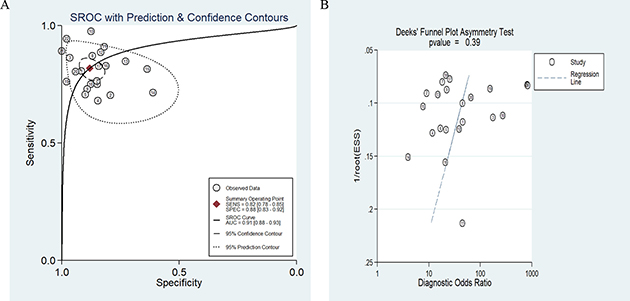
Figure 3: SROC curve of the miR-486 as diagnostic tools for cancer (A) and the Deek’s test for assessing the publication bias for miR-486 in the detection of cancer (B).
Publication bias and sensitivity analysis
In this meta-analysis, Deek’s funnel plot asymmetry test was applied to test the probability of publication bias. The funnel plot was symmetry (Figure 3B) and P value equaled 0.39, which demonstrated the publication bias didn’t exist in these studies. Sensitivity analysis was also conducted but failed to find the sources of heterogeneity.
Subgroup analysis and meta-regression analysis
A multivariate-meta-regression was performed to detect the potential causes of the heterogeneity in both SEN and SPE. The following factors were included: miRs (miR-486 alone or miR-486 with other miRNAs); specimen (circulating or not circulating); ethnicity (Asian, Caucasian or Caucasian/African); control-type (benign disease or healthy controls); stage (early stage or overall stage); cancer-type (lung cancer, gastric cancer, pancreatic cancer and renal cell carcinoma and sample-size (> = 100 or < 100). The results demonstrated that specimen (P < 0.05) might explain the heterogeneity in SPE shown in Figure 4. Meanwhile, the subgroup analyses were also conducted and the results were presented in Table 2. Subgroup analysis by specimen showed that studies with circulating samples exhibited higher diagnostic accuracy with SEN: 81% (95% CI: 78–84%), SPE: 86% (95% CI: 83-89%) and AUC: 0.90 (95% CI: 0.87-0.92) (Figure 5A) than studies with not circulating samples with the SEN: 76% (95% CI: 70–82%), SPE: 76% (95% CI: 62–86%) and AUC: 0.78 (95% CI: 0.75–0.82) (Figure 5B) respectively. In the subgroup of the ethnicity, the miR-486 obtained a better diagnostic value in the Asian population with the SEN: 86% (95% CI: 80–90%), SPE: 90% (95% CI: 84–94%) and AUC: 0.94 (95% CI: 0.91–0.95) (Figure 6A) when Compared with the Caucasian population with the SEN: 79% (95% CI: 74–83%), SPE: 83% (95% CI: 71–91%) and AUC: 0.80 (95% CI: 0.76–0.83) (Figure 6B) and the Caucasian/African population with SEN: 78% (95% CI: 71–84%), SPE: 87% (95% CI: 80–92%) and AUC: 0.89 (95% CI: 0.86–0.91) (Figure 6C) respectively. With respect to the other types of subgroup analysis, there were no significant differences in the diagnostic accuracy of miR-486 and since there were only 3 studies for early stage and 2 studies that we did not obtain the information about the stage, we only conducted the subgroup analysis for the overall stage of human cancer. However, for the subgroup analysis of NSCLC, it obtained a pretty high diagnostic value with the sensitivity, specificity were 82% (95% CI: 77–87%), 90% (95% CI: 84–94%) respectively as well as the AUC was 0.92 (95% CI: 0.89–0.94) (Figure 6D).
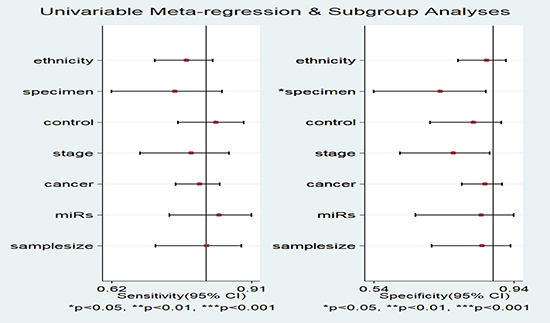
Figure 4: Forest plots for the Meta-regression analysis: sensitivity and specificity. The factors included ethnicity, specimen, control, stage, cancer, miRs and sample size.
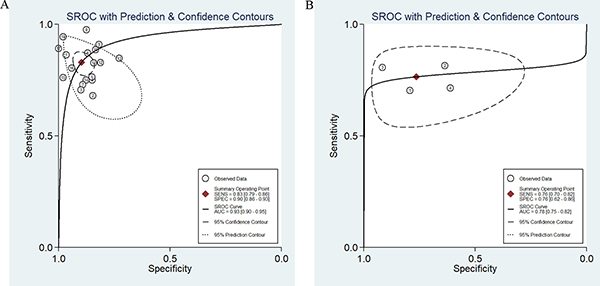
Figure 5: SROC curve of the miR-486 from circulating samples (A) and the other specimen (B).
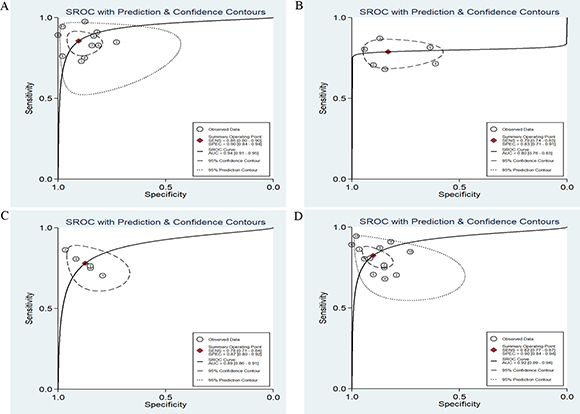
Figure 6: SROC curve of the miR-486 in detection of Asian population (A), Caucasian population (B) and the Caucasian/ African population (C) as well as the SROC curve of miR-486 in the diagnosis of non-small cell lung cancer (D).
Table 2: The subgroup analysis for the selected studies
Subgroups |
No.of studies |
SEN [95% CI] |
SPE [95% CI] |
PLR [95% CI] |
NLR [95% CI]) |
DOR [95% CI]) |
AUC [95% CI] |
|---|---|---|---|---|---|---|---|
MiRNA profiling |
|||||||
single |
4 |
0.78 [0.72–0.83] |
0.90 [0.80–0.95] |
7.6 [3.9–14.6] |
0.24 [0.19–0.32] |
31 [15–64] |
0.84 [0.81–0.87] |
multiple |
18 |
0.83 [0.79–0.86] |
0.90 [0.86–0.93] |
8.0 [5.7–11.4] |
0.19 [0.15–0.24] |
42 [25–70] |
0.93 [0.90–0.95] |
Specimen |
|||||||
circulating |
18 |
0.81 [0.78–0.84] |
0.86 [0.83–0.89] |
6.0 [4.7–7.6] |
0.22 [0.18–0.26] |
28 [20–37] |
0.90 [0.87–0.92] |
not circulating |
4 |
0.76 [0.70–0.82] |
0.76 [0.62–0.86] |
3.2 [1.9–5.4] |
0.31 [0.23–0.41] |
10 [5–21] |
0.78 [0.75–0.82] |
Ethnicity |
|||||||
Asian |
11 |
0.86 [0.80–0.90] |
0.90 [0.84–0.94] |
8.9 [5.1–15.4] |
0.16 [0.11–0.23] |
55 [25–120] |
0.94 [0.91–0.95] |
Caucasian |
6 |
0.79 [0.74–0.83] |
0.83 [0.71–0.91] |
4.7 [2.6–8.3] |
0.25 [0.20–0.33] |
18 [9–39] |
0.80 [0.76–0.83] |
Caucasian/African |
5 |
0.78 [0.71–0.84] |
0.87 [0.80–0.92] |
6.2 [3.7–10.4] |
0.25 [0.18–0.35] |
24 [11–53] |
0.89 [0.86–0.91] |
Control–type |
|||||||
HC |
15 |
0.81 [0.76–0.86] |
0.91 [0.84–0.95] |
8.7 [5.0–15.1] |
0.21 [0.15–0.28] |
42 [19–92] |
0.91 [0.88–0.93] |
BD |
6 |
0.82 [0.78–0.85] |
0.83 [0.77–0.87] |
4.7 [3.6–6.1] |
0.22 [0.18–0.27] |
21 [14–32] |
0.87 [0.84–0.90] |
Cancer type |
|||||||
NSCLC |
13 |
0.82 [0.77–0.87] |
0.90 [0.84–0.94] |
8.4 [5.0–14.1] |
0.20 [0.15–0.26] |
43 [20–92] |
0.92 [0.89–0.94] |
Sample size |
|||||||
> = 100 |
12 |
0.82 [0.77–0.86] |
0.90 [0.82–0.94] |
8.1 [4.4–14.7] |
0.20 [0.15–0.27] |
40 [18–90] |
0.90 [0.87–0.92] |
< 100 |
10 |
0.82 [0.75–0.87] |
0.86 [0.81–0.90] |
5.8 [4.1–8.2] |
0.21 [0.15–0.30] |
28 [15–51] |
0.91 [0.88–0.93] |
Stage |
|||||||
overall stage |
17 |
0.82 [0.78–0.85] |
0.89 [0.85–0.93] |
7.8 [5.2–11.6] |
0.20 [0.16–0.26] |
38 [21–68] |
0.91 [0.88–0.93] |
Overall studies |
22 |
0.82 [0.78–0.85] |
0.88 [0.83–0.92] |
6.9 [4.8–9.7] |
0.21 [0.17–0.26] |
33 [20–55] |
0.91 [0.88–0.93] |
No: the number of the studies; HC, healthy control; BD, benign pulmonary disease; SEN, sensitivity; SPE, specificity; PLR, positive likelihood ratio; NLR, negative likelihood ratio; DOR, Diagnostic Odds Ratio; AUC, area under the curve.
Prognostic meta-analysis
Studies’ characteristics and quality assessment
A total of 761 participants with cancer from 6 articles on 7 studies were included. The main characteristics of the 7 studies were shown in Table 3 Most studies investigated miR-486 by qRT-PCR. The overall survival (OS), progression-free survival (PFS) and relapse free survival (RFS) were used to evaluate the outcome of the cohorts. Types of the cancer included NSCLC, ESCC, GC and HCC. The results of the studies’ quality assessment were also included in Table 3.
Table 3: The main features of 7 included studies in prognostic meta-analysis
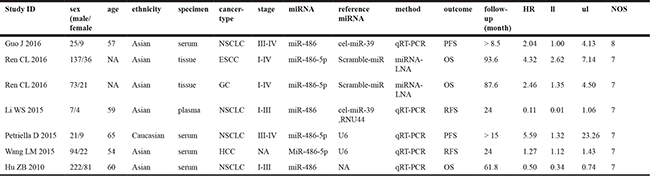
Abbreviation: HR, hazard ratio; ll, lower limit; ul, upper Limit; NOS, Newcastle-Ottawa Scale; NSCLC, non-small cell lung cancer; ESCC, esophageal squamous cell carcinoma; GC, gastric cancer; HCC, hepatocellular carcinoma; OS, overall survival; PFS, progression-free survival; RFS, relapse free survival.
Association between miR-486 and outcomes
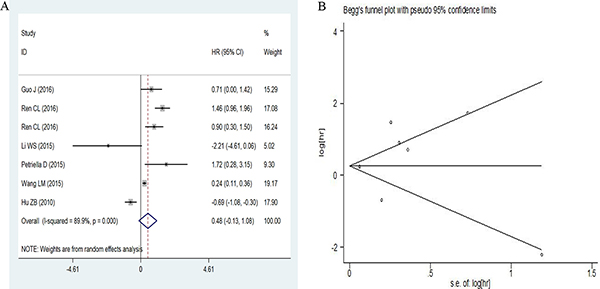
A random-effects model was used since the heterogeneity among studies existed (I2 = 89.9, P = 0.000). The pooled HR (hazard ratio) was 0.48 (95% CI: –0.13–1.08) for low versus high miR-486 expression as shown in Figure 7A. Low miR-486 expression did not increase the risk of poor outcome compared with the high miR-486 expression. And the studies were so few that we did not conduct subgroup analysis for the prognostic meta-analysis.
Figure 7: Forest plots of sensitivity and specificity for miR-486 in cancer prognosis (A) and the Begg’s funnel plot for the sensitivity analysis (B).
Publication bias and sensitivity analysis
Publication bias was checked by Begg’s funnel plot and Egger’s test under the random-effects model (Figure 7B). Although the Begg’s funnel plot seemed asymmetric, the P value of the Egger’s regression intercept was 0.676, indicating that there was no obvious publication bias among these studies. The sensitivity analysis was also conducted but failed to find the sources of heterogeneity.
DISCUSSION
Cancer biomarkers are critical for cancer detection and predicting the outcome as well as choosing the suitable treatment methods. As involving in various biological processes in cancer, miRNA was considered to play a crucial role in cancer diagnosis and prognosis surveillance.
MiR-486 has been reported to be involved in different types of cancer. Research in the mechanism of miR-486 found that the down-regulation of miR-486 could target genes such as ARHGAP5 to inhibit cell migration and invasion in vitro and metastasis in vivo in lung cancer [6] and it could inhibit cancer cell proliferation, migration and invasive in vitro and suppress HCC growth in vivo by targeting PIK3R1 [4]. Furthermore, miR-486 might inhibit cell growth of papillary thyroid carcinoma by targeting fibrillin-1 [34] and estrogen receptor-mediated miR-486 could regulate expression of OLFM4 in ovarian cancer [35].
This present meta-analysis aimed to estimate the pooled effect of miR-486 expression on diagnosis and prognosis of human cancer. The diagnostic accuracy of miR-486 was pretty high. The adjusted pooled SEN, SPE and AUC were 82% (95% CI: 78–85%), 88% (95% CI: 83–92%) and 0.91 (95% CI: 0.88–0.93) respectively. With respect to the subgroup analysis, the circulating miR-486 obtained a higher diagnostic value than miR-486 from other specimen. In addition, the accuracy of miR-486 to detect cancer for Asian population was higher than Caucasian or Caucasian/ African population. The pooled AUC of 0.92 (95% CI: 0.89-0.94) indicated that the performance of miR-486 to detect NSCLC was feasible. As for the value of miR-486 on prognosis of cancer, the pooled HR was 0.48 (95% CI: -0.13–1.08) for low versus high miR-486 expression showed that low miR-486 expression did not increase the risk of poor outcome.
To our best knowledge, this meta-analysis was the first one to explore the effect of miR-486 on cancer diagnosis and prognosis. Although we perform this meta-analysis strictly according to the PRISMA guidelines, there were still some limitations that could not be neglected in this meta-analysis. First, the types of cancer included and the studies of each cancer as well as the samples of cases were so few that we could not conduct the subgroup analysis for the prognostic meta-analysis and these limitations might partly contribute to the negative result. Second, the heterogeneity among these studies could not be neglected and some articles might be missed or not be published online that did not be included in this meta-analysis. Third, most studies were from China in the prognostic meta-analysis and the results might just represent the prognostic value of miR-486 on Chinese cancer. Therefore, Studies on the large samples are still demanded to verify our results.
MATERIALS AND METHODS
Search strategy
We based our meta-analysis on the Preferred Reporting Items for meta-analyses (PRISMA). We searched PubMed, Cochrane library, Embase, Chinese National Knowledge Infrastructure (CNKI) and Wanfang databases to find all associated articles in order to investigate the potential utility of miR-486 as a diagnostic and prognostic surveillance tool for human cancer. The combination of the Medical Subject Headings (MeSH) and the keywords: (miR-486 or hsa-miR-486 or microRNA-486 or miR486) and (cancer or tumor or carcinoma or neoplasm) was used (updated to September 13, 2017). We also searched reference lists of the reviews aiming at obtaining other acceptable articles.
Study selection
There was a series of criteria for records inclusion as well as exclusion. For inclusion, records needed to meet the following criteria: 1) Patients of the cases were with cancer; 2) The controls were healthy controls (HC) or with benign diseases (BD); 3) Assess the diagnostic or prognostic value of miR-486 (miR-486-5p); 4) The TP, FP, FN, TN for the diagnosis and HR (hazard ratio) and its 95% CI for the prognosis can be extracted or calculated from the articles. For the exclusion, the criteria as follows: 1) Records that were review, meta-analysis and duplicate publications as well as the records unrelated; 2) Records without complete data or with the same population; 3) Records were about the miR-486-3p.
Data collection and quality assessment
The data was collected independently by two authors as follows: the first author, year of publication, subject’s demographic characteristics (ethnicity, mean or median age, sample size, testing method of miR-486 and the types of the controls and cancer); types of the specimen; follow-up time and the outcomes; miRNA profiling and the data used for this meta-analysis (SEN, SPE, TP, FP, FN, TN, HR and its 95% CI). All HRs were reformatted as low miR-486 expression versus high miR-486 expression. We assessed the quality of these articles with the Quality Assessment of Diagnostic Accuracy Studies 2 (QUADAS-2) guidelines for the diagnostic records and followed the guidelines of the Newcastle-Ottawa Scale (NOS) for the prognostic publications [36, 37].
Statistical analysis
We performed the statistical analysis using the STATA 11.0 (STATA-Corp, College Station, TX, version 11.0) software and RevMan 5.3 (version 1.4) software. A bivariate random effect-regression model was applied to assess the pooled SEN [TP/ (FN+TP)], SPE [TN/ (FP+TN)], the positive likelihood ratio (PLR) [(SEN/ (1-SEN)], the negative likelihood ratio (NLR) [(1-SPE)/SPE)], the diagnostic odds ratio (DOR) [PLR/ NLR] and the pooled HR with its 95% Confidence Interval (95% CI) respectively. We also constructed the SROC curve and calculated the AUC value. Simultaneously, we assessed the heterogeneity among the selected studies through the Q test and the I2 value [38]. The P value for the Q test less than 0.05 or the I2 ≥ 50% demonstrated that there was heterogeneity among the included studies. For the diagnostic meta-analyses, meta-regression analysis and subgroup analysis (grouped by miRNA profiling: single miR-486 and multiple miRNAs including miR-486 and other miRNAs; specimen: circulating and not circulating; ethnicity: Asian, Caucasian and Caucasian/African; control-type: benign disease and healthy controls; stage: early stage and not only early stage; cancer-type: lung cancer, gastric cancer, pancreatic cancer and renal cell carcinoma and sample size: >= 100 and < -100) were used to identify the potential sources of the heterogeneity and the Deek ’s funnel plot asymmetry test was also applied to explore the publication bias, with the P value less than 0.01 considered significant [39]. As for the prognostic meta-analyses, Begg’s and Egger’s tests were selected to evaluate the included studies for the possibility of publication bias. Finally, the sensitivity analysis was conducted to explore the possible sources of heterogeneity for both the diagnosis and the prognosis meta-analysis.
CONCLUSIONS
This was the first meta-analysis to confirm the potential value of miR-486 on cancer diagnosis and prognosis. The expression of miR-486 might be an effective biomarker for detection of human cancer.
Abbreviations
miR-486, has-miR-486/ has-miR-486-5p; miRNA, microRNA; mRNA, messenger RNA; 3’-UTR, 3’-untranslated region; NSCLC, non-small cell lung cancer; HCC, hepatocellular carcinoma; ESCC, esophageal squamous cell carcinoma; PC, pancreatic cancer; GC, gastric cancer; RCC, renal cell cancer; PRISMA, preferred Reporting Items for meta-analysis; HC, Healthy Control; BD, benign disease; SEN, sensitivity; SPE, specificity; SROC, summary receiver operating characteristic; AUC, the area under the SROC curve; CNKI, Chinese national knowledge infrastructure; PLR, positive likelihood ratio; NLR, negative likelihood ratio; DOR, diagnostic odds ratio; TP, true positive; FP, false positive; FN, false negative; TN, true negative; qRT-PCR, quantitative real-time polymerase chain reaction; HR, hazard ratio; OS, overall survival; PFS, progression-free survival; RFS, relapse free survival; QUADAS-2, the Quality Assessment of Diagnostic Accuracy Studies-2; NOS, the Newcastle-Ottawa Scale.
ACKNOWLEDGMENTS
Thanks for the efforts of all the authors.
CONFLICTS OF INTEREST
The authors declare no conflicts of interest.
REFERENCES
1. Lagos-Quintana M, Rauhut R, Lendeckel W, Tuschl T. Identification of novel genes coding for small expressed RNAs. Science. 2001; 294:853–8. https://doi.org/10.1126/science.1064921.
2. Nana-Sinkam SP, Croce CM. Non-coding RNAs in cancer initiation and progression and as novel biomarkers. Mol Oncol. 2011; 5:483–91. https://doi.org/10.1016/j.molonc.2011.10.003.
3. Calin GA, Croce CM. MicroRNA signatures in human cancers. Nat Rev Cancer. 2006; 6:857–66. https://doi.org/10.1038/nrc1997.
4. Huang XP, Hou J, Shen XY, Huang CY, Zhang XH, Xie YA, Luo XL. MicroRNA-486–5p, which is downregulated in hepatocellular carcinoma, suppresses tumor growth by targeting PIK3R1. FEBS J. 2015; 282:579–94. https://doi.org/10.1111/febs.13167.
5. Sun H, Cui C, Xiao F, Wang H, Xu J, Shi X, Yang Y, Zhang Q, Zheng X, Yang X, Wu C, Wang L. miR-486 regulates metastasis and chemosensitivity in hepatocellular carcinoma by targeting CLDN10 and CITRON. Hepatol Res. 2015; 45:1312–22. https://doi.org/10.1111/hepr.12500.
6. Wang J, Tian X, Han R, Zhang X, Wang X, Shen H, Xue L, Liu Y, Yan X, Shen J, Mannoor K, Deepak J, Donahue JM, et al. Downregulation of miR-486–5p contributes to tumor progression and metastasis by targeting protumorigenic ARHGAP5 in lung cancer. Oncogene. 2014; 33:1181–9. https://doi.org/10.1038/onc.2013.42.
7. Rask L, Balslev E, Sokilde R, Hogdall E, Flyger H, Eriksen J, Litman T. Differential expression of miR-139, miR-486 and miR-21 in breast cancer patients sub-classified according to lymph node status. Cell Oncol (Dordr). 2014; 37:215–27. https://doi.org/10.1007/s13402-014-0176-6.
8. Yi Y, Lu X, Chen J, Jiao C, Zhong J, Song Z, Yu X, Lin B. Downregulated miR-486–5p acts as a tumor suppressor in esophageal squamous cell carcinoma. Exp Ther Med. 2016; 12:3411–6. https://doi.org/10.3892/etm.2016.3783.
9. Mees ST, Mardin WA, Sielker S, Willscher E, Senninger N, Schleicher C, Colombo-Benkmann M, Haier J. Involvement of CD40 targeting miR-224 and miR-486 on the progression of pancreatic ductal adenocarcinomas. Ann Surg Oncol. 2009; 16:2339–50. https://doi.org/10.1245/s10434-009-0531-4.
10. Ali S, Saleh H, Sethi S, Sarkar FH, Philip PA. MicroRNA profiling of diagnostic needle aspirates from patients with pancreatic cancer. Br J Cancer. 2012; 107:1354–60. https://doi.org/10.1038/bjc.2012.383.
11. Namlos HM, Meza-Zepeda LA, Baroy T, Ostensen IH, Kresse SH, Kuijjer ML, Serra M, Burger H, Cleton-Jansen AM, Myklebost O. Modulation of the osteosarcoma expression phenotype by microRNAs. PLoS One. 2012; 7:e48086. https://doi.org/10.1371/journal.pone.0048086.
12. Wang LS, Li L, Li L, Chu S, Shiang KD, Li M, Sun HY, Xu J, Xiao FJ, Sun G, Rossi JJ, Ho Y, Bhatia R. MicroRNA-486 regulates normal erythropoiesis and enhances growth and modulates drug response in CML progenitors. Blood. 2015; 125:1302–13. https://doi.org/10.1182/blood-2014-06-581926.
13. Song L, Lin C, Gong H, Wang C, Liu L, Wu J, Tao S, Hu B, Cheng SY, Li M, Li J. miR-486 sustains NF-kappaB activity by disrupting multiple NF-kappaB-negative feedback loops. Cell Res. 2013; 23:274–89. https://doi.org/10.1038/cr.2012.174.
14. Butz H, Nofech-Mozes R, Ding Q, Khella HW, Szabó PM, Jewett M, Finelli A, Lee J, Ordon M, Stewart R, Krylov S, Yousef GM. Exosomal MicroRNAs Are Diagnostic Biomarkers and Can Mediate Cell-Cell Communication in Renal Cell Carcinoma. Eur Urol Focus. 2016; 2:210–8. https://doi.org/10.1016/j.euf.2015.11.006.
15. Cao Z, Liu C, Xu J, You L, Wang C, Lou W, Sun B, Miao Y, Liu X, Wang X, Zhang T, Zhao Y. Plasma microRNA panels to diagnose pancreatic cancer: Results from a multicenter study. Oncotarget. 2016; 7:41575–83. https://doi.org/10.18632/oncotarget.9491.
16. Jiang X. The expression and Clinical significance of plasma miR-486 and miR-499 in lung cancer. Hebei University. 2015.
17. Lin PY, Yang PC. Circulating miRNA signature for early diagnosis of lung cancer. EMBO Mol Med. 2011; 3:436–7. https://doi.org/10.1002/emmm.201100155.
18. Mozzoni P, Banda I, Goldoni M, Corradi M, Tiseo M, Acampa O, Balestra V, Ampollini L, Casalini A, Carbognani P, Mutti A. Plasma and EBC microRNAs as early biomarkers of non-small-cell lung cancer. Biomarkers. 2013; 18:679–86. https://doi.org/10.3109/1354750X.2013.845610.
19. Shen J, Liu Z, Todd NW, Zhang H, Liao J, Yu L, Guarnera MA, Li R, Cai L, Zhan M, Jiang F. Diagnosis of lung cancer in individuals with solitary pulmonary nodules by plasma microRNA biomarkers. BMC Cancer. 2011; 11:374. https://doi.org/10.1186/1471-2407-11-374.
20. Shen J, Todd NW, Zhang H, Yu L, Lingxiao X, Mei Y, Guarnera M, Liao J, Chou A, Lu CL, Jiang Z, Fang H, Katz RL, et al. Plasma microRNAs as potential biomarkers for non-small-cell lung cancer. Lab Invest. 2011; 91:579–87. https://doi.org/10.1038/labinvest.2010.194.
21. Sromek M, Glogowski M, Chechlinska M, Kulinczak M, Szafron L, Zakrzewska K, Owczarek J, Wisniewski P, Wlodarczyk R, Talarek L, Turski M, Siwicki JK. Changes in plasma miR-9, miR-16, miR-205 and miR-486 levels after non-small cell lung cancer resection. Cell Oncol (Dordr). 2017; 40:529–36. https://doi.org/10.1007/s13402-017-0334-8.
22. Tai MC, Yanagisawa K, Nakatochi M, Hotta N, Hosono Y, Kawaguchi K, Naito M, Taniguchi H, Wakai K, Yokoi K, Takahashi T. Blood-borne miRNA profile-based diagnostic classifier for lung adenocarcinoma. Sci Rep. 2016; 6:31389. https://doi.org/10.1038/srep31389.
23. Wang L, Shen X, Zhang J, Ju S. Expression of miR-486 in serum of patients with gastric cancer and its significance. Acta Academiae Medicinae Nanjing. 2016; 36:524–8.
24. Wang X, Zhi X, Zhang Y, An G, Feng G. Role of plasma MicroRNAs in the early diagnosis of non-small-cell lung cancers: a case-control study. J Thorac Dis. 2016; 8:1645–52. https://doi.org/10.21037/jtd.2016.06.21.
25. Xu J, Cao Z, Liu W, You L, Zhou L, Wang C, Lou W, Sun B, Miao Y, Liu X, Zhang T, Zhao Y. Plasma miRNAs Effectively Distinguish Patients With Pancreatic Cancer From Controls: A Multicenter Study. Ann Surg. 2016; 263:1173–9. https://doi.org/10.1097/SLA.0000000000001345.
26. Yang Y, Yang Q, Jia Y, Li X, Yang H, Zhang Q, Peng X, Zang A. The expression and clinical significance of plasma miR-486 and miR-499 in patients with lung cancer. Tianjin Yi Yao. 2016; 44:1367–70.
27. Yu L, Todd NW, Xing L, Xie Y, Zhang H, Liu Z, Fang H, Zhang J, Katz RL, Jiang F. Early detection of lung adenocarcinoma in sputum by a panel of microRNA markers. Int J Cancer. 2010; 127:2870–8. https://doi.org/10.1002/ijc.25289.
28. Zhu C, Ren C, Han J, Ding Y, Du J, Dai N, Dai J, Ma H, Hu Z, Shen H, Xu Y, Jin G. A five-microRNA panel in plasma was identified as potential biomarker for early detection of gastric cancer. Br J Cancer. 2014; 110:2291–9. https://doi.org/10.1038/bjc.2014.119.
29. Guo J, Meng R, Yin Z, Li P, Zhou R, Zhang S, Dong X, Liu L, Wu G. A serum microRNA signature as a prognostic factor for patients with advanced NSCLC and its association with tissue microRNA expression profiles. Mol Med Rep. 2016; 13:4643–53. https://doi.org/10.3892/mmr.2016.5114.
30. Hu Z, Chen X, Zhao Y, Tian T, Jin G, Shu Y, Chen Y, Xu L, Zen K, Zhang C, Shen H. Serum microRNA signatures identified in a genome-wide serum microRNA expression profiling predict survival of non-small-cell lung cancer. J Clin Oncol. 2010; 28:1721–6. https://doi.org/10.1200/JCO.2009.24.9342.
31. Li W, Wang Y, Zhang Q, Tang L, Liu X, Dai Y, Xiao L, Huang S, Chen L, Guo Z, Lu J, Yuan K. MicroRNA-486 as a Biomarker for Early Diagnosis and Recurrence of Non-Small Cell Lung Cancer. PLoS One. 2015; 10:e0134220. https://doi.org/10.1371/journal.pone.0134220.
32. Petriella D, De Summa S, Lacalamita R, Galetta D, Catino A, Logroscino AF, Palumbo O, Carella M, Zito FA, Simone G, Tommasi S. miRNA profiling in serum and tissue samples to assess noninvasive biomarkers for NSCLC clinical outcome. Tumour Biol. 2016; 37:5503–13. https://doi.org/10.1007/s13277-015-4391-1.
33. Ren C, Chen H, Han C, Fu D, Zhou L, Jin G, Wang F, Wang D, Chen Y, Ma L, Zheng X, Han D. miR-486–5p expression pattern in esophageal squamous cell carcinoma, gastric cancer and its prognostic value. Oncotarget. 2016; 7:15840–53. https://doi.org/10.18632/oncotarget.7417.
34. Ma X, Wei J, Zhang L, Deng D, Liu L, Mei X, He X, Tian J. miR-486–5p inhibits cell growth of papillary thyroid carcinoma by targeting fibrillin-1. Biomed Pharmacother. 2016; 80:220–6. https://doi.org/10.1016/j.biopha.2016.03.020.
35. Ma H, Tian T, Liang S, Liu X, Shen H, Xia M, Liu X, Zhang W, Wang L, Chen S, Yu L. Estrogen receptor-mediated miR-486–5p regulation of OLFM4 expression in ovarian cancer. Oncotarget. 2016; 7:10594–605. https://doi.org/10.18632/oncotarget.7236.
36. Whiting PF, Rutjes AW, Westwood ME, Mallett S, Deeks JJ, Reitsma JB, Leeflang MM, Sterne JA, Bossuyt PM, and QUADAS-2 Group. QUADAS-2: a revised tool for the quality assessment of diagnostic accuracy studies. Ann Intern Med. 2011; 155:529–36. https://doi.org/10.7326/0003–4819-155-8-201110180-00009.
37. Stang A. Critical evaluation of the Newcastle-Ottawa scale for the assessment of the quality of nonrandomized studies in meta-analyses. Eur J Epidemiol. 2010; 25:603–5. https://doi.org/10.1007/s10654-010-9491-z.
38. Higgins JP, Thompson SG, Deeks JJ, Altman DG. Measuring inconsistency in meta-analyses. BMJ. 2003; 327:557–60. https://doi.org/10.1136/bmj.327.7414.557.
39. Deeks JJ, Macaskill P, Irwig L. The performance of tests of publication bias and other sample size effects in systematic reviews of diagnostic test accuracy was assessed. J Clin Epidemiol. 2005; 58:882–93. https://doi.org/10.1016/j.jclinepi.2005.01.016.