
INTRODUCTION
Colorectal cancer (CRC) is the third most common cancer worldwide, with more than 1.3 million cases annually [1]. Approximately 90% of patients have potentially curable disease at the time of diagnosis, however, 20-30% will experience local, regional, or metastatic recurrence [2]. Survival of CRC patients is closely related to the stage of disease at the time of diagnosis, with five year survival of 90% in stage I disease versus 13% in patients with stage IV disease [3]. However, even in early stage cancers, patients still experience death due to recurrence. Other prognostic tools could aid in the selection of patients who would benefit from more aggressive treatment regimens.
Sporadic CRC develops through the adenoma to carcinoma sequence, through which individual cancer cells accumulate numerous genetic and epigenetic alterations [4, 5]. Commonly, the initiating genetic event involves silencing or activation of genes involved in cell-fate, cell survival, and genomic stability [6, 7]. These molecular alterations are clonal in nature, giving rise to inter- and intratumor heterogeneity. As with tumor initiation, the molecular changes associated with CRC progression seem to be distinct. However, no consistent epigenetic/genetic alterations have been discovered, which could provide further reliable prognostic information supporting the current staging methods for CRC [8]. The most prevalent epigenetic event in cancer development is DNA promoter hypermethylation [9]. This involves the addition of a methyl-group to a cytosine preceding a guanine in the DNA strand. Hypermethylations primarily target the promoter regions of different tumor suppressor genes leading to decreased transcription and inactivation [10]. Based on tissue studies, a distinct molecular subtype of CRC with increased promoter methylation in a subset of promoter regions was characterized as the CpG island methylator phenotype (CIMP) [11, 12]. This subtype was later characterized by right sided tumors and microsatellite instability [12]. Based on CIMP, previous studies have shown that CRC with this molecular subtype, have decreased overall survival [13].
Other hypermethylated promoter regions have been suggested as blood-based detection markers for CRC. However, only few of the blood based hypermethylations have been investigated for their prognostic value [14]. We aimed to assess a larger panel of cell-free DNA hypermethylations in peripheral blood samples as a marker for stage and survival in CRC patients.
RESULTS
Review of patient records lead to the exclusion of seven patients with benign disease or absence of CRC; three lacked CRC after endoscopic resection, one initially refused surgery, and one never provided informed consent. Moreover, five patients were excluded, because the reference gene (MEST1) could not be amplified during PCR. This left 193 CRC patients from which pre-treatment plasma samples were available for the analysis of cell-free DNA hypermethylations.
DNA hypermethylations and stage
The general characteristics of the CRC patients, along with the median number of hypermethylated promoter regions in plasma according to the respective clinicopathological features, are provided in Table 1. There was no association between the number of hypermethylated promoter regions, and sex or age of the patient population. Elevated CEA levels were positively associated with a high median number of hypermethylated promoter regions. The median levels of cell-free DNA were 4.00 ng/ml (range [0-132.58]) for all patients and highly similar between stages (p = 0.130). The median number of hypermethylated promoter regions in CRC patients with distant metastasis was 9 (range [0, 28]) compared to all other CRC patients with a median number of hypermethylations of 5 (range [0, 19]) (p<0.0001). There was a trend towards an increase in the number of hypermethylations in patients with advanced tumor invasion and advanced nodal status, however, this increase was not statistically significant (Table 1). The number of hypermethylated promoter regions according to AJCC stage is visualized in Figure 1.
Table 1: No. of methylated promoter regions according to clinicopathological features
Patients, n (%) |
Methylations, median (range) |
P-value |
|
|---|---|---|---|
Total |
193(100) |
5(0-28) |
|
Age |
|||
≤ 67 |
91(47.15) |
5(0-28) |
|
> 67 |
102(52.85) |
5(0-25) |
0.182 |
Sex |
|||
Male |
119(61.66) |
4(0-28) |
|
Female |
74(38.34) |
5(0-26) |
0.228 |
Smoke status |
|||
Never smoker |
68(35.23) |
5(0-25) |
|
Current smoker |
77(39.90) |
4(0-26) |
|
Previous smoker |
43(22.28) |
5(0-28) |
|
Unknown |
5(2.59) |
5(4-8) |
|
CEA-levels |
|||
≤ 5 ng/ml |
141(73.06) |
5(0-20) |
|
> 5 ng/ml |
52(26.94) |
6(1-28) |
0.002 |
Tumour |
|||
T1 |
3(1.55) |
5(4-5) |
|
T2 |
30(15.54) |
3.5(0-11) |
|
T3 |
120(62.18) |
5(2-26) |
|
T4 |
34(17.62) |
6(1-28) |
0.113 |
T-unknown |
6(3.11) |
22(5-25) |
|
Node |
|||
N0 |
121 |
(62.69) |
5(0-16) |
N1 |
38(19.69) |
5(0-23) |
|
N2 |
28(14.51) |
5(1-28) |
0.231 |
N-unknown |
6(3.11) |
22(5-25) |
|
Metastasis |
|||
M0 |
159(82.38) |
5(0-19) |
|
M1 |
34(17.62) |
9(0-28) |
<0.001 |
The number (n) and percentages (%) of colorectal cancer patients according to their respective clinicopathological features and the tumour (T), node (N), and metastasis (M) system. The median number and range of methylated promoter regions (Methylations) are also presented with p-values according to the different clinicopathological features. TNM-staging was performed after surgery from the pathological sections. P-values are calculated using the Wilcoxon-Mann-Whitney test. The P-value for T-stage was calculated to distinguish T1/2 tumours from T3/4 tumours. The P-value for N-stage was calculated to distinguish N0 from N1/2 disease. The P-value for M-stage, was calculated to distinguish M0 from M1 disease.
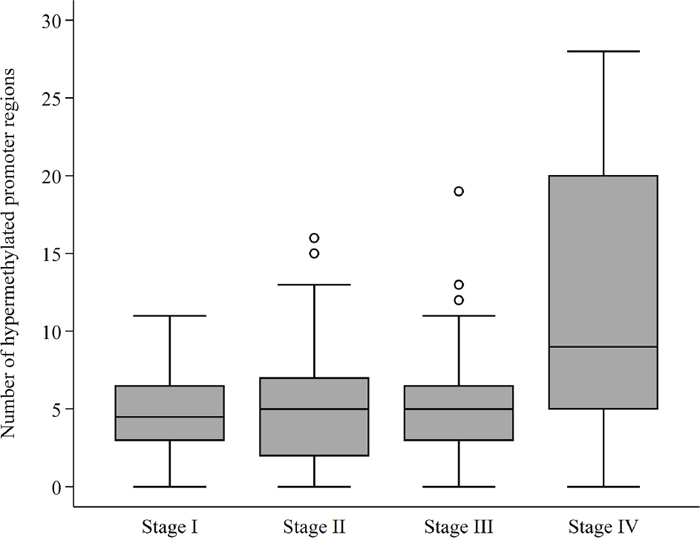
Figure 1: DNA promoter hypermethylations according to AJCC stage. The number (0-30) of hypermethylated promoter regions – measured in plasma – according to The American Joint Committee on Cancer (AJCC) colon and rectum cancer staging system, 7th Edition. The horizontal line represents the median value. The box shows the upper and lower quartile with the whiskers representing the greatest value, excluding outliers (circles).
Hypermethylation status of each individual promoter region according to the AJCC stage is provided in Table 2. There was a marked increase in the frequency of promoter hypermethylation in all genes from stage I to stage II, however, for several gene promoter regions (e.g. APC, MLH1, NPTX2, and TAC1) there were a marked decrease in methylation frequency from stage II to stage IV CRC (Table 2).
Table 2: Promoter hypermethylations according to CRC stage
AJCC stage 7th edition |
||||||||
|---|---|---|---|---|---|---|---|---|
I |
II |
III |
IV |
|||||
N |
% |
N |
% |
N |
% |
N |
% |
|
ALX4 |
5 |
2.6 |
19 |
9.8 |
13 |
6.7 |
18 |
9.3 |
APC |
12 |
6.2 |
38 |
19.7 |
14 |
7.3 |
17 |
8.8 |
BMP3 |
5 |
2.6 |
27 |
14.0 |
7 |
3.6 |
16 |
8.3 |
BNC1 |
0 |
0.0 |
6 |
3.1 |
2 |
1.0 |
15 |
7.8 |
BRCA1 |
9 |
4.7 |
23 |
11.9 |
9 |
4.7 |
8 |
4.1 |
CDKN2A |
4 |
2.1 |
6 |
3.1 |
1 |
0.5 |
7 |
3.6 |
HIC1 |
0 |
0.0 |
2 |
1.0 |
1 |
0.5 |
8 |
4.1 |
HLTF |
1 |
0.5 |
6 |
3.1 |
6 |
3.1 |
9 |
4.7 |
MGMT |
1 |
0.5 |
4 |
2.1 |
1 |
0.5 |
5 |
2.6 |
MLH1 |
12 |
6.2 |
42 |
21.8 |
18 |
9.3 |
15 |
7.8 |
NDRG4 |
1 |
0.5 |
5 |
2.6 |
4 |
2.1 |
8 |
4.1 |
NPTX2 |
18 |
9.3 |
56 |
29.0 |
34 |
17.6 |
27 |
14.0 |
NEUROG1 |
5 |
2.6 |
18 |
9.3 |
6 |
3.1 |
11 |
5.7 |
OSMR |
1 |
0.5 |
7 |
3.6 |
2 |
1.0 |
12 |
6.2 |
PHACTR3 |
2 |
1.0 |
10 |
5.2 |
5 |
2.6 |
11 |
5.7 |
PPENK |
3 |
1.6 |
4 |
2.1 |
3 |
1.6 |
10 |
5.2 |
RARB |
3 |
1.6 |
20 |
10.4 |
11 |
5.7 |
15 |
7.8 |
RASSF1A |
3 |
1.6 |
8 |
4.1 |
4 |
2.1 |
7 |
3.6 |
SDC2 |
4 |
2.1 |
15 |
7.8 |
9 |
4.7 |
19 |
9.8 |
SEPT9 |
3 |
1.6 |
18 |
9.3 |
7 |
3.6 |
19 |
9.8 |
SFRP1 |
3 |
1.6 |
9 |
4.7 |
9 |
4.7 |
21 |
10.9 |
SFRP2 |
3 |
1.6 |
8 |
4.1 |
10 |
5.2 |
18 |
9.3 |
SPG20 |
2 |
1.0 |
10 |
5.2 |
6 |
3.1 |
12 |
6.2 |
SST |
7 |
3.6 |
21 |
10.9 |
11 |
5.7 |
19 |
9.8 |
TAC1 |
16 |
8.3 |
39 |
20.2 |
25 |
13.0 |
22 |
11.4 |
THBD |
0 |
0.0 |
4 |
2.1 |
3 |
1.6 |
12 |
6.2 |
TFPI2 |
1 |
0.5 |
3 |
1.6 |
1 |
0.5 |
9 |
4.7 |
VIM |
5 |
2.6 |
11 |
5.7 |
6 |
3.1 |
12 |
6.2 |
WIF1 |
2 |
1.0 |
3 |
1.6 |
2 |
1.0 |
12 |
6.2 |
WNT5A |
0 |
0.0 |
4 |
2.1 |
2 |
1.0 |
6 |
3.1 |
The number (N) and percentages (%) of colorectal cancer (CRC) patients (N=193) with positive amplification of hypermethylated promoter regions in plasma samples according to the American Joint Committee on Cancer (AJCC) staging system 7th Edition.
DNA hypermethylations and survival
Each patient was followed until death or five years after diagnosis. No patients were lost to follow-up, and the registered overall mortality was 38.3% (74/193). Overall survival was closely associated with the number of hypermethylated promoter regions (Figure 2A). Having more than four methylated promoter regions in plasma, was clearly associated with a decrease in five-year survival (p < 0.001). The association between decreased survival and having five to ten methylated promoter regions in plasma compared to having more than ten hypermethylations was limited (p = 0.09).
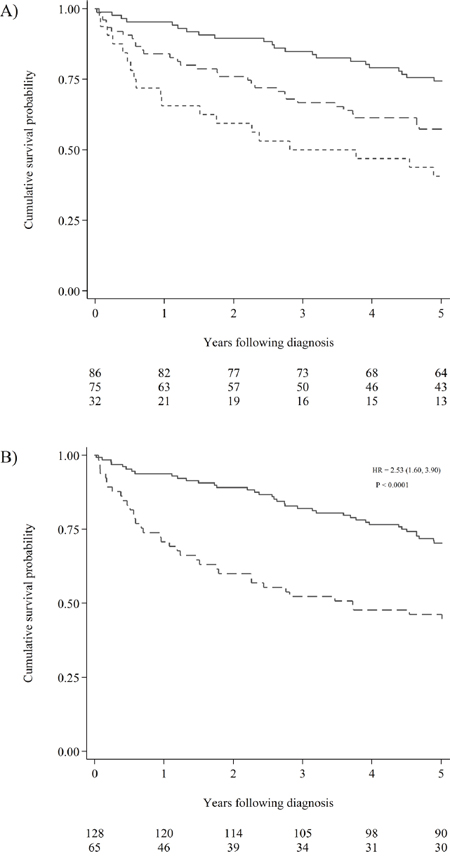
Figure 2: Cumulative survival probability according hypermethylation status. (A) Kaplan Meier estimates visualising the effect of the number of hypermethylations on the survival of CRC patients. The solid line represents patients with 0-4 hypermethylated promoter regions measured in plasma. The dashed line represents patients with 5-10 hypermethylated promoter regions in plasma. The short dashed line represents patients with more than 10 hypermethylated promoter regions in plasma. The number of patients at risk in the three groups can be seen below the graph. (B) Kaplan Meier estimates visualising the effect hypermethylation of RARB or RASSF1A on the survival of all-stage CRC patients. The solid line represents patients without hypermethylation of either promoter region. The dashed line represents patients with hypermethylated RARB and/or RASSF1A in plasma. The hazard ratio (HR) was computed using univariable Cox regression (the 95% confidence interval is reported in brackets). The Log-rank test for equality of survivor functions was used to compute the p-value. The number of patients at risk for the two groups can be seen below the graph.
Most of the hypermethylated promoter regions inferred a poor prognosis; however, not all were significant (Figure 3). We chose a strict significance level (P < 0.01) for the selection of potential predictor variables to include in our multivariable Cox-regression model (Table 3). The multivariable Cox-regression model showed, that only two markers were significant independent predictors of poor overall survival when we adjusted for sex, age, pre-treatment CEA-levels, and stage of CRC at the time of diagnosis. These were RARB (HR = 1.99, 95% CI [1.07,3.72]) and RASSF1A (HR = 3.35, 95% CI [1.76,6.38]). The overall effect of RARB and RASSF1A hypermethylation was not affected by tumor localization (colon vs. rectum), and the survival curve for all types of CRC is visualized in Figure 2B.
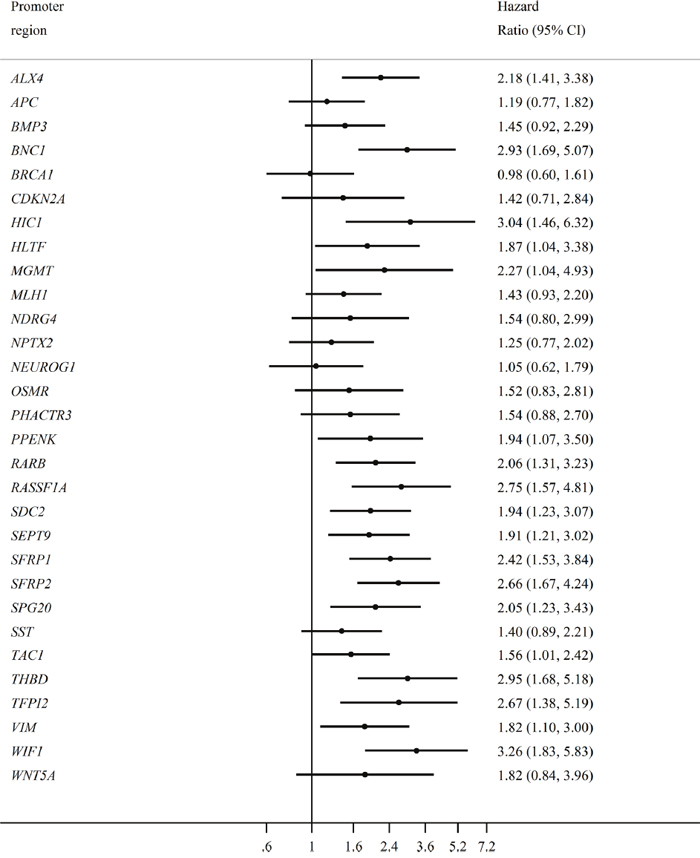
Figure 3: The individual effect of each promoter hypermethylation on overall survival. Forrest plot visualizing the hazard ratios for all stage CRC patients (N=193). The name of each individual hypermethylated promoter regions is presented on the left, with the corresponding hazard ratio on the right. The bottom horizontal line shows the hazard ratios from 0.6 to 7.2, with the vertical solid line representing the reference line (hazard ratio = 1).
Table 3: Cox regression analysis
Univariable Cox regression |
Multivariable Cox regression |
|||||||
|---|---|---|---|---|---|---|---|---|
HR |
95% CI |
P-value |
HR |
95% CI |
P-value |
|||
Sex |
1.11 |
0.72 |
1.71 |
0.642 |
0.99 |
0.61 |
1.60 |
0.968 |
Age |
1.00 |
1.00 |
1.00 |
0.005 |
1.00 |
1.00 |
1.00 |
<0.001 |
CEA |
2.42 |
1.57 |
3.71 |
<0.001 |
1.50 |
0.89 |
2.52 |
0.126 |
Stage I |
1.00 |
1.00 |
||||||
Stage II |
3.77 |
1.15 |
12.34 |
0.028 |
3.75 |
1.13 |
12.47 |
0.031 |
Stage III |
4.99 |
1.48 |
16.88 |
0.010 |
5.09 |
1.45 |
17.78 |
0.011 |
Stage IV |
22.36 |
6.76 |
73.92 |
<0.001 |
25.07 |
6.77 |
92.87 |
<0.001 |
ALX4 |
2.18 |
1.41 |
3.38 |
<0.001 |
1.50 |
0.86 |
2.63 |
0.157 |
BNC1 |
2.93 |
1.69 |
5.07 |
<0.001 |
1.44 |
0.64 |
3.26 |
0.377 |
HIC1 |
3.04 |
1.46 |
6.32 |
0.003 |
0.79 |
0.29 |
2.14 |
0.649 |
RARB |
2.06 |
1.31 |
3.23 |
0.002 |
1.99 |
1.07 |
3.72 |
0.031 |
RASSF1A |
2.75 |
1.57 |
4.81 |
<0.001 |
3.35 |
1.76 |
6.38 |
<0.001 |
SDC2 |
1.94 |
1.23 |
3.07 |
0.005 |
0.71 |
0.34 |
1.49 |
0.368 |
SEPT9 |
1.91 |
1.21 |
3.02 |
0.006 |
0.71 |
0.37 |
1.37 |
0.313 |
SFRP1 |
1.91 |
1.21 |
3.02 |
0.006 |
0.71 |
0.37 |
1.37 |
0.313 |
SFRP2 |
2.42 |
1.53 |
3.84 |
<0.001 |
0.98 |
0.46 |
2.06 |
0.955 |
SPG20 |
2.66 |
1.67 |
4.24 |
<0.001 |
1.73 |
0.85 |
3.51 |
0.131 |
TFPI2 |
2.67 |
1.38 |
5.19 |
0.004 |
0.92 |
0.33 |
2.52 |
0.863 |
THBD |
2.95 |
1.68 |
5.18 |
<0.001 |
0.69 |
0.29 |
1.64 |
0.405 |
WIF1 |
3.26 |
1.83 |
5.83 |
<0.001 |
0.78 |
0.31 |
1.95 |
0.592 |
APC |
1.19 |
0.77 |
1.82 |
0.440 |
||||
BMP3 |
1.45 |
0.92 |
2.29 |
0.106 |
||||
BRCA1 |
0.98 |
0.60 |
1.61 |
0.950 |
||||
CDKN2A |
1.42 |
0.71 |
2.84 |
0.317 |
||||
HLTF |
1.87 |
1.04 |
3.38 |
0.038 |
||||
MGMT |
2.27 |
1.04 |
4.93 |
0.039 |
||||
MLH1 |
1.43 |
0.93 |
2.20 |
0.100 |
||||
NDRG4 |
1.54 |
0.80 |
2.99 |
0.197 |
||||
NPTX2 |
1.25 |
0.77 |
2.02 |
0.365 |
||||
NEUROG1 |
1.05 |
0.62 |
1.79 |
0.857 |
||||
OSMR |
1.52 |
0.83 |
2.81 |
0.178 |
||||
PHACTR3 |
1.54 |
0.88 |
2.70 |
0.128 |
||||
PPENK |
1.94 |
1.07 |
3.50 |
0.029 |
||||
SST |
1.40 |
0.89 |
2.21 |
0.146 |
||||
TAC1 |
1.56 |
1.01 |
2.42 |
0.047 |
||||
VIM |
1.82 |
1.10 |
3.00 |
0.020 |
||||
WNT5A |
1.82 |
0.84 |
3.96 |
0.129 |
||||
The univariable analysis of overall mortality using univariable Cox regression analysis. Variables reaching af significance level (p-values < 0.01) were analysed in the subsequent multivariable Cox regression analysis, adjusting for sex, age, CEA-levels and American Joint Committee on Cancer (AJCC) staging system. Individual hazard ratios (HR) with corresponding 95% confidence intervals (95% CI) and P-values. Carcinoembryonic antigen (CEA) was considered positive if the levels were above 5 mg/l for non-smokers, and if the levels were above 10 mg/l for smokers.
DISCUSSION
Increased attention has been on DNA alterations, as markers for both disease stage and response to therapy, in cancer. Solid tumors (such as CRC) harbor multiple genetic and epigenetic alterations, which are not detectable in normal cells, making them ideal biomarkers for disease stage and progression. Circulating DNA and circulating tumor cells have therefore been coined the liquid biopsy making an accurate characterization of patient tumors possible, surpassing the need for tumor tissue.
It has long been recognized, that the concentration of circulating cell-free DNA is greater in cancer patients than in healthy control individuals [15, 16]. The concentration is also closely related to tumor burden and the risk of metastasis [16]. To our knowledge, this is the first study to show, that the mere number of hypermethylated DNA fragments is associated with increased risk of metastasis and decreased overall survival. Moreover, we show that the number of methylated promoter regions circulating cell-free DNA only increases from stage I to stage IV CRC. This demonstrates that DNA hypermethylation is a dynamic process, which is closely related to the metastatic properties of CRC.
Not all of the hypermethylated promoter regions were markers for increasing CRC stage. Surprisingly, certain DNA promoter regions were more frequently hypermethylated in stage II vs. stage IV disease. Some of these alterations might indicate less aggressive tumors, or simply be passenger alterations, without any relation to tumor progression [17].
Molecular biomarkers for human malignancies are currently the subject of vigorous investigation [18]. These markers have previously been shown to be more accurate biomarkers than current protein-based biomarkers, and new and improved methods for high-throughput analysis of multiple molecular biomarkers are now available [19]. In castrate-resistant prostate cancer it has been shown, that hypermethylated GSTP1 is a more sensitive predictor for disease progression than the established biomarker; prostate specific antigen (PSA) [20]. This is in line with the results from our multivariable analysis, were we show, that hypermethylated biomarkers render more prognostic information than CEA levels. Furthermore, we found that hypermethylation of RARB and RASSF1A were independent predictors of poor overall survival in CRC patients, further emphasizing the potential usage of circulating hypermethylated DNA as biomarkers for CRC prognosis.
RASSF1A hypermethylation has been implemented in the progression of several different malignancies, the most studied being breast and lung cancer [21]. However, studies have also focused on the association of RASSF1A hypermethylation and CRC. In one study by Shihan et al. RASSF1A promoter hypermethylation was reported in 47% of colorectal tumors versus 13% of paired normal tissue specimens, with significant associations between methylation status and tumor stage, metastasis, and lymphatic invasion [22]. Three studies have assessed its performance as a blood-based biomarker for CRC with sensitivities ranging from 23% to 93% [23–25]. RASSF1A hypermethylation was only present in 11% (22/193) of the plasma samples from our cohort. The discrepancy between our study and the previously mentioned studies could be a result of differences in study population, ethnicity, choice of medium for analysis (plasma vs. serum), and the method used for methylation analysis. However, it seems unequivocal, that circulating hypermethylation of RASSF1A is an indication of aggressive tumors, with a strong risk of metastasis.
The loss of RARB expression has been associated with a variety of cancers (predominantly of mammary and pulmonary origin), and it has been correlated with suppressed expression of epidermal growth factor receptor (EGFR) [26]. EGFR antibodies (e.g. cetuximab or panitumumab) are currently a part of the chemotherapeutic regimen for locally advanced and metastatic CRC, and circulating RARB hypermethylation could therefore be a marker of anti-EGFR resistant disease [27]. Conversely, cell-free hypermethylated RARB has previously been demonstrated in 69.6% of colonoscopy verified healthy individuals, making the function of circulating RARB hypermethylation somewhat puzzling [28]. In pulmonary tumors, hypermethylation of RARB was differentially associated with the development of secondary primary lung tumors, depending on patient smoking status [29]. In our study, there was no apparent association between RARB methylation and smoking status, but this illustrates, that the effect of circulating RARB hypermethylation on patient outcome could be influenced by numerous endogenous as well as exogenous factors not accounted for in this study. We therefore employ, that future studies on circulating cell-free DNA hypermethylations explore the effect of other factors, rather than merely the presence of these molecular biomarkers. This is further stressed in a study by Ørntoft et al. describing SEPT9 [30]. They found, that SEPT9 hypermethylation was readily affected by both the presence of other simultaneous diseases and advanced age. Nonetheless, circulating RARB and RASSF1A hypermethylation appear to be associated with adverse outcome regardless of patient age and disease stage at the time of diagnosis. The effect of especially circulating RARB hypermethylation in a population without CRC remains to be elucidated.
Limitations
Some limitations in our analytical framework needs to be addressed.
Circulating cell-free DNA does not solely originate from malignant cells. The majority is derived from the turnover of normal cells, or other cells from the tumor micro environment [18]. The DNA from these cells has a number of properties which enables the distinction between “normal” circulating DNA and circulating tumor DNA (e.g. fragment lengths, promoter methylation and somatic mutations) [18]. The consensus molecular subtypes of CRC have recently been established, with the aim of better understanding the non-random process of CRC initiation and progression [31]. Herein, hypermethylation of the 5’ untranslated region of different genomic regions has primarily been reported as an event contributing to the initiation and progression of the consensus molecular subtype 1 (CMS1). This subtype accounts for approximately 14% of CRC cases. However, DNA hypermethylation is readily a part of every type of CRC, and different markers could infer different prognostic effects, regardless of the individual tumor subtype.
This was a retrospective analysis of blood samples from a previous study, and tumor samples were not available for this patient cohort. It was therefore not possible to ensure, that the circulating DNA hypermethylations were originating from CRC tumors other than associations from previous studies [14]. Previous studies on metastatic CRC have reported that circulating cell-free DNA is an accurate measure for disease burden [32]. Whether our results are merely a surrogate marker for an increased concentration of circulating DNA is unknown. However, regardless of origin, the presence of a large number of cancer associated hypermethylated DNA fragments is a marker for increased stage, and poor overall survival in CRC patients.
The sensitivity for the detection of hypermethylated DNA could be limited. The DNA is subject to degradation in every analytical step, the most crucial being the bisulfite conversion [33]. This problem is emphasized in the analysis of circulating tumor derived DNA. Circulating tumor DNA is associated with shorter fragment lengths, even more susceptible to degradation than DNA from other sources [18]. The method employed by our group has a reasonable yield of up to 60% after bisulfite conversion [34]. Unfortunately, the yield can be highly variable and the DNA concentration could be reduced by up to 25% after bisulfite conversion. Prolonged storage also leads to a decrease in DNA quantity, with annual degradation rates of approximately 7-30% (at minus 80°C) [35, 36]. Consequently, the false negative rate is strongly affected by the amount of DNA available for analysis. The use of more sensitive digital PCR based methods could provide an even more accurate determination of the hypermethylated DNA fragments even in the situation of low DNA concentrations [37]. Recent developments in sequencing based technologies, could eliminate the need for bisulfite conversion all-together, rendering more DNA for analysis, and hence, less false-negative results [38].
Through this study, we investigated the properties of circulating DNA hypermethylations and their relation to CRC stage and survival. Hypermethylated DNA has been proposed as diagnostic and prognostic markers for CRC. We found that a high number of hypermethylated promoter regions measured in plasma was strongly associated with the presence of distant metastasis and decreased survival in CRC. When incorporated in a multivariable cox regression model, hypermethylated RARB and RASSF1A rendered prognostic information regardless of disease stage at the time of diagnosis. To ensure reproducibility, the results needs to be validated in independent patient cohorts.
In spite of improved screening modalities and treatment strategies, disease recurrence and distant metastasis remains a challenge in CRC treatment. Therefore, analysis of hypermethylated DNA, along with other prognostic markers for CRC (e.g. KRAS mutation and BRAF mutation) could aid in the choice of treatment for these patients.
MATERIALS AND METHODS
Design
The study consist of two parts; (i) a cross-sectional study to evaluate the correlation between the number of cell-free DNA hypermethylations and the primary stage of CRC, and (ii) a cohort study to evaluate the impact of cell-free DNA hypermethylations on patient survival.
Study population
Consecutive CRC patients admitted for intended curative treatment at The Department of Gastrointestinal Surgery, Aalborg University Hospital between 2003 and 2005 were included prospectively [39]. The original study was conducted in order to evaluate the correlation between CRC and venous thromboembolism. Criteria for inclusion, and exclusion, are described elsewhere [39]. All patients had blood drawn at the time of diagnosis and before the initiation of any treatment. Patient tumors were classified according to the tumor, node, and metastasis (TNM) system, and individual cancers were staged according to the American Joint Committee on Cancer staging system (AJCC) 7th Edition. Stage classification was conducted according to pathology in the patients receiving curative resection and according to radiology in patients who were deemed inoperable.
Ethics
Written informed consent was obtained from all patients, and the initial study was approved by The North Denmark Region Committee on Health Research Ethics (N-20040067). The subsequent hypermethylation analysis was also approved by The North Denmark Region Committee on Health Research Ethics (N-20140064) and registered at ClinicalTrials.gov (NCT02928120).
Outcome and predictor variables
In order to establish a model for CRC prognosis, we evaluated 30 gene promoter regions, previously analyzed in stool or blood, as biomarkers for stage and survival of CRC patients [14]. These 30 gene promoter regions were defined as the potential prognostic variables (Supplementary Table 1). We handled all potential prognostic variables as dichotomous (hypermethylated/non-hypermethylated). We handled patient sex as a categorical variable and age as a continuous variable. Carcinoembryonic antigen (CEA) was considered positive if the levels were above 5 ng/ml for non-smokers, and above 10 ng/ml for smokers. We defined the outcome variable as time from study inclusion to death (or censoring) for survival analysis.
Blood sampling
All blood samples were obtained by a skilled technician in full accordance with The European Concerted Action on Thrombosis (ECAT) procedures [40]. The blood samples were centrifuged (at 4 °C for 20 minutes at 4000 rpm) immediately after venipuncture, and the EDTA plasma aliquots were collected, and stored at −80°C.
Hypermethylation analysis
The method used for DNA extraction and methylation analysis is based on a rapid bisulfite method [34]. Plasma nucleic acids were extracted from 350-1,000 μl plasma samples using the easyMagTM platform (NucliSens® [bioMérieux SA, France]) according to the manufacturers’ instructions. The purified nucleic acids were eluted in 35 μl elution buffer (NucliSens® [bioMérieux SA, France]). Thirty μl DNA extract was then mixed with 60 μl deamination solution, deaminated for 10 minutes at 90 °C, following a purification step and lastly eluted in 25 μl 10 mM KOH. The remaining five μl were used for quantitation. In order to enrich for methylated DNA which had been successfully deaminated, we conducted a first round polymerase chain reaction (PCR) using a mix of methylation specific outer primers for all the investigated promoter regions. The reaction buffer (25 μl) consisted of PCR buffer, 13 μM MgCl2, 0.6 mM dNTP, 250 nM of each outer primer, 1.5 U Taq polymerase (Bioline® [Taunton, MA, USA]), and 0.3 U Cod Uracil-DNA Glycosylase (ArcticZymes® [Tromsoe, Norway]). We distributed the first round reaction mix to individual 200 μl PCR tubes, which were incubated for five minutes at 37 °C, followed by 95 °C for five minutes, and cooled to room temperature. Thereafter, we added 25 μl of purified deamination product to each tube, and performed the PCR reaction for 20 rounds (92 °C for 15 seconds, 55 °C for 30 seconds, and 72 °C for 30 seconds). For the second PCR reaction, we distributed 10 μl buffer containing 0.4 μM methylation specific inner primers and probes in 30 individual wells (one for each promoter region) in a 96 well PCR plate. We added 10 μl of the first round PCR product to 710 μl preincubated reaction mix (37 °C for five minutes and 95 °C for 10 minutes) containing PCR buffer, 250 μM dNTP, 10 μM MgCl2, 8 U Taq polymerase (Bioline®, [Taunton, MA, USA]), and 0.8 Uracil-DNA Glycosylase (Invitrogen® [Waltham, MA, USA]). Twenty μl of reaction mix was then added to each of the 30 wells containing primers and probes. Real time PCR was conducted for 45 rounds (94 °C for 15 seconds, 55 °C for 30 seconds, and 72 °C for 30 seconds). All primer and probe sequences along with amplicon sizes are available in Supplementary Table 2-3.
Statistical analysis
Initially, we compared the median level of cell-free DNA according to stage of disease at the time of diagnosis using Kruskal-Wallis test. Subsequently, we calculated the number and range of the hypermethylated promoter regions according to CRC stage and TNM classification. The non-parametric Wilcoxon-Mann-Whitney test was used to evaluate if the number differed between high and low stage or TNM classification (T3/4 vs T1/2, N1/2 vs N0, M1 vs M0). We used the Kaplan Meier method to visualize the effect of the number of promoter hypermethylations measured in plasma, and compared the survival distributions using the Log-Rank test. In order to evaluate each of the potential predictor variables as markers for CRC survival, we conducted a univariable Cox regression analysis. All the potential predictor variables reaching a significance level below 0.01 were subsequently examined using multivariable Cox-regression analysis. We constructed a model using the selected predictor variables from the univariable screening, the co-variables sex, age, and pre-treatment CEA levels (>5 ng/ml), adjusted for AJCC stage, in order to evaluate the gained information from the potential predictor variables.
We used STATA® V.13.1 (StataCorp. 2013. Stata Statistical Software: Release 13. College Station, TX: StataCorp LP) for all statistical analyses.
ACKNOWLEDGMENTS
The authors extend their gratitude to all participants in the study for providing sample material for analysis. Moreover, the authors wish to thank Bioanalyst June Lundtoft for her invaluable assistance.
CONFLICTS OF INTEREST
The authors have none to disclose.
FUNDING
This study was primarily funded by Aalborg University and Aalborg University Hospital. Grant support was received from “Region Nordjyllands Forskningsfond”, “Heinrich Kopps Legat”, and “Eva og Henry Frænkels Mindefond”.
REFERENCES
1. International Agency for Research on Cancer. GLOBOCAN 2012: Estimated Cancer Incidence, Mortality and Prevalence Worldwide in 2012. Available from http://globocan.iarc.fr/.
2. Hellinger MD, Santiago CA. Reoperation for recurrent colorectal cancer. Clin Colon Rectal Surg. 2006; 19: 228–36. https://doi.org/10.1055/s-2006-956445.
3. American Cancer Society. Colorectal Cancer Facts & Figures. Available from https://www.cancer.org/research/cancer-facts-statistics/colorectal-cancer-facts-figures.html.
4. Vogelstein B, Fearon ER, Hamilton SR, Kern SE, Preisinger AC, Leppert M, Smits AM, Bos JL. Genetic alterations during colorectal-tumor development. N Engl J Med. 1988; 319: 525–32. https://doi.org/10.1056/NEJM198809013190901.
5. Carethers JM, Jung BH. Genetics and genetic biomarkers in sporadic colorectal cancer. Gastroenterology. 2015; 149: 1177–90. https://doi.org/10.1053/j.gastro.2015.06.047.
6. Lao VV, Grady WM. Epigenetics and colorectal cancer. Nat Rev Gastroenterol Hepatol. 2011; 8: 686–700. https://doi.org/10.1038/nrgastro.2011.173.
7. Muzny DM, Bainbridge MN, Chang K, Dinh HH, Drummond JA, Fowler G, Kovar CL, Lewis LR, Morgan MB, Newsham IF, Reid JG, Santibanez J, Shinbrot E, et al. Comprehensive molecular characterization of human colon and rectal cancer. Nature. 2012; 487: 330–7. https://doi.org/10.1038/nature11252.
8. Kamiyama H, Noda H, Konishi F, Rikiyama T. Molecular biomarkers for the detection of metastatic colorectal cancer cells. World J Gastroenterol. 2014; 20:8928–38. https://doi.org/10.3748/wjg.v20.i27.8928.
9. Jones PA, Laird PW. Cancer epigenetics comes of age. Nat Genet. 1999; 21: 163–7. https://doi.org/10.1038/5947.
10. Jones PA, Baylin SB. The fundamental role of epigenetic events in cancer. Nat Rev Genet. 2002; 3: 415–28. https://doi.org/10.1038/nrg816.
11. Toyota M, Ahuja N, Ohe-Toyota M, Herman JG, Baylin SB, Issa JP. CpG island methylator phenotype in colorectal cancer. Proc Natl Acad Sci U S A. 1999; 96: 8681–6. https://doi.org/10.1073/pnas.96.15.8681.
12. Weisenberger DJ, Siegmund KD, Campan M, Young J, Long TI, Faasse MA, Kang GH, Widschwendter M, Weener D, Buchanan D, Koh H, Simms L, Barker M, et al. CpG island methylator phenotype underlies sporadic microsatellite instability and is tightly associated with BRAF mutation in colorectal cancer. Nat Genet. 2006; 38: 787–93. https://doi.org/10.1038/ng1834.
13. Juo YY, Johnston FM, Zhang DY, Juo HH, Wang H, Pappou EP, Yu T, Easwaran H, Baylin S, van Engeland M, Ahuja N. Prognostic value of CpG island methylator phenotype among colorectal cancer patients: a systematic review and meta-analysis. Ann Oncol. 2014; 25: 2314–27. https://doi.org/10.1093/annonc/mdu149.
14. Rasmussen SL, Krarup HB, Sunesen KG, Pedersen IS, Madsen PH, Thorlacius-Ussing O. Hypermethylated DNA as a biomarker for colorectal cancer: a systematic review. Colorectal Dis. 2016; 18: 549–61. https://doi.org/10.1111/codi.13336.
15. Leon SA, Shapiro B, Sklaroff DM, Yaros MJ. Free DNA in the serum of cancer patients and the effect of therapy. Cancer Res. 1977; 37: 646–50. http://www.ncbi.nlm.nih.gov/pubmed/837366.
16. Stroun M, Anker P, Maurice P, Lyautey J, Lederrey C, Beljanski M. Neoplastic characteristics of the DNA found in the plasma of cancer patients. Oncology. 1989; 46: 318–22. https://doi.org/10.1159/000226740.
17. Boland CR, Goel A. Microsatellite instability in colorectal cancer. Gastroenterology. 2010; 138: 2073–2087.e3. https://doi.org/10.1053/j.gastro.2009.12.064.
18. Thierry AR, El Messaoudi S, Gahan PB, Anker P, Stroun M. Origins, structures, and functions of circulating DNA in oncology. Cancer Metastasis Rev. 2016; 35: 347–76. https://doi.org/10.1007/s10555-016-9629-x.
19. Schwarzenbach H, Hoon DS, Pantel K. Cell-free nucleic acids as biomarkers in cancer patients. Nat Rev Cancer. 2011; 11: 426–37. https://doi.org/10.1038/nrc3066.
20. Mahon KL, Qu W, Devaney J, Paul C, Castillo L, Wykes RJ, Chatfield MD, Boyer MJ, Stockler MR, Marx G, Gurney H, Mallesara G, Molloy PL, et al. Methylated Glutathione S-transferase 1 (mGSTP1) is a potential plasma free DNA epigenetic marker of prognosis and response to chemotherapy in castrate-resistant prostate cancer. Br J Cancer. 2014; 111: 1802–9. https://doi.org/10.1038/bjc.2014.463.
21. Grawenda AM, O’Neill E. Clinical utility of RASSF1A methylation in human malignancies. Br J Cancer. 2015; 113: 372–81. https://doi.org/10.1038/bjc.2015.221.
22. Sinha R, Hussain S, Mehrotra R, Kumar RS, Kumar K, Pande P, Doval DC, Basir SF, Bharadwaj M. Kras gene mutation and RASSF1A, FHIT and MGMT gene promoter hypermethylation: indicators of tumor staging and metastasis in adenocarcinomatous sporadic colorectal cancer in Indian population. PLoS One. 2013; 8: e60142. https://doi.org/10.1371/journal.pone.0060142.
23. Cassinotti E, Melson J, Liggett T, Melnikov A, Yi Q, Replogle C, Mobarhan S, Boni L, Segato S, Levenson V. DNA methylation patterns in blood of patients with colorectal cancer and adenomatous colorectal polyps. Int J Cancer. 2012; 131: 1153–7. https://doi.org/10.1002/ijc.26484.
24. Wang YC, Yu ZH, Liu C, Xu LZ, Yu W, Lu J, Zhu RM, Li GL, Xia XY, Wei XW, Ji HZ, Lu H, Gao Y, et al. Detection of RASSF1A promoter hypermethylation in serum from gastric and colorectal adenocarcinoma patients. World J Gastroenterol. 2008; 14: 3074. https://doi.org/10.3748/wjg.14.3074.
25. Tan SH, Ida H, Lau QC, Goh BC, Chieng WS, Loh M, Ito Y. Detection of promoter hypermethylation in serum samples of cancer patients by methylation-specific polymerase chain reaction for tumour suppressor genes including RUNX3. Oncol Rep. 2007; 18: 1225–30.
26. Xu XC. Tumor-suppressive activity of retinoic acid receptor-β in cancer. Cancer Lett. 2007; 253: 14–24. https://doi.org/10.1016/j.canlet.2006.11.019.
27. Yen LC, Uen YH, Wu DC, Lu CY, Yu FJ, Wu IC, Lin SR, Wang JY. Activating KRAS mutations and overexpression of epidermal growth factor receptor as independent predictors in metastatic colorectal cancer patients treated with cetuximab. Ann Surg. 2010; 251: 254–60. https://doi.org/10.1097/SLA.0b013e3181bc9d96.
28. Rasmussen SL, Krarup HB, Sunesen KG, Johansen MB, Stender MT, Pedersen IS, Madsen PH, Thorlacius-Ussing O. Hypermethylated DNA, a circulating biomarker for colorectal cancer detection. PLoS One. 2017; 12: e0180809. https://doi.org/10.1371/journal.pone.0180809.
29. Kim JS, Lee H, Kim H, Shim YM, Han J, Park J, Kim DH. Promoter methylation of retinoic acid receptor beta 2 and the development of second primary lung cancers in non-small-cell lung cancer. J Clin Oncol. 2004; 22: 3443–50. https://doi.org/10.1200/JCO.2004.11.135.
30. Ørntoft MB, Nielsen HJ, Ørntoft TF, Andersen CL. Performance of the colorectal cancer screening marker Sept9 is influenced by age, diabetes and arthritis: a nested case–control study. BMC Cancer. 2015; 15: 819. https://doi.org/10.1186/s12885-015-1832-6.
31. Dienstmann R, Vermeulen L, Guinney J, Kopetz S, Tejpar S, Tabernero J. Consensus molecular subtypes and the evolution of precision medicine in colorectal cancer. Nat Rev Cancer. 2017; 17: 79–92. https://doi.org/10.1038/nrc.2016.126.
32. Spindler KL, Pallisgaard N, Vogelius I, Jakobsen A. Quantitative cell-free DNA, KRAS, and BRAF mutations in plasma from patients with metastatic colorectal cancer during treatment with cetuximab and irinotecan. Clin Cancer Res. 2012; 18: 1177–85. https://doi.org/10.1158/1078-0432.CCR-11-0564.
33. Patterson K, Molloy L, Qu W, Clark S. DNA methylation: bisulphite modification and analysis. J Vis Exp. 2011. https://doi.org/10.3791/3170.
34. Pedersen IS, Krarup HB, Thorlacius-Ussing O, Madsen PH. High recovery of cell-free methylated DNA based on a rapid bisulfite-treatment protocol. BMC Mol Biol. 2012; 13: 12. https://doi.org/10.1186/1471-2199-13-12.
35. Holdenrieder S, Von Pawel J, Nagel D, Stieber P. Long-term stability of circulating nucleosomes in serum. Anticancer Res. 2010; 30: 1613–5.
36. Sozzi G, Roz L, Conte D, Mariani L, Andriani F, Verderio P, Pastorino U. Effects of prolonged storage of whole plasma or isolated plasma DNA on the results of circulating DNA quantification assays. J Natl Cancer Inst. 2005; 97: 1848–50. https://doi.org/10.1093/jnci/dji432.
37. Ignatiadis M, Dawson SJ. Circulating tumor cells and circulating tumor DNA for precision medicine: dream or reality? Ann Oncol. 2014; 25: 2304–13. https://doi.org/10.1093/annonc/mdu480.
38. Rhoads A, Au KF. PacBio sequencing and its applications. Genomics Proteomics Bioinformatics. 2015; 13: 278–89. https://doi.org/10.1016/j.gpb.2015.08.002.
39. Tornby Stender M, Brøndum Frøkjær J, Sandie Hagedorn Nielsen T, Bjerregaard Larsen T, Lundbye-Christensen S, Elbrønd H, Thorlacius-Ussing O. Combined use of clinical pre-test probability and D-dimer test in the diagnosis of preoperative deep venous thrombosis in colorectal cancer patients. Thromb Haemost. 2008; 99: 396–400. https://doi.org/10.1160/TH07-06-0397.
40. Jespersen J, Bertina R, Haverkate F. Laboratory Techniques in Thrombosis – A Manual. 2nd revised edition of ECAT Assay Procedures. Kluwer Academic Publishers. 1999.