
INTRODUCTION
Hepatocellular carcinoma (HCC), the predominant primary tumor of the liver, is the second most common contributor to cancer-related death at present globally [1–3]. The considerably high mortality rate of liver tumor seriously threatens humanity, where 40,710 of the estimated new liver cancer cases in the United States in 2017 [4]. Although surgical resection technology or transplantation rapidly improved, the 5-year survival rate of HCC patients remains relatively low [5, 6]. The dismal clinical outcome of HCC is in part driven by the delay in diagnosis and the still-rudimentary prognosis monitoring [7]. Hepatocarcinogenesis is heterogeneous and contains a multi-step process, including genetic and epigenetic factors that forms its unique molecular fingerprint. Therefore, extensive analyses for identifying reliable biomarkers with prognostic significance that target major oncogenes in HCC is imperative.
Autophagy is a fundamental cell-physiologic regulator to ensure intracellular quality control, similar to apoptosis, energy production and waste removal [8, 9]. Given the prominent functions of autophagy, it is closely associated with diverse human pathologies, such as immune disorders [10, 11], neurodegenerative diseases [12, 13] and cancers [14, 15]. Oftentimes, compared with their normal counterparts, tumor cells are metabolically reprogrammed when several growth-promoting pathways are disturbed to obtain sufficient energy or additional stimuli to master of their own destinies. Interestingly, autophagy probably is present in both cancer and in cancer prevention, as well as potentially contributing to the growth of cancer. Additionally, its roles during the course of various tumors progression, including HCC [16], are variable. However, subtle mechanisms of autophagy in HCC are perplexing and have not been fully understood until now [17]. For the dynamic and fundamental role of autophagy in HCC, the prognostic signatures and therapeutic targets of autophagy-related genes could show promise for understanding the genetic control mechanisms of HCC and offering promising targets. Recently, several studies have been proposed to identify autophagy-related prognostic signature in pancreatic ductal adenocarcinoma [18] and gliomas [19]. However, potential autophagy-related prognostic biomarkers for HCC are still urgently needed.
Due to the recent advances in RNA sequencing (RNA-Seq) technology and several public databases, such as The Cancer Genome Atlas (TCGA, https://cancergenome.nih.gov/) and Gene Expression Omnibus (GEO, http://www.ncbi.nlm.nih.gov/geo/), it is feasible to identify several genes that can predict the clinical outcomes of HCC patients based on the expression profiles. In the present study, we first extracted autophagy-related genes from The Human Autophagy Database (HADb, http://www.autophagy.lu/index.html), which provides an informative and up-to-date list of human genes involved in autophagy directly or indirectly. [20] Additionally, we calculated and obtained a series of differentially expressed autophagy-related genes in HCC and elucidated the cellular and molecular characteristics, dynamic role and pathways of these genes in HCC. The highlight was that we placed special emphasis on the prognostic value of autophagy-related genes and constructed a specific prognosis index (PI) that accurately predicted the clinical outcomes of HCC patients. These results were evidently confirmed by comprehensive data sources. Through these means, we proposed the rationale for clinically available prognosis monitoring and new insights into the molecular mechanisms for HCC patients, with particular emphasis on autophagy.
RESULTS
Differentially expressed autophagy-related genes in HCC
A total of 234 genes involved directly or indirectly in autophagy were downloaded via the online database HADb. After extracting expression data of these 234 autophagy-related genes from TCGA, 33 differentially expressed genes in HCC were identified (Figures 1 and 2), which were used for further investigation on their prognostic value. The independent sample t-test demonstrated that 21 genes showed remarkably higher expressions than non-cancerous tissues, including BIRC5, CDKN2A, PEA15, TP73, HSP90AB1, RAB24, ITGA6, CLN3, HGS, DAPK2, BAX, BAK1, NRG2, SQSTM1, TMEM74, IKBKE, SPHK1, ITGB4, ITGA3, IRGM and NKX2-3. Conversely, 9 genes (FOS, FOXO1, DIRAS3, DLC1, NAMPT, JUN, CCL2, MYC and NRG1) had notably lower expressions than the adjacent tissues. (Figures 3 and 4). Due to the discrepancy in calculation, no statistical significance was observed in HSPB8, TP63 and GRID1. Subsequently, ROC analysis was conducted to further investigate the ability of these genes to distinguish cancerous tissues from the non-cancerous ones. The results showed that the AUC value of 24 genes was above 0.7 (Figures 5–6), which confirmed that these genes excelled at differentiating between cancerous and non-cancerous tissues.
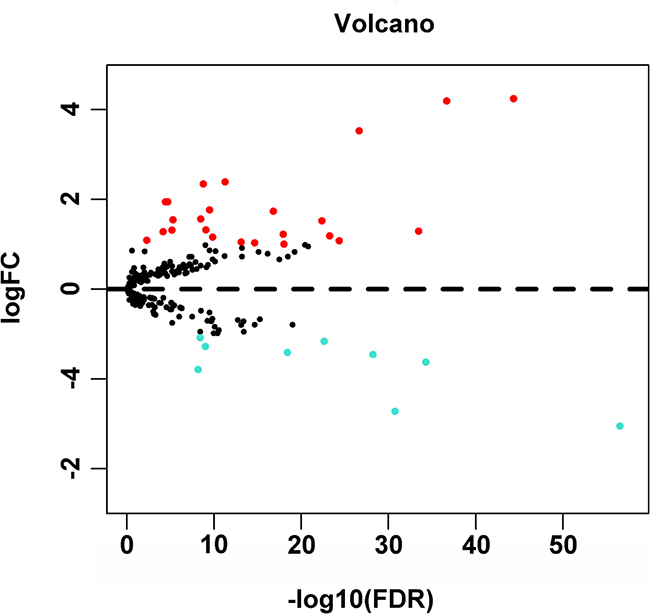
Figure 1: Volcano plot of the differentially expressed autophagy-related genes between HCC and non-tumor tissues. Red dots indicated autophagy-related genes which were high expression in HCC and blue for low expression. This volcano plot was drawn by the ggplot2 package of R language.
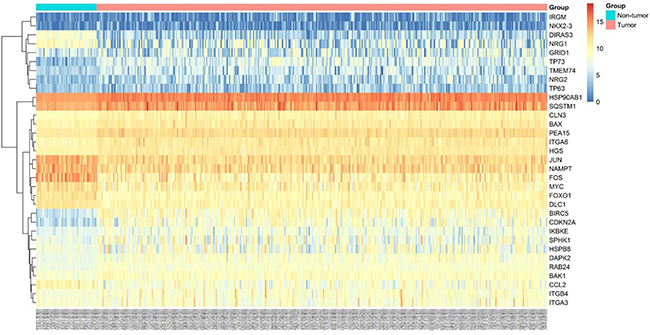
Figure 2: Heatmaps of 33 differently expressed autophagy-related genes. Heatmap displayed the expression level of 33 differently expressed autophagy-related genes between HCC and non-tumor tissues. The brighter nodes indicated higher gene expression value while the darker indicated the lower gene expression value.
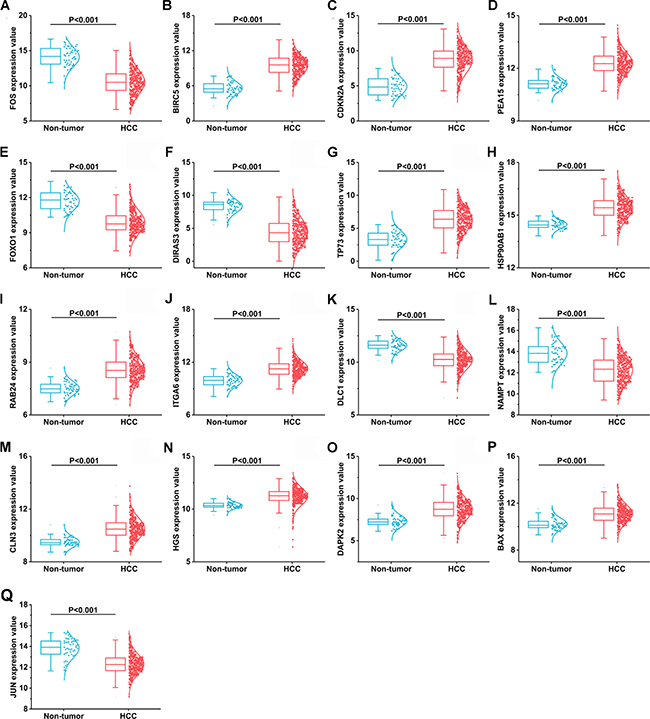
Figure 3: 17 differentially expressed autophagy-related genes based on TCGA databases. (A) FOS, (B) BIRC5, (C) CDKN2A, (D) PEA15, (E) FOXO1, (F) DIRAS3, (G)TP73, (H)HSP90AB1, (I) RAB24, (J) ITGA6, (K) DLC1, (L) NAMPT, (M) CLN3, (N) HGS, (O) DAPK2, (P) BAX, (Q) JUN.
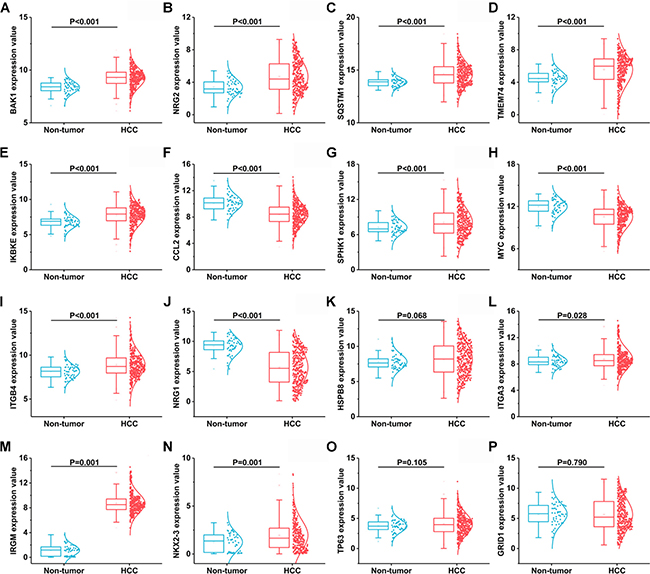
Figure 4: Another 16 differentially expressed autophagy-related genes based on TCGA databases. (A) BAK1, (B) NRG2, (C) SQSTM1, (D) TMEM74, (E) IKBKE, (F) CCL2, (G) SPHK1, (H) MYC, (I) ITGB4, (J) NRG1, (K) HSPB8, (L) ITGA3, (M) IRGM, (N) NIKX2-3, (O) TP63, (P) GRID1.
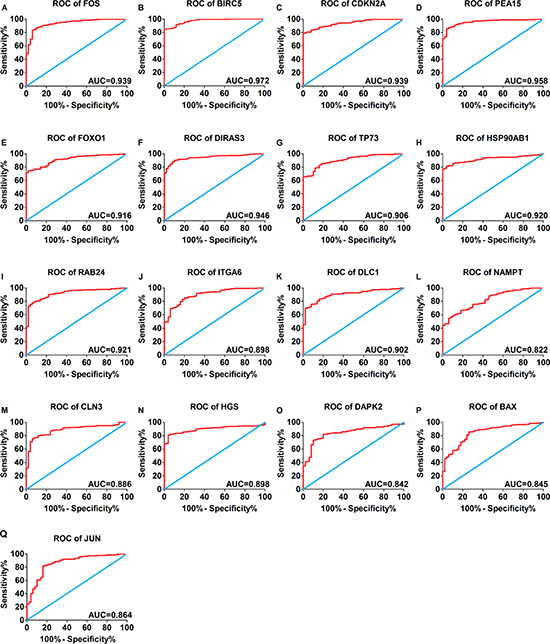
Figure 5: Receiver operating characteristic curves of 17 differentially expressed autophagy-related genes expression for the differentiation of HCC from non-tumor tissues based on TCGA. (A) FOS, (B) BIRC5, (C) CDKN2A, (D) PEA15, (E) FOXO1, (F) DIRAS3, (G)TP73, (H)HSP90AB1, (I) RAB24, (J) ITGA6, (K) DLC1, (L) NAMPT, (M) CLN3, (N) HGS, (O) DAPK2, (P) BAX, (Q) JUN.
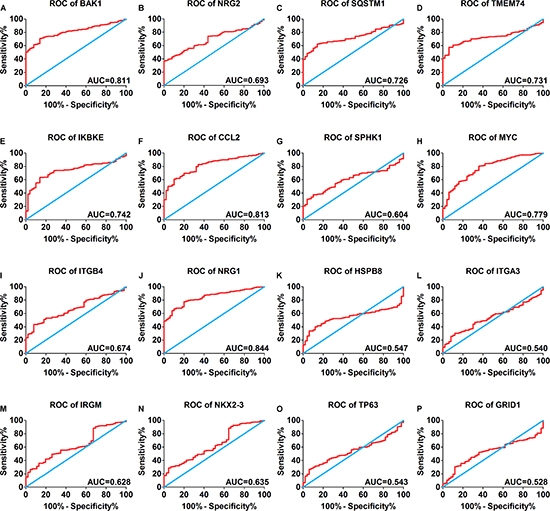
Figure 6: Receiver operating characteristic curves of another 16 differentially expressed autophagy-related genes expression for the differentiation of HCC from non-tumor tissues based on TCGA. (A) BAK1, (B) NRG2, (C) SQSTM1, (D) TMEM74, (E) IKBKE, (F) CCL2, (G) SPHK1, (H) MYC, (I) ITGB4, (J) NRG1, (K) HSPB8, (L) ITGA3, (M) IRGM, (N) NIKX2-3, (O) TP63, (P) GRID1.
Gene-enrichment and functional annotation for differentially expressed autophagy genes in HCC
According to the gene functional annotation summarized by clusterProfiler package of R software, we obtained Gene Ontology (GO), Disease Ontology (DO) and Kyoto Encyclopedia of Genes and Genomes (KEGG) annotations of differently expressed autophagy-related genes in HCC. In the biological process (BP) term of GO analysis, not surprisingly, we found these genes were significantly related to autophagy (Figure 7A; Figure 8A–8B). In cellular component (CC), “autophagosome”, “integrin complex” and “protein complex involved in cell adhesion” were significantly enriched by these genes (Figure 7C; Figure 8C–8D). For molecular function (MF), “sequence-specific binding”, “growth factor binding” and “transcription factor binding” were items for these genes to play important roles (Figure 7E; Figure 8E–8F). Interestingly, DO analysis indicated that these genes were also mainly related to various types of tumors, such as neuroblastoma, colorectal and stomach cancers (Figure 8B; Figure 9A–9B). Do analysis provided us clues that these genes could act as general oncogenes. We also found these genes enriched in several risk KEGG pathways which are relevant to tumor initiation and progression (Figure 7D; Figure 9C–9D).
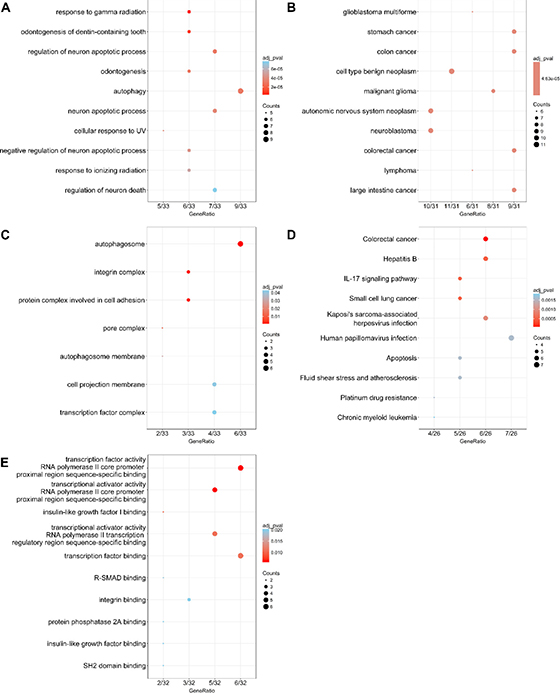
Figure 7: Dot plot of functional enrichment analyses. (A) Biological process; (B) Disease ontology; (C) Cellular component; (D) Kyoto Encyclopedia of Genes and Genomes; (E) Molecular function.
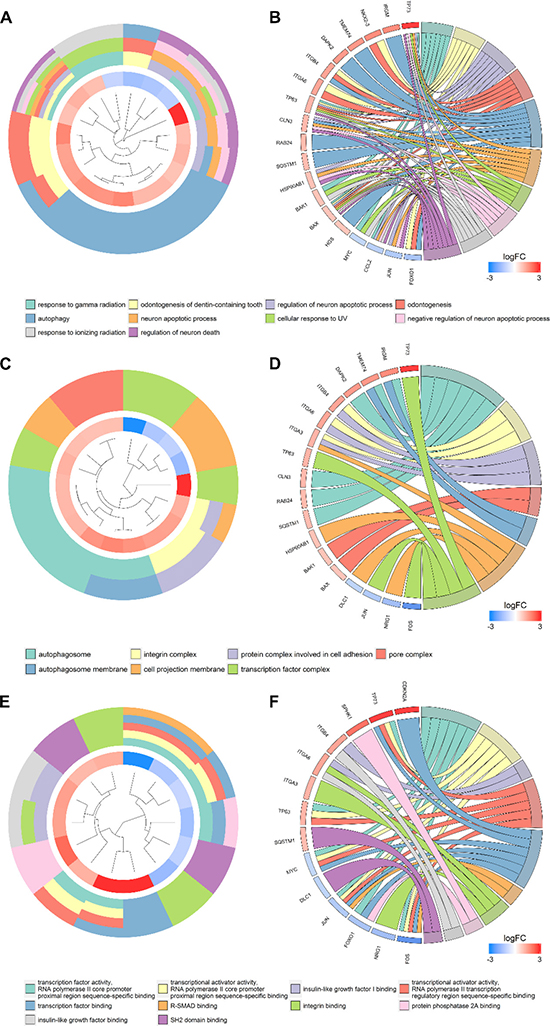
Figure 8: Gene ontology analysis of the differentially expressed genes. Circle plot displaying a circular dendrogram of the clustering of the expression profiles. The inner ring shows the color-coded logFC, the outer ring the assigned biological process (A), cellular component (C) and molecular function (E) terms. Cluster displaying these genes are linked via ribbons to their assigned biological process (B), cellular component (D) and molecular function (F) terms. Blue-to-red coding next to the selected genes indicates logFC.
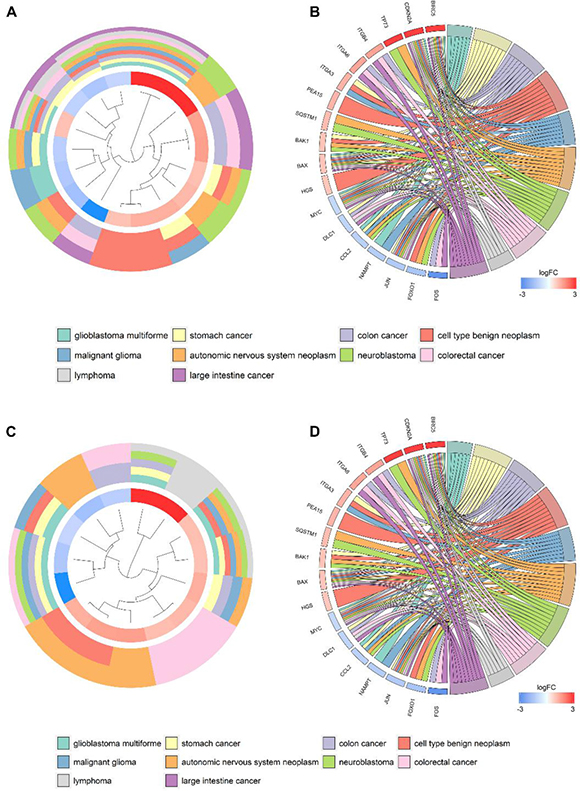
Figure 9: Disease Ontology (DO) and Kyoto Encyclopedia of Genes and Genomes (KEGG) analyses of the differentially expressed genes. Circle plot displaying a circular dendrogram of the clustering of the expression profiles. The inner ring shows the color-coded logFC, the outer ring the assigned DO (A) and KEGG (C) terms. Cluster displaying these genes are linked via ribbons to their assigned DO (B) and KEGG (D) terms. Blue-to-red coding next to the selected genes indicates logFC.
Autophagy-related prognosis index and clinicopathological parameters
After we removed the patients without sufficient survival data, a final cohort of 371 HCC patients in TCGA was used for prognosis evaluation. The univariate Cox analysis revealed that 6 genes including BIRC5, FOXO1, DLC1, SQSTM1, BAK1 and IKBKE had a prognostic value for HCC (Figure 10). Subsequently, multivariate Cox analysis was conducted and BIRC5, FOXO1 and SQSTM1 were screened as independent prognostic indicators for overall survival (OS) of HCC (Figure 11A–11C; Supplementary Table 1).
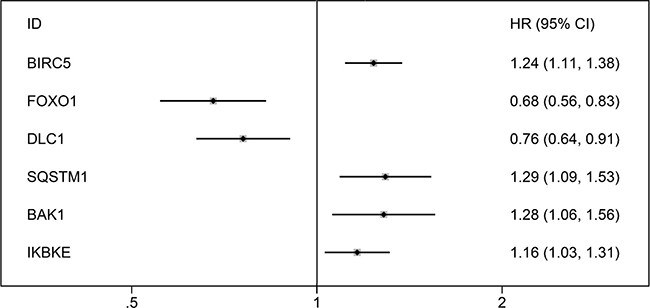
Figure 10: Forrest plots of hazard ratios of survival associated autophagy-related genes in HCC. The order is arranged in terms of P values.
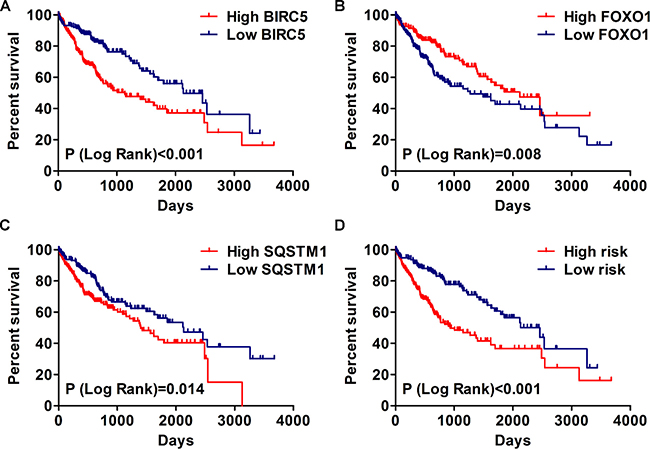
Figure 11: The correlation between prognosis index and HCC patients’ survival. (A) Kaplan–Meier (K-M) analysis represented that patients in higher BIRC5 group had significantly shorter overall survival (OS) time than those in lower BIRC5 group. (B) K-M analysis represented that patients in higher FOXO1 group had significantly longer OS time than those in lower FOXO1 group. (C) K-M analysis represented that patients in higher SQSTM1 group had significantly shorter OS time than those in lower SQSTM1 group. (D) K-M analysis represented that patients in high-risk group had significantly shorter OS time than those in low-risk group.
Furthermore, t-test analyses indicated that the three genes were differentially expressed in various clinicopathological parameters. As shown in Table 1, differential BIRC5 expression was found at different tumor status, pathological stages, histological grades, T stages and vascular tumor cell types. Differential expression of FOXO1 was observed in different histological grades and vascular tumor cell types. For SQSTM1, it showed different expression in terms of age, gender and vascular tumor cell type.
Table 1: Relationships between three genes expression and clinical parameters in TCGA
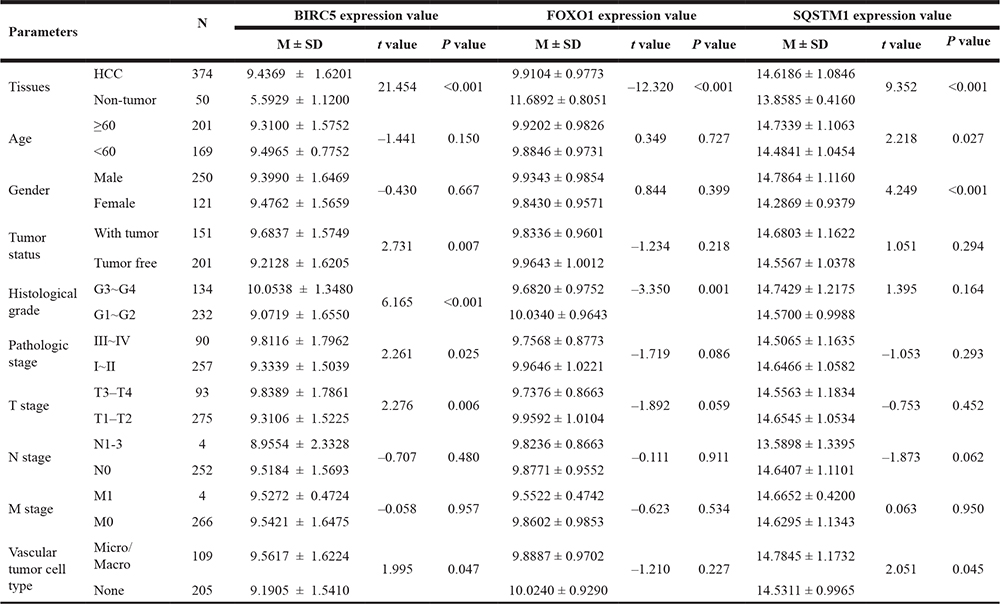
M ± SD: Mean ± Std. Deviation.
Then, we generated a risk score model PI for predicting OS based on the three genes (Figure 12) using the formula: PI = (1.242 * expression level of BIRC5) + (–1.619 * expression level of FOXO1) + (2.214 * expression level of SQSTM1). Then, the PI significantly stratified each HCC patients into high-risk (n = 186) or low-risk (n = 185) groups in terms of the OS (HR = 2.179, 95% CI: 1.537–3.089, P < 0.001; Figure 11D). Multivariate analysis demonstrated a consistent HR of 1.930 (95% CI: 1.200–3.104, P = 0.007, Table 2), which verified that the PI composed of the three genes remained as an independent prognostic indicator for the OS of HCC patients. When the HCC patients were stratified by pathological stage, the PI remained a high prognostic value for stage I/II (HR = = 2.280, 95CI%:1.461–3.558, P < 0.001; Figure 13A) and stage III/IV (HR = 1.720, 95CI%:0.953–3.105, P = 0.072; Figure 13B). When restricted to HCC patients with histological grades, a higher PI was still relevant with patients in G1/G2 (HR = 2.121, 95CI%:1.333–3.377, P = 0.002; Figure 13C) and G3/G4 (HR = 2.269, 95CI%:1.273–4.044, P = 0.006; Figure 13D). We also assessed the expression pattern of the three genes between the high–and low-risk groups. The results of data analysis showed that a remarkably higher expression for BIRC5 and SQSTM1 in the high-risk groups, while they had lower expression for FOXO1 in the high-risk groups (Figure 14).
Table 2: Univariate and multivariate analyses of OS in HCC patients of TCGA
Variables |
Univariate analysis |
Multivariate analysis |
||
|---|---|---|---|---|
Hazard ratio (95% CI) |
P value |
Hazard ratio (95%CI) |
P value |
|
Age (≥60/<60) |
1.212 (0.854–1.720) |
0.281 |
||
Gender (male/female) |
0.817 (0.573–1.164) |
0.262 |
||
Pathologic stage (III–IV/I–II) |
2.446 (1.687–3.545) |
<0.001 |
1.492 (0.203–10.938) |
0.694 |
Tumor (T3–T4/T1–T2) |
2.537 (1.783–3.609) |
<0.001 |
1.517 (0.206–11.164) |
0.682 |
Lymph node metastasis(yes/no) |
1.999 (0.490–8.161) |
0.334 |
||
Distant metastasis (yes/no) |
4.033 (1.267–12.834) |
0.018 |
1.019 (0.241–4.313) |
0.979 |
Histologic grade (G3–G4/G1–G2) |
1.119 (0.780–1.604) |
0.542 |
||
Tumor status (with tumor/tumor free) |
2.366 (1.623–3.447) |
<0.001 |
1.972 (1.236–3.148) |
0.004 |
Vascular tumor cell type (Micro+Macro/None) |
1.351 (0.892–2.047) |
0.155 |
||
PI (High risk/Low risk) |
2.175 (1.522–3.108) |
<0.001 |
1.930 (1.200–3.104) |
0.007 |
PI: prognosis index.
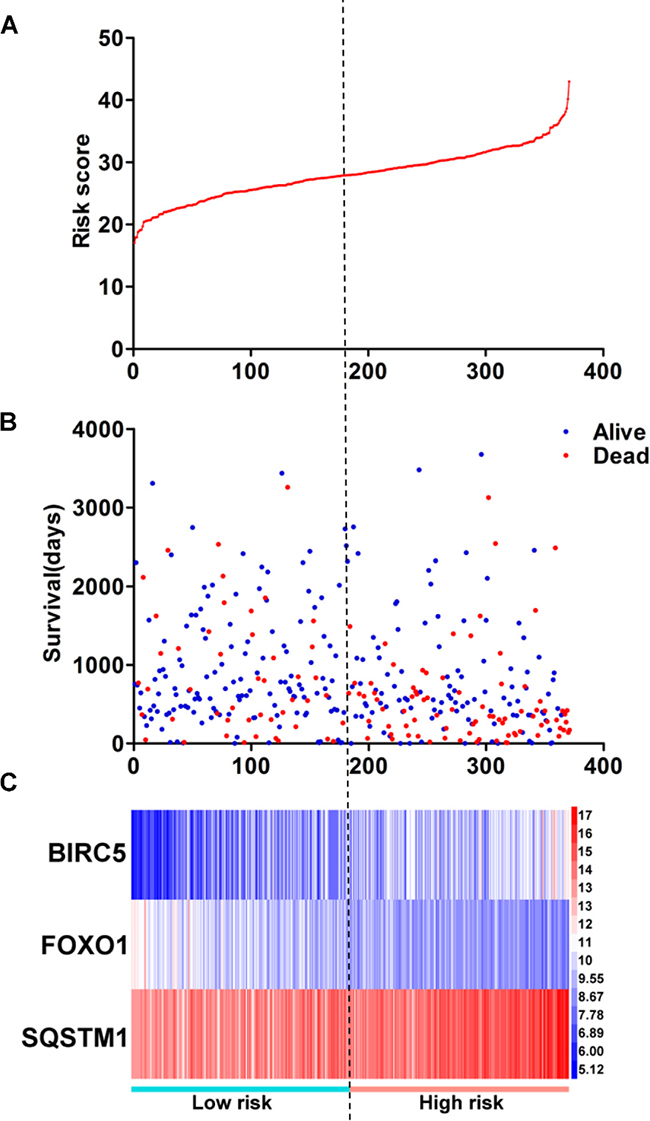
Figure 12: Prognosis index for HCC patients. (A) The low and high score group for the prognosis index in HCC patients; (B) The survival status and duration of HCC cases; (C) Heatmap of the three genes expression in HCC. The color from blue to red shows a trend from low expression to high expression.
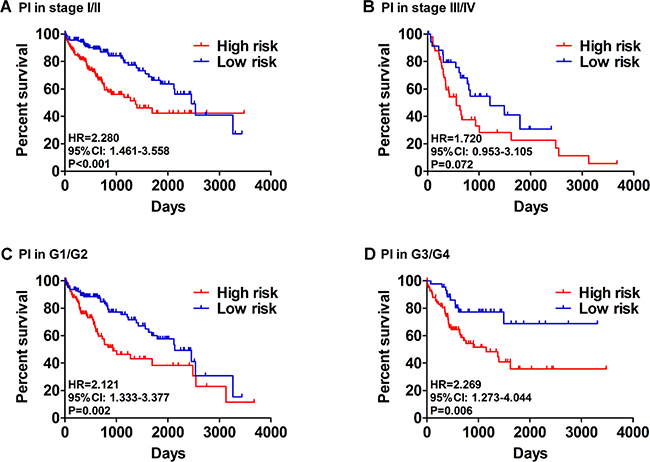
Figure 13: Patients were stratified by prognosis index (high- and low- risk). (A) Overall survival (OS) among HCC patients with stage I and II. (B) OS among HCC patients with stage III and IV. (C) OS among HCC patients with stage I and II. (D) OS among HCC patients with stage I and II.
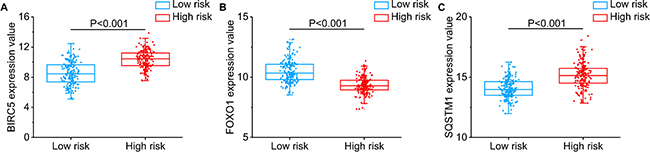
Figure 14: Different expression of the three genes between high risk group and low risk group. (A) BIRC5, (B) FOXO1, (C) SQSTM1.
Validation of PI as an effective prognostic factor
The online bioinformatics tool SurvExpress provides the differences in mRNA expression levels to draw Kaplan–Meier curves and to classify risk groups. Groups with low and high expression are represented by green and red, respectively. SurvExpress contained two datasets with OS data (GSE10143, N = 162 and GSE10186, N = 112) and 1 dataset with recurrence free survival (RFS; GSE17856, N = 95) data. We first exhibited the expression pattern of these 3 genes (Figure 15A, 16A, 17A) and clinical information of patients included in datasets (Figure 15B, 16B, 17B). And then, similar to from the strategy of TCGA data dealing, patients in the three datasets from GEO were stratified into high- or low-risk groups by PI signature (Figures 15C–15D, 16C–16D, 17C–17D). For GSE10143 cohort, patients in high-risk group had inferior OS than patients in low-risk group (HR = 1.95, 95% CI = 0.95–2.65, P = 0.075; Figure 15E–15F). For GSE10186 cohort, patients in high-risk group also had inferior OS than patients in low-risk group (HR = 2.07, 95% CI = 0.99–4.32, P = 0.053; Figure 16E–16F). In the GSE17856 cohort, PI could function as an indicator for the RFS of HCC patients. (HR = 2.12, 95% CI = 1.01–4.41, P = 0.046; Figure 17E–17F). These findings provided a valuable message that combination of these three genes could act as an indicator of prognosis monitoring with moderate degree.
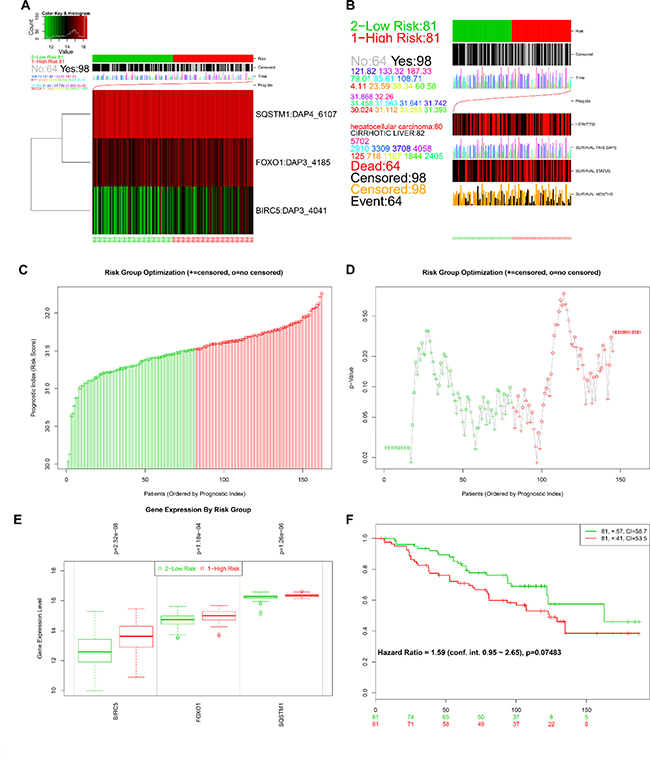
Figure 15: Evaluation of prognosis index in the survival of HCC patients in GSE10143 database. (A) A heatmap representation of the gene expression values. (B) Clinical information available related to risk group, prognosis index (PI) and clinical outcome. (C) The low and high score group for the PI in HCC patients. (D) A box plot across risk groups ordered by PI. (E) Different expression of the three genes between high risk group and low risk group. (F) Kaplan-Meier analysis represented that patients in high-risk group had shorter overall time than those in low-risk group.
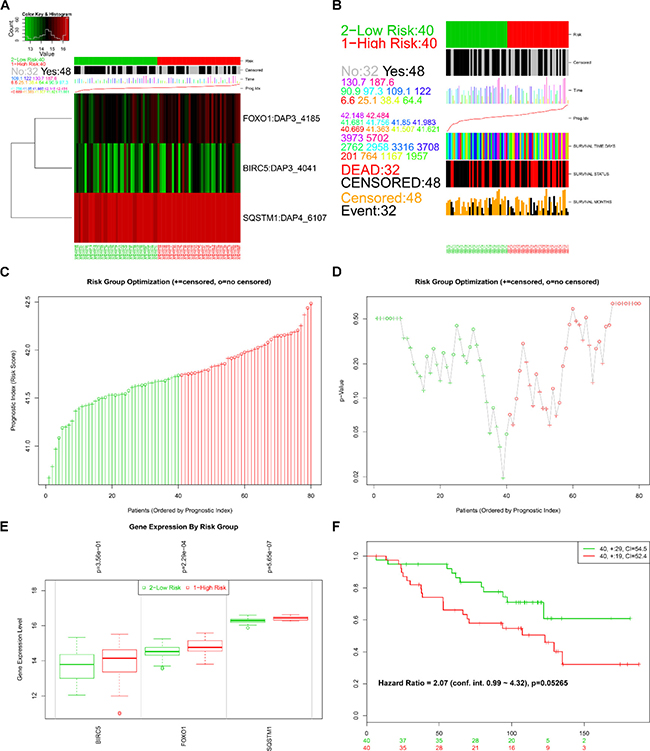
Figure 16: Evaluation of prognosis index in the survival of HCC patients in GSE10186 database. (A) A heat map representation of the gene expression values. (B) Clinical information available related to risk group, prognosis index (PI) and clinical outcome. (C) The low and high score group for the PI in HCC patients. (D) A box plot across risk groups ordered by PI. (E) Different expression of the three genes between high risk group and low risk group. (F) Kaplan-Meier analysis represented that patients in high-risk group had shorter overall time than those in low-risk group.
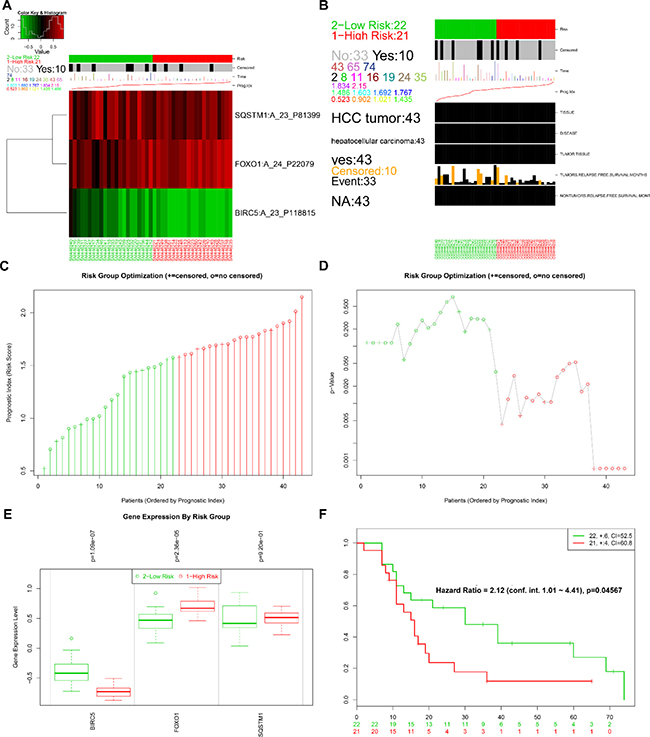
Figure 17: Evaluation of prognosis index in the survival of HCC patients in GSE17856 database. (A) A heat map representation of the gene expression values. (B) Clinical information available related to risk group, prognosis index (PI) and clinical outcome. (C) The low and high score group for the PI in HCC patients. (D) A box plot across risk groups ordered by PI. (E) Different expression of the three genes between high risk group and low risk group. (F) Kaplan-Meier analysis represented that patients in high-risk group had shorter relapse free survival time than those in low-risk group.
Expression profiling of identified prognostic genes
After searching and selecting HCC-related datasets in the GEO, a total of 34 GEO datasets were used to identify the expression pattern of BIRC5, FOXO1 and SQSTM1. The characteristics of included datasets were shown in Table 3. After integrating the TCGA data and these datasets by using Standardized Mean Difference (SMD), we found that the BIRC5 expression level was significantly increased in the tumor group (SMD = 1.52, 95% CI: 1.23–1.83, P < 0.001; Figure 18) when using the random-effects model. And FOXO1 was validated to be lower in HCC (SMD = –1.04, 95% CI: –1.32–(–0.76), P < 0.001; Figure 19) when using the random-effects model. For SQSTM1, its expression level was significantly upregulated in tumor group (SMD = 1.19, 95% CI: 1.00–1.37, P < 0.001; Figure 20). Moreover, remarkable overexpression of BIRC5 and SQSTM1 and opposite expression of FOXO1 protein in HCC was confirmed by Proteinatlas (Figure 21).
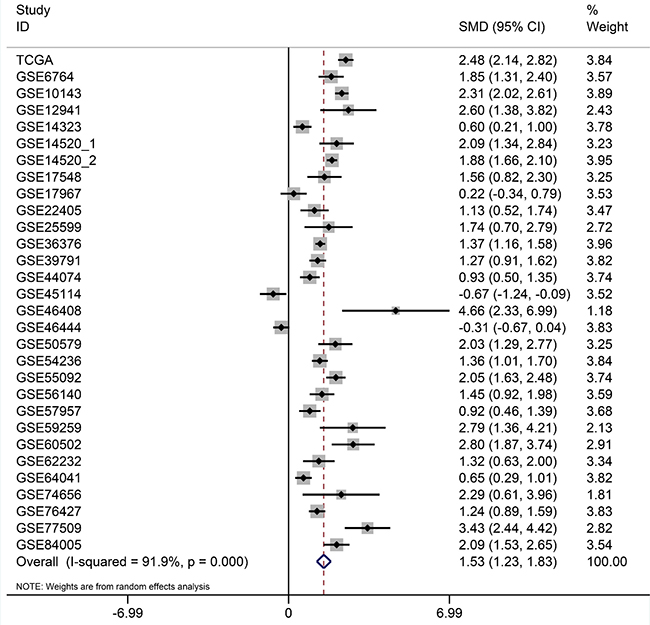
Figure 18: Forest plots for meta-analysis of evaluating BIRC5 expression between HCC and non-tumor tissues. SMD and associated 95% confidence interval were calculated using the random effects model.
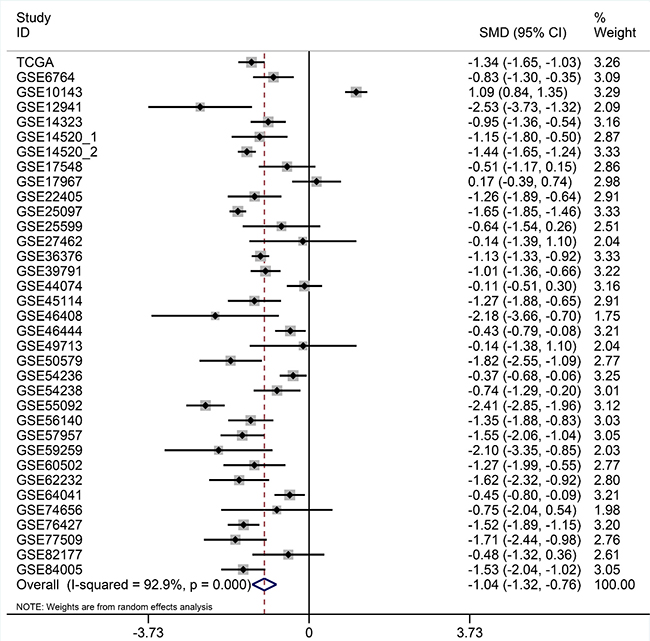
Figure 19: Forest plots for meta-analysis of evaluating SQSTM1 expression between HCC and non-tumor tissues. SMD and associated 95% confidence interval were calculated using the random effects model.
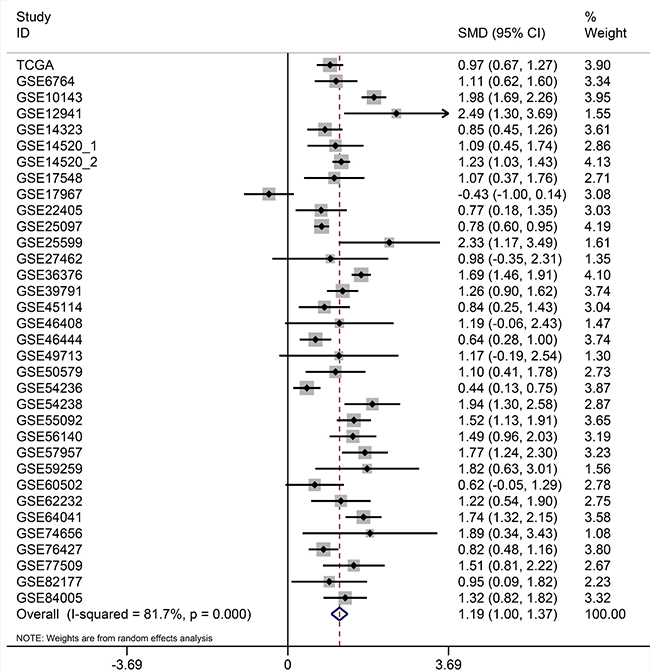
Figure 20: Forest plots for meta-analysis of evaluating SQSTM1 expression between HCC and non-tumor tissues. SMD and associated 95% confidence interval were calculated using the random effects model.
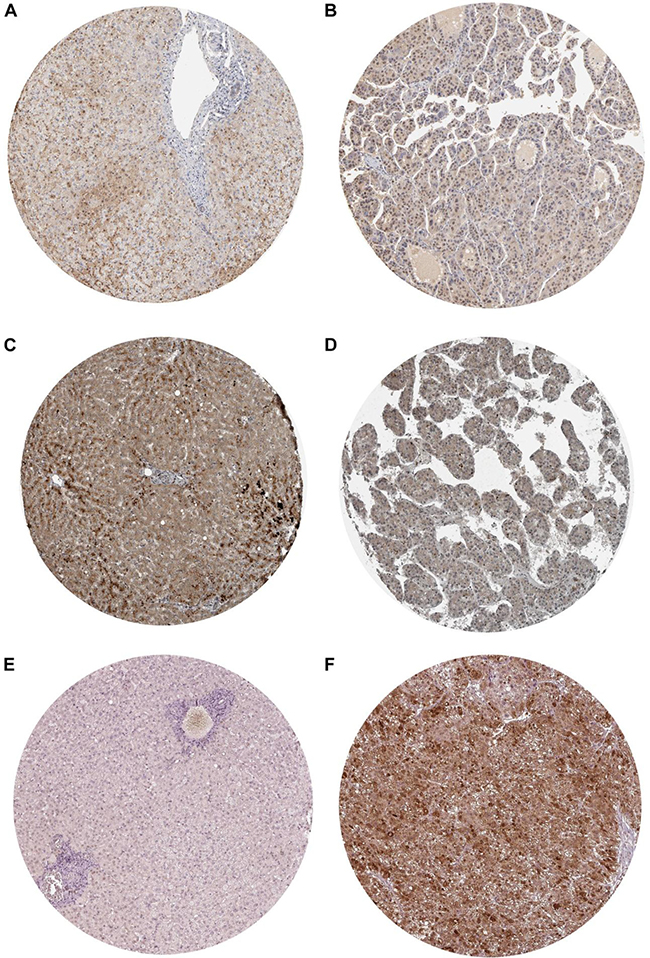
Figure 21: Validation of the protein expression of BIRC5, FOXO1 and SQSTM1 in HCC by Immunohistochemistry based on proteinatlas database. (A) IHC staining of BIRC5 in normal liver Magnification: 200um; Antibody: HPA002830. (B) IHC staining of BIRC5 in hepatocellular carcinoma. Magnification: 200um; Antibody: HPA002830. (C) IHC staining of FOXO1 in normal liver. Magnification: 200um; Antibody: CAB022326. (D) IHC staining of FOXO1 in hepatocellular carcinoma. Magnification: 200um; Antibody: CAB022326. (E) IHC staining of SQSTM1 in normal liver. Magnification: 200um; Antibody: CAB004587. (F) IHC staining of SQSTM1 in hepatocellular carcinoma. Magnification: 200um; Antibody: CAB004587.
Table 3: General characteristics of included datasets
Dataset |
First author |
Publication year |
Country |
Sample source |
Data source |
Platform |
Number of HCC samples |
Number of non-tumor samples |
|---|---|---|---|---|---|---|---|---|
GSE6764 |
Wurmbach E et al. |
2007 |
USA |
Tissue |
GEO |
Affymetrix GPL570 |
35 |
40 |
GSE10143 |
Hoshida Y et al. |
2008 |
USA |
Tissue |
GEO |
Illumina GPL5474 |
80 |
307 |
GSE12941 |
Yamada T et al. |
2010 |
Japan |
Tissue |
GEO |
Affymetrix GPL5175 |
10 |
10 |
GSE14321 |
Mas VR et al. |
2009 |
USA |
Tissue |
GEO |
Affymetrix GPL571 |
38 |
77 |
GSE14520_1 |
Roessler S et al. |
2010 |
USA |
Tissue |
GEO |
Affymetrix GPL571 |
22 |
21 |
GSE14520_2 |
Roessler S et al. |
2010 |
USA |
Tissue |
GEO |
Affymetrix GPL3921 |
225 |
220 |
GSE17548 |
Ozturk M et al. |
2013 |
Turkey |
Tissue |
GEO |
Affymetrix GPL570 |
17 |
20 |
GSE17967 |
Archer KJ et al. |
2009 |
USA |
Tissue |
GEO |
Affymetrix GPL571 |
16 |
47 |
GSE22405 |
Zhang HH et al. |
2014 |
USA |
Tissue |
GEO |
Affymetrix GPL10553 |
24 |
24 |
GSE25097 |
Zhang C et al. |
2011 |
USA |
Tissue |
GEO |
Rosetta GPL10687 |
268 |
289 |
GSE25599 |
Xing J et al. |
2013 |
China |
Tissue |
GEO |
Illumina GPL9052 |
10 |
10 |
GSE27462 |
Yang F et al. |
2011 |
China |
Tissue |
GEO |
Arraystar GPL11269 |
5 |
5 |
GSE36376 |
Lim HY et al. |
2012 |
South Korea |
Tissue |
GEO |
Illumina GPL10558 |
240 |
193 |
GSE39791 |
Kim J et al. |
2014 |
USA |
Tissue |
GEO |
Illumina GPL10558 |
72 |
72 |
GSE44074 |
Ueda T et al. |
2013 |
Japan |
Tissue |
GEO |
Kanazawa GPL13536 |
34 |
71 |
GSE45114 |
Wei L et al. |
2013 |
China |
Tissue |
GEO |
CapitalBio GPL5918 |
24 |
25 |
GSE46408 |
Jeng Y et al. |
2013 |
Taiwan |
Tissue |
GEO |
Agilent GPL4133 |
6 |
6 |
GSE46444 |
Chen X et al. |
2014 |
USA |
Tissue |
GEO |
Illumina GPL13369 |
88 |
48 |
GSE49713 |
Wang K et al.. |
2013 |
China |
Tissue |
GEO |
Arraystar GPL11269 |
5 |
5 |
GSE50579 |
Geffers R et al. |
2013 |
Germany |
Tissue |
GEO |
Agilent GPL14550 |
67 |
10 |
GSE54236 |
Villa E et al. |
2014 |
Italy |
Tissue |
GEO |
Agilent GPL6480 |
81 |
80 |
GSE54238 |
Yuan S et al. |
2014 |
USA |
Tissue |
GEO |
Arraystar GPL16955 |
26 |
30 |
GSE55092 |
Melis M et al. |
2014 |
USA |
Tissue |
GEO |
Affymetrix GPL570 |
49 |
91 |
GSE56140 |
Hoshida Y et al. |
2014 |
USA |
Tissue |
GEO |
Illumina GPL18461 |
35 |
34 |
GSE57957 |
Mah W et al. |
2014 |
Singapore |
Tissue |
GEO |
Illumina GPL10558 |
39 |
39 |
GSE59259 |
Udali S et al. |
2015 |
Italy |
Tissue |
GEO |
NimbleGen PL18451 |
8 |
8 |
GSE60502 |
Kao KJ et al. |
2015 |
Taiwan |
Tissue |
GEO |
Affymetrix GPL96 |
18 |
18 |
GSE62232 |
Zucman-Rossi J et al. |
2014 |
France |
Tissue |
GEO |
Affymetrix GPL570 |
81 |
10 |
GSE64041 |
Makowska Z et al. |
2016 |
Switzerland |
Tissue |
GEO |
Affymetrix GPL6244 |
60 |
65 |
GSE74656 |
Tao Y et al. |
2015 |
China |
Tissue |
GEO |
Affymetrix GPL16043 |
5 |
5 |
GSE76427 |
Grinchuk OV et al. |
2017 |
Singapore |
Tissue |
GEO |
Illumina GPL10558 |
115 |
52 |
GSE77509 |
Jin G et al. |
2017 |
China |
Tissue |
GEO |
Illumina GPL16791 |
20 |
20 |
GSE82177 |
Wijetunga NA et al. |
2016 |
USA |
Tissue |
GEO |
Illumina GPL11154 |
8 |
19 |
GSE84005 |
Tu X et al. |
2017 |
China |
Tissue |
GEO |
Affymetrix PL5175 |
38 |
38 |
Identification of clinical significances by in-house immunohistochemistry
BIRC5, FOXO1 and SQSTM1 protein expression level were detected by immunohistochemistry (IHC) in 302 HCC tissues and in 41 non-tumor tissues. For BIRC5, 97 samples (32.12%) were assigned to the positive group and 205 cases (67.88%) were assigned to the negative group according to the immunoreactive score (IRS) of the tissue samples (Figure 22C–22D). In non-tumor tissues, 2 samples (4.9%) were exhibited positive BIRC5 expression, and 39 (95.12%) were negative (Figure 22A–22B). HCC and non-tumor tissues exerted statistical difference in BIRC5 protein expression (P < 0.001). Similarly, the IHC results of SQSTM1 also confirmed its higher expression in HCC tissues. A total of 152 (50.33%) HCC tissues were positive while 150 (49.67%) samples were negative (Figure 22K–22L). The positive rate was significantly higher than non-tumor tissues (P = 0.001), which showed low positive rate (9/41, 21.95%) (Figure 22I–22J). The data of IHC analysis demonstrated that positive FOXO1 expression was detected in 190 of 302 HCC tissues (62.91%) (Figure 22G–22H), whereas 29 of 41 non-tumor tissues (70.73%) showed high FOXO1 expression (Figure 22E–22F). Although there was no significant difference, which may be owed to the limited samples, FOXO1 still showed a high positive rate in non-tumor tissues.
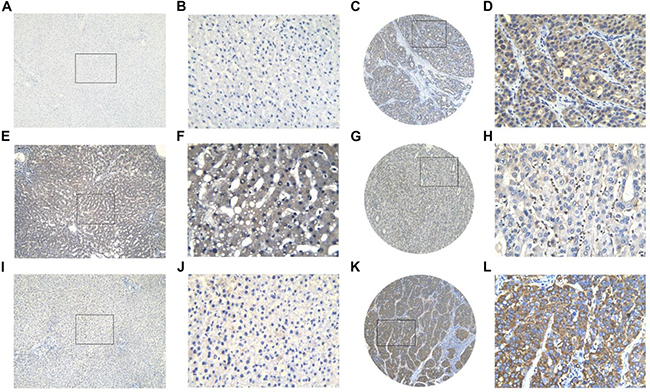
Figure 22: Three protein expression in HCC and non-tumor tissues assessed by immunohistochemistry. BIRC5 showed low expression in non-tumor tissue (A, B) and high expression in HCC tissue (C, D); FOXO1 showed high expression in non-tumor tissue (E, F) and low expression in HCC tissue (G, H); SQSTM1 showed low expression in non-tumor tissue (I, J) and high expression in HCC tissue (K, L). Magnification: ×100 (A, C, E, G, I, K) or ×400 (B, D, F, H, J, L).
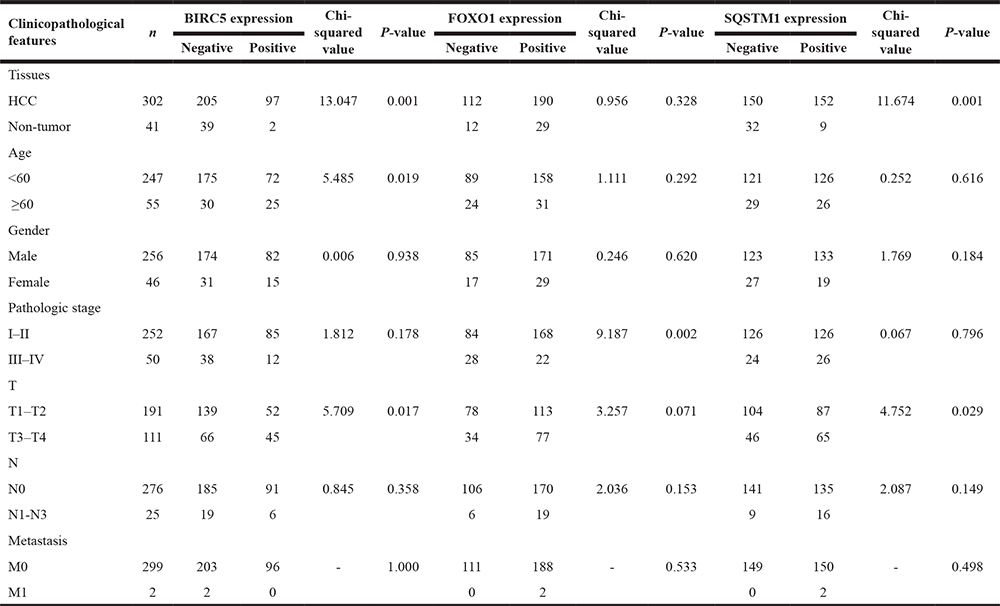
The correlations between these genes expression and clinicopathological features of HCC are presented in Table 4. We observed significant positive correlations between BIRC5 expression and age (P = 0.019) and the pathologic T stage (P = 0.017). Up-regulated SQSTM1 also showed notable relationship with advanced pathologic T stage (P = 0.029). And lower FOXO1 expression was significantly related to advanced TNM stage (P = 0.002).
Table 4: The relationships between prognostic genes expression and clinicopathological features in HCC in-house
Molecular pathways disturbed between high- and low-risk groups
Gene Set Enrichment Analysis was computed to pick up the molecular pathways disturbed between the high- and low-risk groups. According to the results of the GSEA analysis, genes co-expressed in the high-risk group were significantly enriched in the biological pathways associated with the E2F targets, MYC targets and G2M checkpoint (Figure 23).
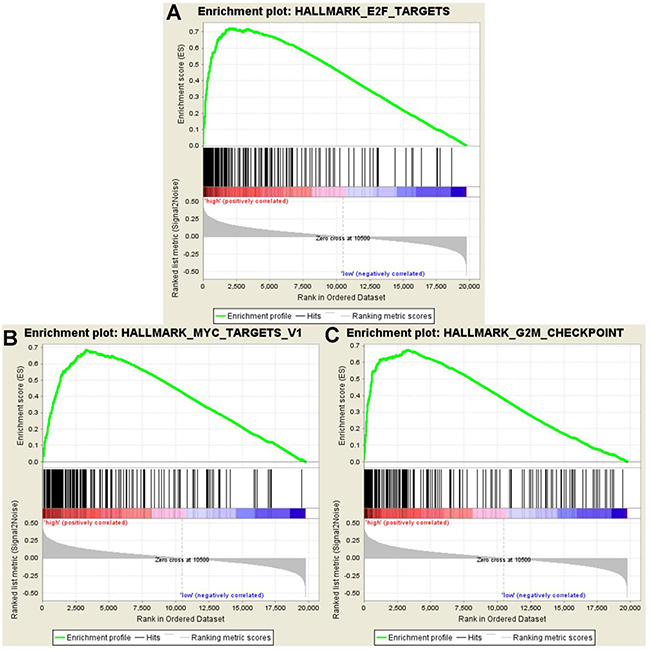
Figure 23: GSEA showed significant enrichment hallmarks in high-risk versus low-risk group. (A) E2F targets, (B) MYC targets, and (C) G2M checkpoints.
DISCUSSION
HCC patients are at risk for frequently returning cancer and high mortality, even after complete surgical debulking. Reliable molecular biomarkers for HCC prognosis prediction are hence significant for selecting patients who might be sensitive to additional targeted therapy. Using RNA-Seq technology, several novel prognostic indicators based on gene expression profiles have been proposed. Nevertheless, most studies only focused on a signal biomarker, which may not yield sufficient results that are inherently unpredictable and risky. In the present study, we constructed a novel prognostic model based on the expression levels of autophagy-related genes. Furthermore, the prognostic signature was effectively validated against multiple distinct datasets.
In recent years, elaborate molecular research for autophagy in tumors has proposed profound changes in our understanding of tumor management. Katheder NS et al. [21] discovered that malignant tumor cells induced autophagy of the surrounding normal cells in the tumor microenvironment and then release amino acids that are absorbed to support tumor growth. The precise mechanism of autophagy in HCC is elusive and changes frequently [22]. Unbalanced autophagy could disturb various vital signaling pathways such as PI3K/AKT/mTOR [23–25], ERK/MAPK [26, 27] and the Wnt/β-catenin [28, 29] and therefore act as an accomplice of malignant hepatocyte to facilitate the HCC progression. In our study, we first identified differentially expressed autophagy-related genes in HCC. Subsequent several gene functional enrichment analyses were performed to assess biological process, disease or pathways influenced by these genes. GO functional enrichment analysis indicated that differentially expressed autophagy-related genes were enriched in autophagy and several proliferation-related biological processes in HCC. KEGG and DO analyzed revealed that dysregulated autophagy-related genes may also play a critical role in the various cancers, which is coincided with other previous studies. These findings suggested that autophagy could be a driver in the process of onset and proliferation of HCC.
Through univariate and multivariate survival analysis, we identified that BIRC5, FOXO1 and SQSTM1 were significantly related with the HCC patients’ overall survival. BIRC5, a member of the anti-apoptosis family, mainly exerted its influence on HCC cells in inhibiting apoptosis [30], promoting proliferation [31], enhancing resistance to radiotherapy and chemotherapy [32] and inducing the tumor stromal angiogenesis [33]. It has been reported that BIRC5 is directly correlated with autophagosome formation and contributed to HCC cells survival [34]. FOXO1 is thought to be a tumor suppressor that is down-regulated in HCC to exert its positive role in reversing the epithelial-to-mesenchymal transition program [35]. However, we still know relatively little about the autophagy-related mechanisms of FOXO1 that control the course of tumorigenesis and tumor development. SQSTM1 is autophagy-adaptor gene and accumulates in autophagy-deficient tumors, including HCC. Its aberrant accumulation and phosphorylation have been a concern in HCC proliferation potency [36, 37] and could represent a potential chemotherapeutic approach against HCC [38, 39]. Our results also evidently corroborated that there are sharp upregulations of BIRC5 and SQSTM1 in HCC while FOXO1 was significantly downregulated by an integrated analytic approach. We then developed a PI based on the expression of the three genes. The prognostic signature related to autophagy may offer broad prospects for modifying clinical management strategies or at least to prolong the lifespan of HCC patients in the precision medicine era. Due to such evidence, PI may also provide a better program for patients treated with a combination of multiply targeted agents.
Our novel risk score model was constructed and displayed the ability to stratify patients in different pathological stages and histological grades into subgroups with two distinct survival outcomes. More importantly, the predictive model was confirmed by GEO datasets. The TCGA program, other large-scale data and IHC results provided a comprehensive and reliable source to assess the molecular features which were most interrelated with the clinical outcomes of HCC patients. In our previous articles, Wang ZH et al. [40] mined RNA-Seq data of HCC patients form the TCGA program and managed to construct a four-lncRNA signature, which was significantly associated with HCC prognosis. Similarly, Li B et al. [41] proposed a three-gene predictive signature BASED ON the expression data of three genes (UPB1, SOCS2 and RTN3). However, both these investigations rely on the TCGA dataset and were unable to validate the efficiency by USING other cohorts. Furthermore, we analyzed from the perspective of autophagy, which could offer more precise information in clinical management. As such, our PI model provided potential directions for survival estimates of HCC and future clinical practice may come in the foreseeable future.
Moreover, GSEA was performed to analyze the coordinate expression of genes between the high- and low-risk group. The hallmarks of high-risk were distinguished from low-risk group, by the E2F targets, MYC targets and G2M checkpoint, which revealed that the prognostic signature might be inclined to sustain chronic proliferation. These hallmarks of the high-risk group fully indicated that the proliferative signals were relatively disturbing. Arguably, the ability to proliferate outside of cell cycle control is a fundamental trait of cancer cells [42]. Tumors are prone to autophagy because of the important role of autophagy in supplying amino acids and fatty acids to meet the needs the survival and proliferation needs of the cell [14].
Thus, in conclusion, we assessed the gene expression profiles data of autophagy-related genes based on the TCGA database and proposed a risk score model which had a moderate efficacy in predicting the OS of HCC patients both in univariate and multivariate survival analysis. These results shown that the autophagy-related genes signature is a promising prognostic indictor and provided a better understanding of autophagy in HCC. However, prospective studies are needed to further verify the clinical utility as well as the biological function of the signature using more experiments.
METHODS
Differently expressed autophagy-related genes
We obtained autophagy-related genes via database HADb. RNA-seq data of autophagy-related genes from each individual and their clinical information was download from the available TCGA database, which containing 374 HCC and 50 adjacent non-tumor tissues. To test for differential expression between HCC and their non-tumor counterparts, the R package edgeR program was analyzed raw count data with the criteria of Padj < 0.05 and the log FC>1. Then, all the data were converted into [log2 (data+1)] for further analysis.
Gene functional annotation
To reveal the biological function and disturbing pathways of these differently expressed autophagy-related genes, we used clusterProfiler package of R software for GO, DO and KEGG pathways [43]. The visualize enrichment maps of annotation analysis results were drawn by R with the “ggplot2” and “GOplot” packages.
Manufacture of potential prognostic signature for HCC
To identify the prognostic genes, these patients were analyzed by univariate Cox proportional hazards regression methods based on expression data as well as the clinicopathological features obtained from TCGA. The procedure was analyzed by using Survival package in R. All statistically significant indicators were selected as candidates for multivariate Cox regression analysis and used to construct the PI score model. The coefficient of each prognostic genes in the risk score model was derived from the corresponding multivariate analysis of these identified indicators. All patients were divided into high-risk or low-risk group based on the median value of the PI, which was calculated according to the expression profiles of the autophagy-related genes and the estimated regression coefficient. PI = expBIRC5*βBIRC5 +expFOXO1*βFOXO1 +expSQSTM1 *ΒSQSTM1.
Verification of the PI via GEO datasets
The online multi-gene biomarkers validation tool SurvExpress (http://bioinformatica.mty.itesm.mx:8080/Biomatec/SurvivaX.jsp) is a gene expression database that includes datasets collected form TCGA and GEO with clinical information. SurvExpress is an online bioinformatics tool to validate the prognostic performance based on a set of genes in various human cancers [44]. Through SurvExpress, we facilitated a Cox regression analysis and separated HCC patients into high- and low- risk groups based on three liver cancer-related datasets: GSE10143, GSE10186 and GSE17856.
Validation for the expression values of genes
HCC-related microarray expression datasets were searched and downloaded from GEO. A computer-aided microarray search was performed by using the following search terms: (malignan* OR cancer OR tumor OR tumour OR neoplas* OR carcinoma) AND (hepatocellular OR liver OR hepatic OR HCC). The eligible datasets were required to match the following criteria: (1) human tissues; (2) proven diagnosis of HCC; (3) measuring the expression of genes included in PI in HCC and their normal counterparts; (4) providing at least three cases of HCC samples. These datasets were used to determine the expression pattern of the genes included in the PI model between HCC and non-tumor tissues. All the relevant data were extracted and presented as the mean ± SD. To give a comprehensive and visual display of our results, integrated analytic approach was implemented in the form of a meta-analysis. SMD was applied as the effect quantity to evaluate the association between the gene expression levels and HCC using the software STATA 12.0 software. SMD > 0 and its 95% CI not crossing the integer 0 suggested that genes are significantly upregulated in HCC. When SMD < 0 and its 95% CI not crossing the integer 0, it indicated genes are significantly downregulated in HCC. We chose a fixed-effect model or random-effect model to pool the SMD across the GEO datasets depending on the Q statistical analysis. What’s more, we also observed the protein expression pattern of the three genes via The Human Protein Atlas detected by immunohistochemistry.
Immunohistochemistry
Two tissue microarrays obtained from Pantomics, Inc. (Richmond, CA) containing a total of 302 HCC samples and 11 non-tumor samples were used for the analysis of the present study. We also collected 30 non-tumor tissues from the First Affiliated Hospital of Guangxi Medical University, People’s Republic of China from January 2016 to November 2017. All the collected tissues are treated under the strict confidentiality and according to appropriate applicable laws that protect the confidentiality of personal information. IHC analysis was performed according to the procedure in the manufacturer’s instruction. The polyclonal rabbit anti-SQSTM1 primary antibody (1:1000 dilution; Abcam, ab207305), monoclonal rabbit anti-SQSTM1 primary antibody (1:300 dilution; Abcam, ab52857) and Rabbit anti-Survivin Monoclonal Antibody (1:80 dilution; ZSGB-BIO, ZA-0530) were used in the IHC analysis. Two pathologists (Yi-wu Dang and Gang Chen) independently evaluated the expression level via the IRS. IRS = (staining intensity) * (percentage of marked tumor cells). For percentage of marked tumor cells: 1–10% positive cells scored 1; 11–50% scored 2; 51–80% scored 3; and >80% positive cells scored 4. Staining intensity was scored as: negative staining (0), weak staining (1), moderate staining (2) and strong staining (3). All of the HCC samples were then divided into positive group (IRS ≥ 6) or negative group (IRS < 6) based on the IRS.
Gene set enrichment analysis
To reveal the meaning of the biological states from the obtained gene expression data between high- and low- risk group, a GSEA (v3.0, Broad Institute, Cambridge, USA) was performed. The phenotype label was set to high-risk versus low-risk. One thousand permutations were conducted to calculate for each analysis. And enrichment map was used for the visualization of the GSEA results. The false discovery rate (FDR) value and normalized enrichment score (NES) were used to identify the hallmarks significantly enriched in each phenotype.
Statistical analysis
All the statistical analyses were conducted using SPSS 22.0 (Chicago, IL, USA) and STATA 12.0 software (StataCorp, College Station, TX, USA). We used R software, OriginPro 2017 software (Northampton, Massachusetts, USA) and GraphPad Prism 5 (San Diego, CA, USA) for diagram drawing. Independent sample t-tests were used to analyze the expression patterns of genes in HCC and the clinicopathological parameters. The survival curves were plotted by Kaplan–Meier (K-M) method, and differences in the survival rates were assessed using the log-rank test. Univariate and multivariate Cox regression analyses were also performed to analyze the independent prognostic value by Survival package of R. All the statistical results were considered to be significant when the p value was less than 0.05.
Abbreviations
BP: biological process; CC: cellular component; CI: confidence interval; DAVID: Database for Annotation, Visualization and Integrated Discovery; DO: Disease ontology; GC: gastric cancer; GEO: Gene Expression Omnibus; GO: gene ontology; GSEA: Gene set enrichment analysis; HADb: Human Autophagy Database; HCC: hepatocellular carcinoma; KEGG: Kyoto Encyclopedia of Genes; MF: molecular function; OS: overall survival; PI: prognosis index; RNA-seq: RNA sequencing; SMD: standard mean deviation; TCGA: The Cancer Genome Atlas.
Author contributions
The study was designed by JM, GC, YH AND HY. PL, YWD and DYW participated in experiments and statistical analysis. PL and RQH wrote the draft and GC, HY, JM AND YH corrected the manuscript. All authors read and approved the final manuscript.
ACKNOWLEDGMENTS
The authors thank the data from HADb, TCGA and GEO databases.
CONFLICTS OF INTEREST
There is no conflicts of interest.
FUNDING
This study was supported by the Guangxi Science and Technology Program (2017), Guangxi Science and Technology Program (AB17195020) and the Fund of National Natural Science Foundation of China (NSFC81060202, NSFC81260222).
REFERENCES
1. Ferlay J, Soerjomataram I, Dikshit R, Eser S, Mathers C, Rebelo M, Parkin DM, Forman D, Bray F. Cancer incidence and mortality worldwide: sources, methods and major patterns in GLOBOCAN 2012. Int J Cancer. 2015; 136: E359–86. https://doi.org/10.1002/ijc.29210.
2. Park JW, Chen M, Colombo M, Roberts LR, Schwartz M, Chen PJ, Kudo M, Johnson P, Wagner S, Orsini LS, Sherman M. Global patterns of hepatocellular carcinoma management from diagnosis to death: the BRIDGE Study. Liver Int. 2015; 35:2155–66. https://doi.org/10.1111/liv.12818.
3. Torre LA, Bray F, Siegel RL, Ferlay J, Lortet-Tieulent J, Jemal A. Global cancer statistics, 2012. CA Cancer J Clin. 2015; 65:87–108. https://doi.org/10.3322/caac.21262.
4. Siegel RL, Miller KD, Jemal A. Cancer Statistics, 2017. CA Cancer J Clin. 2017; 67:7–30. https://doi.org/10.3322/caac.21387.
5. Singal AG, El-Serag HB. Hepatocellular Carcinoma From Epidemiology to Prevention: Translating Knowledge into Practice. Clin Gastroenterol Hepatol. 2015; 13:2140–51. https://doi.org/10.1016/j.cgh.2015.08.014.
6. Bosetti C, Turati F, La Vecchia C. Hepatocellular carcinoma epidemiology. Best Pract Res Clin Gastroenterol. 2014; 28:753–70. https://doi.org/10.1016/j.bpg.2014.08.007.
7. Toyoda H, Kumada T, Tada T, Yama T, Mizuno K, Sone Y, Maeda A, Kaneoka Y, Akita T, Tanaka J. Differences in the impact of prognostic factors for hepatocellular carcinoma over time. Cancer Sci. 2017; 108:2438–44. https://doi.org/10.1111/cas.13406.
8. Ou L, Lin S, Song B, Liu J, Lai R, Shao L. The mechanisms of graphene-based materials-induced programmed cell death: a review of apoptosis, autophagy, and programmed necrosis. Int J Nanomedicine. 2017; 12:6633–46. https://doi.org/10.2147/IJN.S140526.
9. Mizushima N, Komatsu M. Autophagy: renovation of cells and tissues. Cell. 2011; 147:728–41. https://doi.org/10.1016/j.cell.2011.10.026.
10. Yang R, Zhang Y, Wang L, Hu J, Wen J, Xue L, Tang M, Liu Z, Fu J. Correction: Increased autophagy in fibroblast-like synoviocytes leads to immune enhancement potential in rheumatoid arthritis. Oncotarget. 2017; 8:57906. https://doi.org/10.18632/oncotarget.20371.
11. Gukovskaya AS, Gukovsky I, Algul H, Habtezion A. Autophagy, Inflammation, and Immune Dysfunction in the Pathogenesis of Pancreatitis. Gastroenterology. 2017; 153:1212–26. https://doi.org/10.1053/j.gastro.2017.08.071.
12. Moloudizargari M, Asghari MH, Ghobadi E, Fallah M, Rasouli S, Abdollahi M. Autophagy, its mechanisms and regulation: Implications in neurodegenerative diseases. Ageing Res Rev. 2017; 40:64–74. https://doi.org/10.1016/j.arr.2017.09.005.
13. Hu ZY, Chen B, Zhang JP, Ma YY. Up-regulation of autophagy-related gene 5 (ATG5) protects dopaminergic neurons in a zebrafish model of Parkinson’s disease. J Biol Chem. 2017; 292:18062–74. https://doi.org/10.1074/jbc.M116.764795.
14. White E. The role for autophagy in cancer. J Clin Invest. 2015; 125:42–6. https://doi.org/10.1172/JCI73941.
15. Gugnoni M, Sancisi V, Manzotti G, Gandolfi G, Ciarrocchi A. Autophagy and epithelial-mesenchymal transition: an intricate interplay in cancer. Cell Death Dis. 2016; 7: e2520. https://doi.org/10.1038/cddis.2016.415.
16. Liu L, Liao JZ, He XX, Li PY. The role of autophagy in hepatocellular carcinoma: friend or foe. Oncotarget. 2017; 8:57707–22. https://doi.org/10.18632/oncotarget.17202.
17. Yu S, Wang Y, Jing L, Claret FX, Li Q, Tian T, Liang X, Ruan Z, Jiang L, Yao Y, Nan K, Lv Y, Guo H. Autophagy in the “inflammation-carcinogenesis” pathway of liver and HCC immunotherapy. Cancer Lett. 2017; 411:82–9. https://doi.org/10.1016/j.canlet.2017.09.049.
18. Ko YH, Cho YS, Won HS, Jeon EK, An HJ, Hong SU, Park JH, Lee MA. Prognostic significance of autophagy-related protein expression in resected pancreatic ductal adenocarcinoma. Pancreas. 2013; 42:829–35. https://doi.org/10.1097/MPA.0b013e318279d0dc.
19. Zhang H, Lu X, Wang N, Wang J, Cao Y, Wang T, Zhou X, Jiao Y, Yang L, Wang X, Cong L, Li J, Li J, et al. Autophagy-related gene expression is an independent prognostic indicator of glioma. Oncotarget. 2017; 8:60987–1000. https://doi.org/10.18632/oncotarget.17719.
20. Moussay E, Kaoma T, Baginska J, Muller A, Van Moer K, Nicot N, Nazarov PV, Vallar L, Chouaib S, Berchem G, Janji B. The acquisition of resistance to TNFalpha in breast cancer cells is associated with constitutive activation of autophagy as revealed by a transcriptome analysis using a custom microarray. Autophagy. 2011; 7:760–70.
21. Katheder NS, Khezri R, O’Farrell F, Schultz SW, Jain A, Rahman MM, Schink KO, Theodossiou TA, Johansen T, Juhasz G, Bilder D, Brech A, Stenmark H, et al. Microenvironmental autophagy promotes tumour growth. Nature. 2017; 541:417–20. https://doi.org/10.1038/nature20815.
22. Chang Y, Lin J, Tsung A. Manipulation of autophagy by MIR375 generates antitumor effects in liver cancer. Autophagy. 2012; 8:1833–4.
23. Zhang DM, Liu JS, Deng LJ, Chen MF, Yiu A, Cao HH, Tian HY, Fung KP, Kurihara H, Pan JX, Ye WC. Arenobufagin, a natural bufadienolide from toad venom, induces apoptosis and autophagy in human hepatocellular carcinoma cells through inhibition of PI3K/Akt/mTOR pathway. Carcinogenesis. 2013; 34:1331–42. https://doi.org/10.1093/carcin/bgt060.
24. Wang SS, Chen YH, Chen N, Wang LJ, Chen DX, Weng HL, Dooley S, Ding HG. Hydrogen sulfide promotes autophagy of hepatocellular carcinoma cells through the PI3K/Akt/mTOR signaling pathway. Cell Death Dis. 2017; 8: e2688. https://doi.org/10.1038/cddis.2017.18.
25. Kirstein MM, Boukouris AE, Pothiraju D, Buitrago-Molina LE, Marhenke S, Schutt J, Orlik J, Kuhnel F, Hegermann J, Manns MP, Vogel A. Activity of the mTOR inhibitor RAD001, the dual mTOR and PI3-kinase inhibitor BEZ235 and the PI3-kinase inhibitor BKM120 in hepatocellular carcinoma. Liver Int. 2013; 33:780–93. https://doi.org/10.1111/liv.12126.
26. Guo JY, Chen HY, Mathew R, Fan J, Strohecker AM, Karsli-Uzunbas G, Kamphorst JJ, Chen G, Lemons JM, Karantza V, Coller HA, Dipaola RS, Gelinas C, et al. Activated Ras requires autophagy to maintain oxidative metabolism and tumorigenesis. Genes Dev. 2011; 25:460–70. https://doi.org/10.1101/gad.2016311.
27. Elgendy M, Sheridan C, Brumatti G, Martin SJ. Oncogenic Ras-induced expression of Noxa and Beclin-1 promotes autophagic cell death and limits clonogenic survival. Mol Cell. 2011; 42:23–35. https://doi.org/10.1016/j.molcel.2011.02.009.
28. Wang W, Xu L, Liu P, Jairam K, Yin Y, Chen K, Sprengers D, Peppelenbosch MP, Pan Q, Smits R. Blocking Wnt Secretion Reduces Growth of Hepatocellular Carcinoma Cell Lines Mostly Independent of beta-Catenin Signaling. Neoplasia. 2016; 18:711–23. https://doi.org/10.1016/j.neo.2016.10.004.
29. Petherick KJ, Williams AC, Lane JD, Ordonez-Moran P, Huelsken J, Collard TJ, Smartt HJ, Batson J, Malik K, Paraskeva C, Greenhough A. Autolysosomal beta-catenin degradation regulates Wnt-autophagy-p62 crosstalk. EMBO J. 2013; 32:1903–16. https://doi.org/10.1038/emboj.2013.123.
30. Zhang W, Lu Z, Kong G, Gao Y, Wang T, Wang Q, Cai N, Wang H, Liu F, Ye L, Zhang X. Hepatitis B virus X protein accelerates hepatocarcinogenesis with partner survivin through modulating miR-520b and HBXIP. Mol Cancer. 2014; 13: 128. https://doi.org/10.1186/1476-4598-13-128.
31. Sun B, Xu H, Zhang G, Zhu Y, Sun H, Hou G. Basic fibroblast growth factor upregulates survivin expression in hepatocellular carcinoma cells via a protein kinase B-dependent pathway. Oncol Rep. 2013; 30:385–90. https://doi.org/10.3892/or.2013.2479.
32. Liu W, Zhu F, Jiang Y, Sun D, Yang B, Yan H. siRNA targeting survivin inhibits the growth and enhances the chemosensitivity of hepatocellular carcinoma cells. Oncol Rep. 2013; 29:1183–8. https://doi.org/10.3892/or.2012.2196.
33. Fernandez JG, Rodriguez DA, Valenzuela M, Calderon C, Urzua U, Munroe D, Rosas C, Lemus D, Diaz N, Wright MC, Leyton L, Tapia JC, Quest AF. Survivin expression promotes VEGF-induced tumor angiogenesis via PI3K/Akt enhanced beta-catenin/Tcf-Lef dependent transcription. Mol Cancer. 2014; 13: 209. https://doi.org/10.1186/1476-4598-13-209.
34. Chang YJ, Li LT, Chen HA, Hung CS, Wei PL. Silencing survivin activates autophagy as an alternative survival pathway in HCC cells. Tumour Biol. 2014; 35:9957–66. https://doi.org/10.1007/s13277-014-2257-6.
35. Dong T, Zhang Y, Chen Y, Liu P, An T, Zhang J, Yang H, Zhu W, Yang X. FOXO1 inhibits the invasion and metastasis of hepatocellular carcinoma by reversing ZEB2-induced epithelial-mesenchymal transition. Oncotarget. 2017; 8:1703–13. https://doi.org/10.18632/oncotarget.13786.
36. Saito T, Ichimura Y, Taguchi K, Suzuki T, Mizushima T, Takagi K, Hirose Y, Nagahashi M, Iso T, Fukutomi T, Ohishi M, Endo K, Uemura T, et al. p62/Sqstm1 promotes malignancy of HCV-positive hepatocellular carcinoma through Nrf2-dependent metabolic reprogramming. Nat Commun. 2016; 7:12030. https://doi.org/10.1038/ncomms12030.
37. Bao L, Chandra PK, Moroz K, Zhang X, Thung SN, Wu T, Dash S. Impaired autophagy response in human hepatocellular carcinoma. Exp Mol Pathol. 2014; 96:149–54. https://doi.org/10.1016/j.yexmp.2013.12.002.
38. Ichimura Y, Waguri S, Sou YS, Kageyama S, Hasegawa J, Ishimura R, Saito T, Yang Y, Kouno T, Fukutomi T, Hoshii T, Hirao A, Takagi K, et al. Phosphorylation of p62 activates the Keap1-Nrf2 pathway during selective autophagy. Mol Cell. 2013; 51:618–31. https://doi.org/10.1016/j.molcel.2013.08.003.
39. Moscat J, Karin M, Diaz-Meco MT. p62 in Cancer: Signaling Adaptor Beyond Autophagy. Cell. 2016; 167:606–9. https://doi.org/10.1016/j.cell.2016.09.030.
40. Wang Z, Wu Q, Feng S, Zhao Y, Tao C. Identification of four prognostic LncRNAs for survival prediction of patients with hepatocellular carcinoma. PeerJ. 2017; 5:e3575. https://doi.org/10.7717/peerj.3575.
41. Li B, Feng W, Luo O, Xu T, Cao Y, Wu H, Yu D, Ding Y. Development and Validation of a Three-gene Prognostic Signature for Patients with Hepatocellular Carcinoma. Sci Rep. 2017; 7:5517. https://doi.org/10.1038/s41598-017-04811-5.
42. Hanahan D, Weinberg RA. Hallmarks of cancer: the next generation. Cell. 2011; 144:646–74. https://doi.org/10.1016/j.cell.2011.02.013.
43. Yu G, Wang LG, Han Y, He QY. clusterProfiler: an R package for comparing biological themes among gene clusters. OMICS. 2012; 16:284–7. https://doi.org/10.1089/omi.2011.0118.
44. Aguirre-Gamboa R, Gomez-Rueda H, Martinez-Ledesma E, Martinez-Torteya A, Chacolla-Huaringa R, Rodriguez-Barrientos A, Tamez-Pena JG, Trevino V. SurvExpress: an online biomarker validation tool and database for cancer gene expression data using survival analysis. PLoS One. 2013; 8:e74250. https://doi.org/10.1371/journal.pone.0074250.