
INTRODUCTION
Breast cancer is the most frequent cancer in women worldwide and is associated with a high mortality rate of approximately 15% despite recent improvements in diagnosis and treatment [1, 2]. The main cause of death is not the primary tumor in the breast, but the occurrence of lethal metastases in essential organs like lung, liver and the brain. Lymph node (LN) negative breast cancer patients do not present any signs of distant metastasis at the time of diagnosis. However, clinical and histopathological criteria currently classify the majority of LN negative and estrogen receptor (ER) positive patients as high-risk patients who accordingly receive adjuvant systemic treatments after surgical removal of the primary tumor [2]. In fact, approximately 40% of these patients do not benefit from the systemic treatment and would be cured by the removal of the primary tumor and radiotherapy alone [3, 4]. Consequently, improved prognostic markers are required to prevent adverse side-effects in systemically treated patients and to reduce health care costs.
Larger studies were conducted to establish various multi-analyte tests like MammaPrint, Oncotype DX, Breast Cancer Index, EndoPredict or Prosigna (PAM50) to improve outcome prediction and stratify therapy selection in breast cancer patients [5, 6]. Nevertheless, comparable studies among LN negative and ER positive patients to reduce systemic treatment are rare, most likely because only limited sample material is available. Fresh frozen tissue samples are preferred for higher technical quality and long follow-up times are required to determine which patients will or will not experience metastases 10, 15 or 20 years post diagnosis. Moreover, patients should not have received any systemic treatment, because markers developed based on treated cohorts could not distinguish between the future absence of metastases and positive treatment response. Due to today’s unspecific classification of patients, the collection of suitable sample sets in a critical scale is nowadays challenging. Esserman et al. used Formalin-Fixed, Paraffin-Embedded tissue samples collected in Sweden more than 20 years ago. They adjusted the mRNA expression-based MammaPrint cut-off to identify a smaller group of so-called ultralow-risk patients who may not benefit from any adjuvant systemic treatment [7]. However, better prognostic markers are required to substantially increase the ultralow patient group and to ensure that the rate of recurrence will not increase as a consequence of treatment reduction.
In the past decades microRNAs (miRs) have intensively been studied in primary breast tumor tissue and a few prognostic miRs have been proposed [8–10]. Although miRs are considered as key-regulators of the breast cancer transcriptome, none of the so far identified prognostic miRs have, to our knowledge, passed larger clinical trials [11]. Bias concerning the analyzed sample material, patient cohort heterogeneity as well as methodological and analytical variation limits the initial validation of candidate miRs. Lánczky et al. recently succeeded in validating the predictive potential of 26 out of 41 selected miRs by analyzing e.g. subtype- or receptor-specific patient cohorts with the integrated platform miRpower in a large group of mainly systemically treated patients [12]. In comparison, two studies focused solely on the de novo identification of prognostic miRs in primary tumor samples of LN negative, ER positive patients who did not receive any systemic treatment. Foekens et al. analyzed 249 miRs in 37 primary tumor samples via qRT-PCR and validated four prognostic miRs (hsa-miR-210-3p, hsa-miR-7-5p, hsa-miR-128-3p, hsa-miR-516-3p) by analyzing 147 additional tumor samples [13]. D’Aiuto et al. selected erb-b2 receptor tyrosine kinase 2 (ERBB2) negative samples (n = 92) and identified hsa-miR-548c-5p, hsa-miR-30e-3p and hsa-miR-125b-5p as differentially expressed in patients with and without relapse [14]. D’Aiuto et al. further validated the prognostic potential of hsa-miR-30e-3p (hsa-miR-30e*; MIMAT0000693) in an independent cohort of 223 matching samples extracted from the Molecular Taxonomy of Breast Cancer International Consortium (Metabric) data set [15, 16]. Although, both studies independently analyzed the expression of six out of the seven candidate miRs, each study identified an individual set of prognostic miRs. Considering this inconsistency, we aimed at cross-validating the suggested prognostic miRs to potentially identify those who could stratify classification of LN negative and ER positive patients in the future. Firstly, we collected 55 fresh frozen primary tumors from systemically untreated patients who developed distant metastasis and matching 55 fresh frozen primary tumors from patients who remained metastasis-free. We used a paired study design for increased statistical power and to analyze the differential expression of the candidate miRs and their association with outcome independently of any confounding prognostic factors [17, 18]. Moreover, we re-analyzed results presented by D’Aiuto et al. including ERBB2 positive patients and additionally analyzed candidate miRs identified by Foekens et al. in the independent patient cohorts published by D’Aiuto et al. and Metabric [14–16].
RESULTS
D’Aiuto et al. identified hsa-miR-1308, hsa-miR-548c-5p (MIMAT0004806), hsa-miR-125b-5p (MIMAT0000423) and hsa-miR-30e-3p as differentially expressed (p < 0.001) in LN negative, ER positive and ERBB2 negative breast cancer patients [14, 19]. The authors confirmed the prognostic role of hsa-miR-30e-3p in a matching cohort of 223 untreated patients extracted from the Metabric cohort [15, 16]. We aimed at validating the candidate miRs (except for hsa-miR-1308 which was later identified as being part of a t-RNA) [19] in our independent LN negative, ER positive cohort using a paired study design. To match our patient characteristics and analysis parameters, we further re-analyzed the role of these miRs in the D’Aiuto et al. and Metabric cohorts (Table 1) but included ERBB2 positive samples and divided the samples into high/low expression groups as being above or below the median expression value.
Table 1: Patient and tumor characteristics of the 4 cohorts of systemically untreated, lymph node negative and estrogen receptor positive breast cancer patients included in the study
OUH |
D’Aiuto et al. |
Metabric |
Foekens et al. |
|||||
|---|---|---|---|---|---|---|---|---|
No. of patients (%) |
||||||||
Metastasis |
yes |
no |
yes |
no |
yes |
no |
yes |
no |
55 (50.0%) |
55 (50.0%) |
47 (47.0%) |
53 (53.0%) |
65 (25.5%) |
190 (74.5%) |
n/a |
n/a |
|
Age at diagnosis |
||||||||
≤50 years |
10 (9.1%) |
9 (8.2%) |
12 (12.0%) |
22 (22.0%) |
22 (8.6%) |
49 (19.2%) |
79 (53.7%) |
|
>50 years |
45 (40.9%) |
46 (41.8%) |
35 (35%) |
31 (31%) |
43 (16.9%) |
141 (55.3%) |
68 (46.3%) |
|
Tumor size |
||||||||
≤ 2 cm |
23 (20.9%) |
23 (20.9%) |
21 (21.0%) |
34 (34.0) |
36 (14.1%) |
118 (46.3%) |
82 (55.8%) |
|
2–5 cm |
32 (29.1%) |
32 (29.1%) |
24 (24.0%) |
19 (19.0) |
26 (10.2%) |
62 (24.3%) |
65 (44.2%) |
|
>5 cm |
1 (1.0%) |
2 (0.8%) |
6 (2.4%) |
|||||
n/a |
1 (1.0%) |
1 (0.4%) |
4 (1.6%) |
|||||
Estrogen receptor status* |
||||||||
Positive |
49 (44.5%) |
48 (43,6%) |
47 (47.0%) |
53 (53.0%) |
62 (24.3%) |
173 (67.8%) |
147 (100%) |
|
Negative |
1 (0.9%) |
4 (3.6%) |
1 (0.4%) |
9 (3.5%) |
||||
n/a |
5 (4.5%) |
3 (2.7%) |
2 (0.8%) |
8 (3.1%) |
||||
Tumor type |
||||||||
Invasive ductal carcinoma |
41 (37.3%) |
42 (38.2%) |
37 (37.0%) |
38 (38.0%) |
50 (19.6%) |
125 (49.0%) |
||
Invasive lobular carcinoma |
9 (8.2%) |
9 (8.2%) |
9 (9.0%) |
3 (3.0%) |
7 (2.7%) |
15 (5.9%) |
||
Mucinous carcinoma |
2 (1.8%) |
2 (1.8%) |
1 (0.4%) |
9 (3.5%) |
||||
Papillary carcinoma |
2 (1.8%) |
1 (0.9%) |
||||||
Carcinoma with metaplasia |
1 (0.9%) |
1 (0.9%) |
||||||
mixed IDC/ILC |
1 (1.0%) |
5 (5.0%) |
3 (1.2%) |
7 (2.7%) |
||||
other |
7 (7.0%) |
4 (1.6%) |
31 (12.2%) |
|||||
n/a |
3 (1.2%) |
147 (100%) |
||||||
Histologic grade |
||||||||
1 (good) |
12 (10.9%) |
15 (13.6%) |
7 (2.7%) |
33 (12.9%) |
29 (19.7%) |
|||
2 (intermediate) |
22 (20.0%) |
19 (17.3%) |
41 (16.1%) |
103 (40.4%) |
||||
3 (poor) |
7 (6.4%) |
7 (6.4%) |
12 (4.7%) |
40 (15.7%) |
71 (48.3%) |
|||
n/a |
14 (12.7%) |
14 (12.7%) |
5 (2.0%) |
14 (5.5%) |
47 (32.0%) |
|||
Median year of surgery |
1980–1999 |
|||||||
1993 |
1992 |
n/a |
n/a |
n/a |
n/a |
n/a |
n/a |
|
Mean time to metastasis (months) |
||||||||
57.2 |
n/a |
29.8† |
n/a |
n/a |
n/a |
<60 |
n/a |
|
Mean follow up (months) |
||||||||
102.8 |
238.3 |
n/a |
119.1† |
108.9 |
133.6 |
84 (displayed in graph**) |
||
*as defined by immunohistochemistry (IHC); **patient data of validation analysis [13]; †disease free survival; n/a: not available/applicable; IDC: invasive ductal carcinoma; ILC: invasive lobular carcinoma.
While we could not confirm a significant expression difference of hsa-miR-125b-5p or hsa-miR-30e-3p (Figure 1A and 1B, Table 2) we observed a trend showing a moderate upregulation of miR-30e-3p in primary tumors of patients who did not develop metastasis (p = 0.17). The same trend is also reflected by the survival curves considering disease-free and overall survival (Figure 1B and Table 2; hazard ratio [HR]:0.64, p = 0.31 and HR:0.82, p = 0.66 respectively). In comparison, a significant expression upregulation in patients with relapse could be demonstrated for hsa-miR-548c-5p (p = 0.012; Figure 1C). Furthermore, high hsa-miR-548c-5p expression was associated with abridged disease-free survival (HR: 2.63, p = 0.020) and tended to result in shorter overall survival (HR:2.25, p = 0.056) (Figure 1C, Table 2). However, the results could not be reproduced in the large Metabric cohort (Figure 1C, Table 2). Potential reasons may be a more heterogeneous cohort composition with shorter follow up, varying sample treatment or a possible cross-reactivity of the applied array format (customized Agilent array) [20] considering that hsa-miR-548c-5p belongs to a rather large miR family comprising 74 human miRs with similar sequences [19]. Although the Metabric cohort comprises more patients, the statistical power is not fundamentally superior in comparison to the other cohorts because of the unbalanced distribution of patients with (n = 65) and without (n = 190) recurrence.
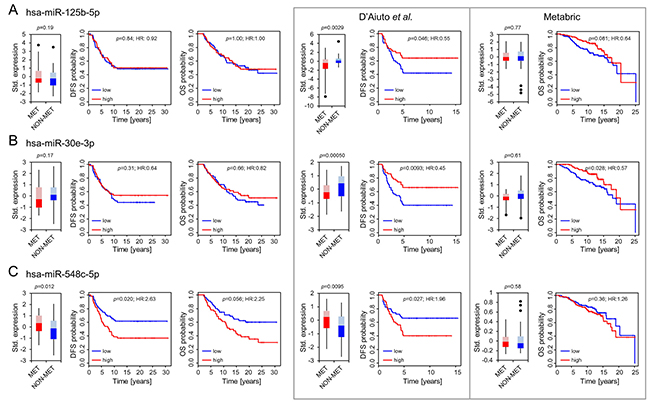
Figure 1: Differential expression and association with outcome for hsa-miR-125b-5p (A), hsa-miR-30e-3p (B) and hsa-miR-548c-5p (C). Boxplots present differences in expression patterns between patients who developed later metastasis (MET) and those who did not (NON-MET). Whiskers correspond to the upper and lower 25% range, data points deviating more than 3*STDEV from the mean are displayed as dots. Lighter colors indicate the 50–75 percentile range, while darker colors indicate the 25–50 percentile range of miRs expressed in MET (red) and NON-MET (blue). Significance was calculated using a paired Student’s T-test for the OUH cohort (left panel) and an unpaired Student’s T-test for the D’Aiuto et al. and Metabric cohort. Kaplan Meier plots indicating disease free (DFS) and overall survival (OS) probabilities were constructed using a univariable COX regression model. Results from the OUH cohort (n = 110) are displayed in line with re-analyzed results for the D’Aiuto et al. (n = 100) and the Metabric (n = 255) cohort (encased in grey) as published previously [14].
Table 2: Overview summarizing expression and survival analysis for miRs identified by D’Aiuto et al. [14]
D’Aiuto et al.* |
Metabric* |
OUH |
||
|---|---|---|---|---|
hsa-miR-125b-5p |
||||
Diff. Exp. |
p-value |
down in MET |
0.77 |
0.19 |
0.0015 |
||||
DFS |
p-value |
0.018 |
- |
0.84 |
HR (CI) |
0.47 (0.21–0.75) |
- |
0.92 (0.42–2.02) |
|
OS |
p-value |
- |
0.081 |
1.00 |
HR (CI) |
- |
0.64 (0.39–1.06) |
1.00 (0.43–2.31) |
|
hsa-miR-30e-3p |
||||
Diff. Exp. |
p-value |
down in MET |
0.61 |
0.17 |
0.0005 |
||||
DFS |
p-value |
0.0094 |
- |
0.31 |
HR (CI) |
0.45 (0.25–0.82) |
- |
0.64 (0.28–1.49) |
|
OS |
p-value |
- |
0.028 |
0.66 |
HR (CI) |
- |
0.57 (0.34–0.94) |
0.82 (0.34–1.97) |
|
hsa-miR-548c-5p |
||||
Diff. Exp. |
p-value |
up in MET |
0.58 |
up in MET |
0.010 |
0.012 |
|||
DFS |
p-value |
0.027 |
- |
0.02 |
HR (CI) |
1.96 (1.08–3.56) |
- |
2.63 (1.16–5.93) |
|
OS |
p-value |
- |
0.36 |
0.056 |
HR (CI) |
- |
1.26 (0.77–2.06) |
2.25 (0.98–5.18) |
|
*re-evaluation of already published results [14]; Diff. Exp.: Differential expression; MET: primary tumors from patients with relapse; HR: Hazard ratio; CI: 95% Confidence interval.
Foekens et al. identified four miRs in 37 LN negative, ER positive primary breast tumor samples and validated their association with reduced DFS when highly expressed in further 147 LN negative, ER positive primary tumors [13]. We evaluated the differential expression of these miRs in our matching data set but could neither confirm a differential expression of hsa-miR-7-5p (MIMAT0000252), hsa-miR-128-3p (MIMAT0000424) and hsa-miR-210-3p (MIMAT0000267), nor a specific association with abridged disease-free or overall survival (Figure 2A, 2D, 2G; Table 3) [19]. Furthermore, opposing Foekens et al. results, we found hsa-miR-516-3p (hsa-miR-516a-3p; hsa-miR-516b-3p; MIMAT0002860; MIMAT0006778) [19] significantly downregulated in primary tumors of patients who developed later metastasis accompanied by a significant association of low hsa-miR-516-3p expression with metastasis formation (HR:0.29, p = 0.0068) and shorter overall survival (HR: 0.26, p = 0.0079; Figure 2J).
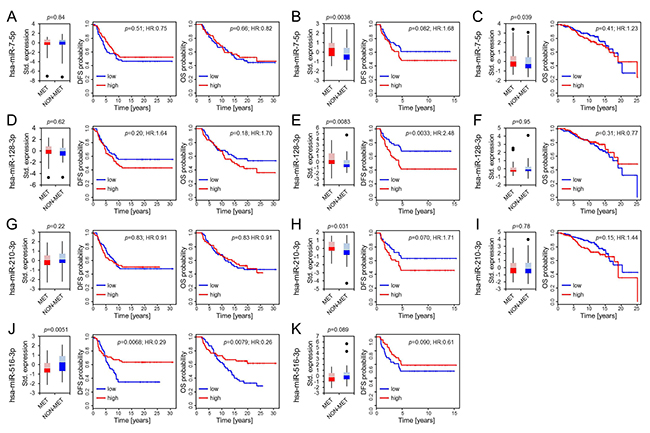
Figure 2: Differential expression of hsa-miR-7-5p, hsa-miR-128-3p, hsa-miR-210-3p and hsa-miR-516-3p. Boxplots present differences in expression patterns between patients who developed later metastasis (MET) and those who did not (NON-MET) from the OUH, the D’Aiuto et al. and the Metabric cohort (panels from left to right). Whiskers correspond to the upper and lower 25% range, data points deviating more than 3*STDEV from the mean are displayed as dots. Lighter colors indicate the 50–75 percentile range while darker colors indicate the 25–50 percentile range of miRs expressed in MET (red) and NON-MET (blue). Significance was calculated using a paired Student’s T-test for the OUH cohort (A, D, G, J) and an unpaired Student’s T-test for the D’Aiuto et al. (B, E, H, K) and Metabric cohort (C, F, I). Kaplan Meier plots display disease free (DFS) and overall survival (OS) along with the univariate COX-PH regression significance levels.
Table 3: Overview summarizing expression and survival analysis for miRs identified by Foekens et al. [13]
Foekens et al.* |
OUH |
D’Aiuto et al. |
Metabric |
||
|---|---|---|---|---|---|
hsa-miR-7-5p |
|||||
Diff. Exp. |
p-value |
up in MET |
0.83 |
up in MET |
up in MET |
0.0038 |
0.039 |
||||
DFS |
p-value |
≤0.05 |
0.51 |
0.082 |
- |
HR (CI) |
>1 |
0.75 (0.32–1.78) |
1.68 (0.94–3.01) |
- |
|
OS |
p-value |
- |
0.66 |
- |
0.41 |
HR (CI) |
- |
0.82 (0.34–1.97) |
- |
1.23 (0.75–2.02) |
|
hsa-miR-128-3p |
|||||
Diff. Exp. |
p-value |
up in MET |
0.61 |
up in MET |
0.95 |
0.008 |
|||||
DFS |
p-value |
≤0.05 |
0.20 |
0.0033 |
- |
HR (CI) |
>1 |
1.64 (0.77–3.47) |
2.48 (1.35–4.55) |
- |
|
OS |
p-value |
- |
0.18 |
- |
0.31 |
HR (CI) |
- |
1.70 (0.78–3.71) |
- |
0.77 (0.47–1.27) |
|
hsa-miR-210-3p |
|||||
Diff. Exp. |
p-value |
up in MET |
0.22 |
up in MET |
0.78 |
0.031 |
|||||
DFS |
p-value |
≤0.05 |
0.83 |
0.070 |
- |
HR (CI) |
>1 |
0.91 (0.39–2.14) |
1.71 (0.96–3.07) |
- |
|
OS |
p-value |
- |
0.83 |
- |
0.15 |
HR (CI) |
- |
0.91 (0.39–2.14) |
- |
1.44 (0.88–2.35) |
|
hsa-miR-516-3p |
|||||
Diff. Exp. |
p-value |
up in MET |
down in MET |
0.089 |
- |
0.0051 |
|||||
DFS |
p-value |
≤0.05 |
0.0068 |
0.090 |
- |
HR (CI) |
>1 |
0.29 (0.12–0.71) |
0.61 (0.34–1.08) |
- |
|
OS |
p-value |
- |
0.0079 |
- |
- |
HR (CI) |
- |
0.26 (0.098–0.70) |
- |
- |
|
*according to published results [13]; Diff. Exp.: Differential expression; MET: primary tumors from patients with relapse; HR: Hazard ratio; CI: 95% Confidence interval.
To further clarify the potential role of these four miR candidates, we additionally analyzed their expression and outcome association in the available D’Aiuto et al. and Metabric data sets (Figure 2; Table 3) [14–16]. A differential expression of hsa-miR-7-5p was found in the D’Aiuto et al. (p = 0.0038; Figure 2B) and the Metabric cohort (p = 0.039; Figure 2C) supporting Foekens et al. initial results. However, no significant association with disease free survival (DFS) or overall survival was detected. For hsa-miR-128-3p a prognostic role could be determined in the D’Aiuto et al. set (Figure 2E) where a high expression was significantly associated with poor outcome (HR:2.48, p = 0.0033). No significant association was computed for hsa-miR-128-3p in the Metabric cohort (Figure 2F). Foekens et al. demonstrated a prognostic role for hsa-miR-210-3p in ER positive and negative breast cancer, while the latter was not in the scope of this study, a significant correlation between outcome and hsa-miR-210-3p expression in ER positive patients could not be validated (Figure 2G, 2H, 2I; Table 3) although expression was significantly upregulated in samples from patients with relapse in the D’Aiuto et al. data set (Figure 2H). Hsa-miR-516-3p was not analyzed in the Metabric study and data available for the D’Aiuto et al. cohort did not confirm an advantageous low or high expression although a trend towards a beneficial low expression could be observed (HR:0.61, p = 0.090; Figure 2K, Table 3). Methodological differences and variable cohort features could explain the bias between Foekens et al. and our results. For example, in comparison to the D’Aiuto et al. and the Foekens et al. data sets, we could grasp back to a cohort with an almost double so long follow-up period including patients with late recurrence 5 years after the initial diagnosis (Table 1). Considering further the intersecting arms in the survival curves displayed in Figure 2J, we analyzed whether hsa-miR-516-3p expression may be time dependent using the Schoenfeld residual test [21]. The test revealed that the proportional hazards assumption was significantly violated with respect to DFS (p = 0.0012) and OS (p = 0.001) (Figure 3A and 3C), thus precluding the application of the COX regression model [21, 22]. To account for non-proportionality we conducted a landmark analysis using two time intervals (Figure 3B and 3D). The intervals were defined based on the time points at which the hazard ratio assessed by the Schoenfeld residuals changes from above one to below one. For DFS and OS an even more significant association of low hsa-miR-516-3p expression with an unfavorable prognosis was determined 3.35 (HR:0.15, p = 0.0018) and 4.5 years (HR:0.06, p = 0.00030) post diagnosis, respectively (Figure 3B and 3D). However, no significant association could be detected in the first time interval although a trend was observed pointing in the opposite direction. In summary, our results contradict the initial findings by Foekens et al. but may point to a time-dependent prognostic role of hsa-miR-516-3p.
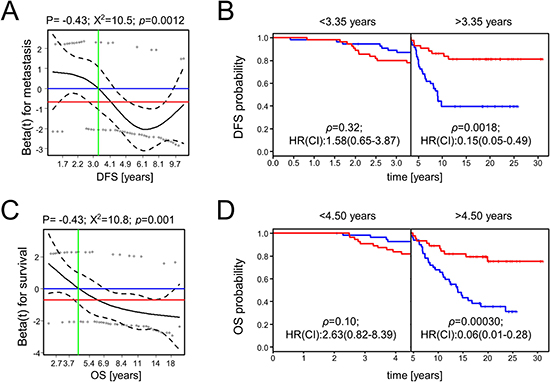
Figure 3: Scaled Schoenfeld residuals for hsa-miR-516-3p and survival analysis using two time intervals. The scaled Schoenfeld residuals (A, C) are shown by circles. The black line is the smoothed mean of the scaled Schoenfeld residuals while the corresponding 95% confidence interval is indicated by the dashed lines. The blue horizontal line corresponds to a hazard ratio of one, and the red horizontal line is the hazard ratio assessed by the univariable COX proportional hazard ratio model (0.29 and 0.26 for DFS and OS, respectively; Figure 2J). The vertical green line shows the time point upon which the hazard ratio shifts from a value >1 to a value <1, representing the time point when the prediction association changes. These time points were used in a subsequent landmark analysis to define two time intervals for disease-free (B) and overall survival analysis (D) in which the proportional hazard assumption was fulfilled.
DISCUSSION
A general challenge for the identification and validation of prognostic miR markers is the suspected low comparability between standalone studies. Potential prognostic candidates are individually identified dependent on the quality of RNA and clinical data, patient characteristics as well as the selected study design and methodology. Stringent statistical filtering and correction for multiple testing often limits the number of assigned positive hits. As a result, the majority of miRs are classified as negative hits although one cannot rule out that a number of promising candidates may have been filtered out. Other studies may identify these as promising candidates such that different standalone studies rarely identify overlapping candidate sets [12]. Although, subsequent validation in independent cohorts is often applied to confirm the prognostic potential of a positive candidate, unfortunately, the confirmation rate is likely to be low because of the aforementioned heterogeneity between studies. However, the successful reproduction of results for a positive hit is indeed expected to have increased explanatory power, because it is very unlikely that the same biomarker shows significant results in two truly independent cohorts just by chance.
We evaluated the prognostic potential of seven previously proposed miRs in systemically untreated breast cancer patients independent of classical clinical and pathological marker. Besides analyzing publicly available data sets we introduce our new data set comprising 110 paired primary tumors of systemically untreated patients with very long follow up time. Matching of the samples minimized bias concerning clinical and pathological characteristics as well as bias related to storage time, sampling method, and diagnostic procedures. Consequently, the chosen paired design increased the power of our analysis in comparison to cohort studies by omitting any effect potentially caused by an unbalanced cohort composition and by enriching for relevant clinical endpoints [18].
We found an association of hsa-miR-548c-5p with outcome in our data set supporting previously published results. For the remaining candidate miRs no significant validation results were obtained. A lack of power due to the lower number of samples analyzed in our study may cause the bias. However, the use of untreated samples with prolonged follow up was a prerequisite to search for potential marker which can identify patients who may not benefit from any systemic treatment.
In comparison, the re-analysis of published data supported a prognostic role of hsa-miR-30e-3p, hsa-miR-7-5p, hsa-miR-210-3p and hsa-miR-128-3p. However, none of the analyzed candidate miRs could be confirmed as being prognostic in all four tested cohorts. For two miRs, significant results were only computed in a single cohort. Although we aimed at finding best matching cohorts, we were limited to systemically untreated samples of LN negative and ER positive patients. Moreover, the comparability of the included cohorts may not be optimal considering e.g. that only marginal clinical data were available for the Foekens et al. cohort or, that the Metabric cohort was quite heterogeneous. Furthermore, in all previously published studies considerable shorter follow-up times were available. These differences as well as variances in sample handling and differences in the miR purification protocol may have reduced the reproducibility across different studies. Result bias may further be caused by varying platform performance considering reproducibility, accuracy, detection rate, sensitivity and specificity [20, 23, 24]. Foekens et al. quantified miRs using a qPCR-based approach (TaqMan, Applied Biosystems) while D’Aiuto et al. used MicroRNA expression beadchips from Illumina. Interestingly, results for three out of four miRs identified by Foekens et al. were validated using the D’Aiuto et al. data set potentially indicating an improved comparability between technologies including PCR amplification steps. In comparison, data collected based on miR hybridization on customized arrays produced by Agilent (Metabric) and on our own arrays based on a probe library provided by Exiqon verified results for three of the seven suggested candidates. Mestdagh et al. analyzed the differential expression of two identical sample groups via 12 platforms (applying qPCR, hybridization or sequencing for analysis) and detected 66 differentially expressed miRs by at least one platform [20]. However, only two of these miRs were concordantly detected as differentially expressed by all platforms [20]. Thus, platform-dependent false positive and negative hits are likely to occur and the careful selection of similar performing platforms may be critical for a robust validation of candidate miRs when using different cohorts.
Previous studies further attempted to causally link the seven miR candidates to specific functions in breast cancer progression. For example, D’Aiuto et al. reported that the prognostic hsa-miR-30e-3p is functionally linked to the induction of epithelial-mesenchymal-transition (EMT) which is a prerequisite progress for tumor cell dissemination [14]. This result is in line with previous studies suggesting a critical role of the miR-30-family in EMT [25, 26]. We found high hsa-miR-548c-5p expression significantly associated with abridged disease free-survival. The prognostic role of this miR may even be independent of the receptor status or treatment, because Boukerroucha et al. identified a predictive role of hsa-miR-548c-5p in conjunction with three other clinic-histopathological parameters in triple negative breast cancer (TNBC) [27]. On the contrary, functional studies in endometrial, ovarian and liver cancer suggest that decreased hsa-miR-548c expression promotes cell migration and invasion potentially by silencing the EMT marker TWIST [28, 29]. Accordingly, further studies in ER positive breast cancers are required to verify the functional and prognostic role of these miRs.
In comparison, miR-7 was shown to function as breast cancer invasion and metastasis inhibitor and to mediate cytotoxic T-lymphocyte-mediated lysis of breast cancer cells [10, 30]. Moreover, miR-7 was shown to suppress cell proliferation and induce apoptosis in different breast cancer cell lines [31]. Conversely, Foekens et al. associated a high expression of hsa-miR-7-5p with abridged disease free survival and; we found hsa-miR-7-5p significantly upregulated in metastasizing tumors of the D’Aiuto et al. cohort. Differences in receptor status, strand selection and endogenous expression may compromise comparability of these studies and may explain varying functional roles for miR-7 dependent on the examined cellular background.
MiR-210 has also extensively been analyzed in breast cancer and several studies associated miR-210 expression with breast cancer survival [9, 10, 12, 32]. However, we could not confirm the prognostic role of hsa-miR-210-3p in primary tumor samples although a significant differential expression was detected in local versus disseminating primary tumors [33]. Wang et al. performed a systematic meta-analysis of miR-210 in different cancer types and found no significant association with breast cancer [34]. Contradicting results were reported by Xie et al. and Hong et al. in two meta-analysis studies [35, 36]. However, all studies included mixed patient cohorts including treated patients and varying receptor status. The same is true for functional studies which linked miR-210 to treatment resistance, hypoxia and a cancer promoting role in ER negative breast cancers [10, 32].
Aberrant expression of miR-128 was reported in many different malignancies including e.g. breast, colon, lung, brain and pancreatic tumors [37, 38]. Buffa et al. significantly associated high hsa-miR-128a with reduced distant relapse free-survival in ER positive breast cancer samples receiving systemic adjuvant treatments [33]. They further confirmed their results via an integrative meta-analysis and Lánczky et al. independently validated the predictive role of miR-128a [12, 33]. These findings are in good agreement with our results. However, these studies included treated patients and Masri et al. associated high miR-128 expression with letrozole resistance in breast cancer [39]. Consequently, the results may suggest that miR-128a may promote breast cancer recurrence by not only promoting metastasis formation but also by mediating treatment resistances.
Surprisingly, hsa-miR-125b-5p was neither differentially expressed nor significantly associated with survival in our study, although a tumor suppressive role of miR-125b was recurrently reported in cell line models [40, 41]. Moreover, miR-125b is part of a 10-miR classifier which significantly predicts 5-year distant relapse free survival in endocrine treated, hormone receptor positive and ERBB2 negative breast cancer patients [42]. In summary, miR-125b-5p may positively support endocrine treatments but may not be causal for the occurrence of metastases.
In comparison to the other analyzed miRs, little is known about the functional role of miR-516a. White et al. reported, that miR-516a is one out of three miRs regulating kallikrein 10 expression and cell proliferation in breast cancer [43]. The database Tarbase (http://www.microrna.gr/tarbase) proposes sulfatase 1 (SULF1) as the only validated gene target of hsa-miR-516a-3p [44]. SULF1 was reported to be a tumor suppressor, and to be downregulated in primary breast cancer tissue [45]. Correspondingly, an upregulation of hsa-miR-516a-3p is assumed to reduce SULF1 and the positive effects mediated by the gene which is contradicting our findings, that a low hsa-miR-516a-3p is associated with unfavorable outcome. However, our findings oppose the initial outcome association published by Foekens et al. [13]. Unfortunately, no patient specific expression data and clinical and pathological information were available for the Foekens et al. cohort which would allow us to re-analyze the data and to potentially point out causal difference in the cohort composition which may explain contradicting results. While this miR was not included in the Metabric study, an analysis in the independent D’Aiuto et al. cohort did not significantly indicate a beneficial up- or downregulation of the miR, although we observed a slight trend towards an advantageous high expression. However, follow up of patients was much longer in our study. Furthermore, we had to divide our data into two time intervals to not violate the proportional hazards assumption of the COX model. We observed, that high expression is potentially associated with a worse prognosis within the first years after diagnosis (3.35 and 4.5 years for DFS and OS, respectively), while thereafter high expression is significantly associated with prolonged survival. It is acknowledged, that the Foekens et al. cohort includes almost double as many patients as our cohort. However, by using the paired design we increased the prognostic power for our analysis as discussed above.
In conclusion, using data of four independent cohorts analyzed by different analysis platforms we collected further indications supporting the prognostic potential of hsa-miR-548c-5p, hsa-miR-7-5p, hsa-miR-210-3p and hsa-miR-128-3p. In addition, a potentially time-dependent role was determined for hsa-miR-516a-3p. We exclusively selected systemically untreated, LN negative and ER positive breast cancer patients for a treatment independent analysis. The stringent selection limited the number of patients to be analyzed and may reduce the prognostic power of the study, however, only this particular patient group is suitable to identify miRs which can better classify low-risk breast cancer patients and thus have the potential as clinical marker to reduce overtreatment in the future. Nevertheless, further studies in large, homogeneous cohorts with standardized sample treatment and long follow up using accurate and selective platforms are required to eventually confirm the prognostic potential of these candidates for clinical use.
MATERIALS AND METHODS
Tumor biopsies
Frozen tumor biopsies were collected from 110 lymph node negative and ER positive (measured by gene expression) patients who were diagnosed with breast cancer between 1980 and 1999 on the island of Funen, Denmark. All patients underwent surgery to remove the primary tumor, but none of the patients received systemic neoadjuvant or adjuvant therapy. Pathological examination of snap-frozen tumor samples was performed at the Department of Pathology at the Odense University Hospital, Denmark which confirmed a tumor cell content of more than 50% in all cases. Fifty-five patients developed metastasis within 10 years after diagnosis, while 55 patients did not experience metastasis (followed for at least 8 years; mean follow up 19.6 years). Patient biopsies were matched according to tumor type, year of surgery, tumor diameter (range: 6–50 mm), age (range: 33–88 years), receptor status (ER, PR, n/a) and histological grade (grade 1–3 or n/a) (Table 1). All clinic-pathological information was extracted from the Danish Breast Cancer Cooperative Group (DBCG) database, the Funen pathology database, or the nationwide pathology database. The study was approved by the Danish National Committee on Health Research (S-VF-20020142). The study was retrospective and no informed consent was obtained from the patients involved in the study as approved by the Ethical Committee.
RNA extraction
Total RNA was isolated from the freshly frozen tumor biopsies with Trizol (Invitrogen) and further purified with the RNeasy micro kit (Qiagen), including DNase treatment. NanoDrop Spectrophotometer (NanoDrop Technologies) was used for RNA quantification. The quality of extracted RNA was assessed with Bioanalyzer 2100 (Agilent Technologies) using the RNA 6000 Nano Kit (Agilent Technologies).
Microarray quantification and analysis
The miRCURY LNA microRNA array ready-to-spot probe-set was purchased from Exiqon. The set contains capture-probes for 1212 human miRs based on the miRBase version 16 (http://www.miRbase.org/) [19]. Briefly, the probes were spotted in triplets on CodeLink HD (SurModics) activated glass slides and post-processed according to the CodeLink protocol. The miRCURY Power labeling kit (Exiqon), miRCURY LNA Array hybridization buffer (Exiqon) and miRCURY LNA Array Washing buffer kit (Exiqon) were used for sample labelling with Hy3, hybridization and washing, respectively. Equal amounts of RNA from all included samples were pooled and used as common reference labeled with Hy5. Hybridization, washing, and scanning (Agilent G2565CA Microarray scanner) were performed according to the recommendations provided by Exiqon.
Scanned images were imported into GenePixPro6.0 software (Molecular Devices) for quality control and raw data extraction. The R-package limma was used for LOESS and quantile normalization of raw signal intensities, and the ComBat function embedded in the sva R-package was used for adjustment of the normalized intensities and to eliminate potential batch effects [46, 47]. Gene expression was initially defined as the ratio between Hy3 and Hy5 signal intensities. For the purpose of cross dataset miR expression comparability we further standardized these calculated ratios and used these values for differential expression and survival analysis. Microarray data have been deposited in NCBI’s Gene Expression Omnibus [48] and are accessible through GEO Series accession number GSE103161 (https://www.ncbi.nlm.nih.gov/geo/query/acc.cgi?acc=GSE103161).
Validation data acquisition
Publicly available miR expression data published by D’Aiuto et al. were collected from NCBI’s Gene Expression Omnibus database (acc=GSE59829) [48]. Expression data published by Dvinge et al. and Curtis et al. (Metabric) were retrieved from the European Phenome-Genome Archive (https://www.ebi.ac.uk/ega/home) after access was granted by the Metabric consortium [15, 16, 49]. For consistent miR nomenclature the R-package miRNAmeConverter was applied and MIMAT numbers were used as identifier in subsequent analysis [50].
Statistical analysis
Student’s t-tests were performed to analyze differential expression. For each of the seven miRs we divided the samples into groups with high and low expression using the median expression as cut off. The grouping was used for subsequent analyses using the COX univariable proportional hazard model [22].
Overall survival (OS) was defined from diagnostic date to death or loss of follow-up. Disease free survival (DFS) was defined from diagnostic date to metastasis recurrence or loss of follow-up. The Kaplan–Meier method was applied to describe the OS and DFS. Significant discrepancies of OS or DFS were assessed by univariable COX proportional hazard analysis [22, 51]. The proportional hazards assumption and time-dependent effects were examined by plotting the scaled Schoenfeld residuals to test for significant deviation from a zero slope, respectively [21]. Landmark analyses were applied to assess the hazard ratios during particular periods. The landmarks were defined as the time point upon which the Schoenfeld assessed Hazard Ratio (HR) shifts from >1 to <1, thus being (0–3.35 years and >3.35 years for DFS) and (0–4.5 years and >4.5 years for OS). This analysis therefore included patients who were event free at the start of each period, and being censored at the end of each period. All survival analyses were conducted using the survival R-package [22, 51]. All p-values below 0.05 were considered statistically significant.
Abbreviations
OS: Overall survival; DFS: Disease free survival; ER: estrogen receptor; LN: lymph node; PR: progesterone receptor: ERBB2: erb-b2 receptor tyrosine kinase 2; miR: microRNA; Metabric: Molecular Taxonomy of Breast Cancer International Consortium; DBCG: Danish Breast Cancer Cooperative Group; OUH: Odense University Hospital; Std. expression: Standardized expression; HR: Hazard ratio; CI: Confidence interval; STDEV: Standard deviation.
Author contributions
KPS, IB, MT and TAK conceived the study and designed the experiments; KPS and MJL performed the experiments; MBU performed the data analysis; IB, MJL, QT and LA contributed to the data analysis; TAK, MT, QT, MBU, IB interpreted the results; MBA and SC contributed materials, patient information and supported the interpretation of the results. IB wrote the manuscript. All authors revised the manuscript and approved the submitted version.
ACKNOWLEDGMENTS
The authors thank Charlotte Skouboe Landré for technical assistance with RNA purification.
CONFLICTS OF INTEREST
The authors declare that no competing interests exist.
FUNDING
This work was founded by the Danish Council for Independent Research (FSS), the Danish Ministry of the Interior, University of Southern Denmark (Horizon2020 – Grant:DAWN2020), The Danish Council for Strategic Research (DBCG-TIBCAT) and Dansk Kræftforsknings Fond, Breast Friends, Fonden til Lægevidenskabens Fremme, Meta & Håkon Baggers Fond, A. J. Andersen & Hustrus Fond, Inge & Jørgen Larsens Mindelegat, Overlægerådets Legatudvalg, Direktør Jacob Madsen & Hustru Olga Madsens Fond, Fru Ingeborg Albinus Larsens Mindelegat, Fonden af 1870, Harboefonden, Free Research Fond of the Odense University Hospital, Lundbeckfonden (Center of Excellence NanoCAN) and Frimodt-Heineke Fonden.
REFERENCES
1. Ferlay J, Soerjomataram I, Dikshit R, Eser S, Mathers C, Rebelo M, Parkin DM, Forman D, Bray F. Cancer incidence and mortality worldwide: sources, methods and major patterns in GLOBOCAN 2012. Int J Cancer. 2015; 136: E359-86. https://doi.org/10.1002/ijc.29210.
2. Miller KD, Siegel RL, Lin CC, Mariotto AB, Kramer JL, Rowland JH, Stein KD, Alteri R, Jemal A. Cancer treatment and survivorship statistics, 2016. CA Cancer J Clin. 2016; 66:271–89. https://doi.org/10.3322/caac.21349.
3. Mouridsen HT, Bjerre KD, Christiansen P, Jensen MB, Moller S. Improvement of prognosis in breast cancer in Denmark 1977–2006, based on the nationwide reporting to the DBCG Registry. Acta Oncol. 2008; 47:525–36. https://doi.org/10.1080/02841860802027009.
4. Christiansen P, Bjerre K, Ejlertsen B, Jensen MB, Rasmussen BB, Laenkholm AV, Kroman N, Ewertz M, Offersen B, Toftdahl DB, Moller S, Mouridsen HT, Danish Breast Cancer Cooperative G. Mortality rates among early-stage hormone receptor-positive breast cancer patients: a population-based cohort study in Denmark. J Natl Cancer Inst. 2011; 103:1363–72. https://doi.org/10.1093/jnci/djr299.
5. Duffy MJ, Harbeck N, Nap M, Molina R, Nicolini A, Senkus E, Cardoso F. Clinical use of biomarkers in breast cancer: Updated guidelines from the European Group on Tumor Markers (EGTM). Eur J Cancer. 2017; 75:284–98. https://doi.org/10.1016/j.ejca.2017.01.017.
6. Gyorffy B, Hatzis C, Sanft T, Hofstatter E, Aktas B, Pusztai L. Multigene prognostic tests in breast cancer: past, present, future. Breast Cancer Res. 2015; 17:11. https://doi.org/10.1186/s13058-015-0514-2.
7. Esserman LJ, Yau C, Thompson CK, van ‘t Veer LJ, Borowsky AD, Hoadley KA, Tobin NP, Nordenskjold B, Fornander T, Stal O, Benz CC, Lindstrom LS. Use of Molecular Tools to Identify Patients With Indolent Breast Cancers With Ultralow Risk Over 2 Decades. JAMA Oncol. 2017. https://doi.org/10.1001/jamaoncol.2017.1261.
8. Amorim M, Salta S, Henrique R, Jeronimo C. Decoding the usefulness of non-coding RNAs as breast cancer markers. J Transl Med. 2016; 14:265. https://doi.org/10.1186/s12967-016-1025-3.
9. Bertoli G, Cava C, Castiglioni I. MicroRNAs: New Biomarkers for Diagnosis, Prognosis, Therapy Prediction and Therapeutic Tools for Breast Cancer. Theranostics. 2015; 5:1122–43. https://doi.org/10.7150/thno.11543.
10. van Schooneveld E, Wildiers H, Vergote I, Vermeulen PB, Dirix LY, Van Laere SJ. Dysregulation of microRNAs in breast cancer and their potential role as prognostic and predictive biomarkers in patient management. Breast Cancer Res. 2015; 17:21. https://doi.org/10.1186/s13058-015-0526-y.
11. Smith B, Agarwal P, Bhowmick NA. MicroRNA applications for prostate, ovarian and breast cancer in the era of precision medicine. Endocr Relat Cancer. 2017; 24: R157–R72. https://doi.org/10.1530/ERC-16-0525.
12. Lanczky A, Nagy A, Bottai G, Munkacsy G, Szabo A, Santarpia L, Gyorffy B. miRpower: a web-tool to validate survival-associated miRNAs utilizing expression data from 2178 breast cancer patients. Breast Cancer Res Treat. 2016; 160:439–46. https://doi.org/10.1007/s10549-016-4013-7.
13. Foekens JA, Sieuwerts AM, Smid M, Look MP, de Weerd V, Boersma AW, Klijn JG, Wiemer EA, Martens JW. Four miRNAs associated with aggressiveness of lymph node-negative, estrogen receptor-positive human breast cancer. Proc Natl Acad Sci U S A. 2008; 105:13021–6. https://doi.org/10.1073/pnas.0803304105.
14. D’Aiuto F, Callari M, Dugo M, Merlino G, Musella V, Miodini P, Paolini B, Cappelletti V, Daidone MG. miR-30e* is an independent subtype-specific prognostic marker in breast cancer. Br J Cancer. 2015; 113:290–8. https://doi.org/10.1038/bjc.2015.206.
15. Curtis C, Shah SP, Chin SF, Turashvili G, Rueda OM, Dunning MJ, Speed D, Lynch AG, Samarajiwa S, Yuan Y, Graf S, Ha G, Haffari G, et al. The genomic and transcriptomic architecture of 2,000 breast tumours reveals novel subgroups. Nature. 2012; 486:346–52. https://doi.org/10.1038/nature10983.
16. Dvinge H, Git A, Graf S, Salmon-Divon M, Curtis C, Sottoriva A, Zhao Y, Hirst M, Armisen J, Miska EA, Chin SF, Provenzano E, Turashvili G, et al. The shaping and functional consequences of the microRNA landscape in breast cancer. Nature. 2013; 497:378–82. https://doi.org/10.1038/nature12108.
17. Tan Q, Thomassen M, Kruse TA. Feature selection for predicting tumor metastases in microarray experiments using paired design. Cancer Inform. 2007; 3:213–8.
18. Sorensen KP, Thomassen M, Tan Q, Bak M, Cold S, Burton M, Larsen MJ, Kruse TA. Long non-coding RNA expression profiles predict metastasis in lymph node-negative breast cancer independently of traditional prognostic markers. Breast Cancer Res. 2015; 17:55. https://doi.org/10.1186/s13058-015-0557-4.
19. Kozomara A, Griffiths-Jones S. miRBase: integrating microRNA annotation and deep-sequencing data. Nucleic Acids Res. 2011; 39:D152–7. https://doi.org/10.1093/nar/gkq1027.
20. Mestdagh P, Hartmann N, Baeriswyl L, Andreasen D, Bernard N, Chen C, Cheo D, D’Andrade P, DeMayo M, Dennis L, Derveaux S, Feng Y, Fulmer-Smentek S, et al. Evaluation of quantitative miRNA expression platforms in the microRNA quality control (miRQC) study. Nat Methods. 2014; 11:809–15. https://doi.org/10.1038/nmeth.3014.
21. Bellera CA, MacGrogan G, Debled M, de Lara CT, Brouste V, Mathoulin-Pelissier S. Variables with time-varying effects and the Cox model: some statistical concepts illustrated with a prognostic factor study in breast cancer. BMC Med Res Methodol. 2010; 10: 20. https://doi.org/10.1186/1471-2288-10-20.
22. Therneau TM. Modeling Survival Data: Extending the Cox Model. (New York: Springer). 2000.
23. Callari M, Dugo M, Musella V, Marchesi E, Chiorino G, Grand MM, Pierotti MA, Daidone MG, Canevari S, De Cecco L. Comparison of microarray platforms for measuring differential microRNA expression in paired normal/cancer colon tissues. PLoS One. 2012; 7:e45105. https://doi.org/10.1371/journal.pone.0045105.
24. Kolbert CP, Feddersen RM, Rakhshan F, Grill DE, Simon G, Middha S, Jang JS, Simon V, Schultz DA, Zschunke M, Lingle W, Carr JM, Thompson EA, et al. Multi-platform analysis of microRNA expression measurements in RNA from fresh frozen and FFPE tissues. PLoS One. 2013; 8: 52517. https://doi.org/10.1371/journal.pone.0052517.
25. Braun J, Hoang-Vu C, Dralle H, Huttelmaier S. Downregulation of microRNAs directs the EMT and invasive potential of anaplastic thyroid carcinomas. Oncogene. 2010; 29:4237–44. https://doi.org/10.1038/onc.2010.169.
26. Joglekar MV, Patil D, Joglekar VM, Rao GV, Reddy DN, Mitnala S, Shouche Y, Hardikar AA. The miR-30 family microRNAs confer epithelial phenotype to human pancreatic cells. Islets. 2009; 1:137–47. https://doi.org/10.4161/isl.1.2.9578.
27. Boukerroucha M, Josse C, ElGuendi S, Boujemla B, Freres P, Maree R, Wenric S, Segers K, Collignon J, Jerusalem G, Bours V. Evaluation of BRCA1-related molecular features and microRNAs as prognostic factors for triple negative breast cancers. BMC Cancer. 2015; 15:755. https://doi.org/10.1186/s12885-015-1740-9.
28. Fang L, Zhang HB, Li H, Fu Y, Yang GS. miR-548c-5p inhibits proliferation and migration and promotes apoptosis in CD90(+) HepG2 cells. Radiol Oncol. 2012; 46:233–41. https://doi.org/10.2478/v10019-012-0025-z.
29. Sun X, Cui M, Zhang A, Tong L, Wang K, Li K, Wang X, Sun Z, Zhang H. MiR-548c impairs migration and invasion of endometrial and ovarian cancer cells via downregulation of Twist. J Exp Clin Cancer Res. 2016; 35:10. https://doi.org/10.1186/s13046-016-0288-0.
30. Zhang H, Cai K, Wang J, Wang X, Cheng K, Shi F, Jiang L, Zhang Y, Dou J. MiR-7, inhibited indirectly by lincRNA HOTAIR, directly inhibits SETDB1 and reverses the EMT of breast cancer stem cells by downregulating the STAT3 pathway. Stem Cells. 2014; 32:2858–68. https://doi.org/10.1002/stem.1795.
31. Shi Y, Luo X, Li P, Tan J, Wang X, Xiang T, Ren G. miR-7-5p suppresses cell proliferation and induces apoptosis of breast cancer cells mainly by targeting REGgamma. Cancer Lett. 2015; 358:27–36. https://doi.org/10.1016/j.canlet.2014.12.014.
32. McGuire A, Brown JA, Kerin MJ. Metastatic breast cancer: the potential of miRNA for diagnosis and treatment monitoring. Cancer Metastasis Rev. 2015; 34:145–55. https://doi.org/10.1007/s10555-015-9551-7.
33. Buffa FM, Camps C, Winchester L, Snell CE, Gee HE, Sheldon H, Taylor M, Harris AL, Ragoussis J. microRNA-associated progression pathways and potential therapeutic targets identified by integrated mRNA and microRNA expression profiling in breast cancer. Cancer Res. 2011; 71:5635–45. https://doi.org/10.1158/0008-5472.CAN-11-0489.
34. Wang J, Zhao J, Shi M, Ding Y, Sun H, Yuan F, Zou Z. Elevated expression of miR-210 predicts poor survival of cancer patients: a systematic review and meta-analysis. PLoS One. 2014; 9: e89223. https://doi.org/10.1371/journal.pone.0089223.
35. Hong L, Yang J, Han Y, Lu Q, Cao J, Syed L. High expression of miR-210 predicts poor survival in patients with breast cancer: a meta-analysis. Gene. 2012; 507:135–8. https://doi.org/10.1016/j.gene.2012.07.025.
36. Xie X, Wu W, Liang L, Han S, Chen T, Pan S, Xue M, Li S. Prognostic role of microRNA-210 in various carcinomas: a meta-analysis. Int J Clin Exp Med. 2015; 8:15283–9. https://doi.org/
37. Li M, Fu W, Wo L, Shu X, Liu F, Li C. miR-128 and its target genes in tumorigenesis and metastasis. Exp Cell Res. 2013; 319:3059–64. https://doi.org/10.1016/j.yexcr.2013.07.031.
38. Volinia S, Calin GA, Liu CG, Ambs S, Cimmino A, Petrocca F, Visone R, Iorio M, Roldo C, Ferracin M, Prueitt RL, Yanaihara N, Lanza G, et al. A microRNA expression signature of human solid tumors defines cancer gene targets. Proc Natl Acad Sci U S A. 2006; 103:2257–61. https://doi.org/10.1073/pnas.0510565103.
39. Masri S, Liu Z, Phung S, Wang E, Yuan YC, Chen S. The role of microRNA-128a in regulating TGFbeta signaling in letrozole-resistant breast cancer cells. Breast Cancer Res Treat. 2010; 124:89–99. https://doi.org/10.1007/s10549-009-0716-3.
40. Maqbool R, Rashid R, Ismail R, Niaz S, Chowdri NA, Hussain MU. The carboxy-terminal domain of connexin 43 (CT-Cx43) modulates the expression of p53 by altering miR-125b expression in low-grade human breast cancers. Cell Oncol (Dordr). 2015; 38:443–51. https://doi.org/10.1007/s13402-015-0240-x.
41. Sun Y, Liu X, Zhang Q, Mao X, Feng L, Su P, Chen H, Guo Y, Jin F. Oncogenic potential of TSTA3 in breast cancer and its regulation by the tumor suppressors miR-125a-5p and miR-125b. Tumour Biol. 2016; 37:4963–72. https://doi.org/10.1007/s13277-015-4178-4.
42. Gong C, Tan W, Chen K, You N, Zhu S, Liang G, Xie X, Li Q, Zeng Y, Ouyang N, Li Z, Zeng M, Zhuang S, et al. Prognostic Value of a BCSC-associated MicroRNA Signature in Hormone Receptor-Positive HER2-Negative Breast Cancer. EBioMedicine. 2016; 11:199–209. https://doi.org/10.1016/j.ebiom.2016.08.016.
43. White NM, Chow TF, Mejia-Guerrero S, Diamandis M, Rofael Y, Faragalla H, Mankaruous M, Gabril M, Girgis A, Yousef GM. Three dysregulated miRNAs control kallikrein 10 expression and cell proliferation in ovarian cancer. Br J Cancer. 2010; 102:1244–53. https://doi.org/10.1038/sj.bjc.6605634.
44. Vlachos IS, Paraskevopoulou MD, Karagkouni D, Georgakilas G, Vergoulis T, Kanellos I, Anastasopoulos IL, Maniou S, Karathanou K, Kalfakakou D, Fevgas A, Dalamagas T, Hatzigeorgiou AG. DIANA-TarBase v7.0: indexing more than half a million experimentally supported miRNA:mRNA interactions. Nucleic Acids Res. 2015; 43: D153-9. https://doi.org/10.1093/nar/gku1215.
45. Lai JP, Sandhu DS, Shire AM, Roberts LR. The tumor suppressor function of human sulfatase 1 (SULF1) in carcinogenesis. J Gastrointest Cancer. 2008; 39:149–58. https://doi.org/10.1007/s12029-009-9058-y.
46. Leek JT, Johnson WE, Parker HS, Jaffe AE, Storey JD. The sva package for removing batch effects and other unwanted variation in high-throughput experiments. Bioinformatics. 2012; 28:882–3. https://doi.org/10.1093/bioinformatics/bts034.
47. Ritchie ME, Phipson B, Wu D, Hu Y, Law CW, Shi W, Smyth GK. limma powers differential expression analyses for RNA-sequencing and microarray studies. Nucleic Acids Res. 2015; 43:e47. https://doi.org/10.1093/nar/gkv007.
48. Edgar R, Domrachev M, Lash AE. Gene Expression Omnibus: NCBI gene expression and hybridization array data repository. Nucleic Acids Res. 2002; 30:207–10.
49. Lappalainen I, Almeida-King J, Kumanduri V, Senf A, Spalding JD, ur-Rehman S, Saunders G, Kandasamy J, Caccamo M, Leinonen R, Vaughan B, Laurent T, Rowland F, et al. The European Genome-phenome Archive of human data consented for biomedical research. Nat Genet. 2015; 47:692–5. https://doi.org/10.1038/ng.3312.
50. Haunsberger SJ, Connolly NM, Prehn JH. miRNAmeConverter: an R/bioconductor package for translating mature miRNA names to different miRBase versions. Bioinformatics. 2017; 33:592–3. https://doi.org/10.1093/bioinformatics/btw660.
51. Therneau T. A package for Survival Analysis in S. Version 2.38, https://CRAN.R-project.org/package=survival. 2015.