
INTRODUCTION
Esophageal squamous cell carcinoma (ESCC) is a global health concern, and prevalence is especially high in certain populations in China [1]. The vast majority of patients diagnosed with ESCC enter the clinic at mid- to late stages of disease, and approximately 60% of those individuals have progressed beyond surgical resection as a therapeutic option. These statistics are striking, considering many patients exhibit no symptoms upon diagnosis [2]. Unfortunately, most patients with esophageal carcinoma die within the first 5 years following diagnosis [3]. As such, non-surgical modalities of treatment are of great importance for this population of ESCC patients. Unfortunately, difficulties in the proper assessment of tumor invasion depth before treatment complicate determination of the type and extent of therapy for these patients. Therefore, accurate tumor clinical staging is a necessity for identifying treatment options and aiding in patient prognosis.
The TNM Classification of Malignant Tumors (TNM) system developed by the Union for International Cancer Control (UICC) and the American Joint Committee on Cancer (AJCC) is widely used for tumor staging; however, it currently is only applied in cases of surgical transection in esophageal cancer cases. The depth of tumor invasion determines the T stage in the TNM system, not tumor size or other tumor burden metrics. Endoscopic ultrasound (EUS) is a commonly utilized imaging method for diagnosis and staging of ESCC prior to any treatment. Its utility lies in the ability to differentiate esophageal wall layers. However, the value of EUS for T staging is somewhat unclear due to variability in clinical reports. Though some studies report that ultrasound is useful in identifying early stages of ESCC [4, 5], others suggest is has more diagnostic efficacy in advanced stages of disease [6]. In addition, EUS appears to be less specific and sensitive in determining the depth of tumors, and thus T staging, near the gastroesophageal junction [7]. This is problematic as the majority of esophageal carcinomas occur in the lower esophagus. Other methods of imaging may exhibit a better ability to stage tumors earlier in patients.
In developing countries, including China, EUS and PET / CT clinical staging has not been widely used as a result of limiting economic factors. Starting in 1977, non-surgical staging using barium swallow-indicated esophageal lesion length as staging criteria continues to be widely utilized. However, barium swallow assessment is a dynamic imaging test never clinically intended to accurately provide size and dimension information of esophageal tumors. The consistency of results for this test are dependent on variable patient factors and the radiology personnel performing the tests, making reliability of the barium method questionable.
Computed tomography (CT) scanning is among the most widely used imaging tools for tumor staging prior to surgery. Benefits of CT imaging include the clarity and specificity that allows visualization of esophageal wall thickness and anatomical perimeters. Such detailed imaging is a limitation of EUS compared to CT imaging for the purposes of tumor staging. A clear understanding of tumor depth, as well as extent of local and widespread metastasis, are crucial for developing treatment approaches [8]. Although EUS is often used in assessing tumor depth and initial tumor staging [9], CT imaging is more effective at visualizing the 3-dimensional extent of tumors, their invasion into local structures and involvement of lymph nodes [10]. In addition, CT imaging also provides useful data to radiation oncologists for determining therapy volume. Considering that many clinical centers, EUS and PET are not routinely used for diagnosis and staging of esophageal carcinoma due to shortage of equipment and funding, we prefer to more widespread use of CT imaging for esophageal tumor staging, treatment planning, and prognostication.
For the current study, morphological characteristics of tumor lesions and associated regional anatomical changes were analyzed from 324 patients with ESCC who underwent surgical resection. Imaging modalities and gross examination of tumor tissues were performed and patient survival time was assessed. In summary, the goal of this study was to improve the clinical utility of T staging for esophageal squamous cell carcinoma.
MATERIALS AND METHODS
Ethics statement
Study participants voluntarily agreed to participate in the study and provided written informed consent prior to enrollment. The study was approved by the Ethics Committee of First Hospital of Quanzhou Affiliated to Fujian Medical University. All procedures performed in studies involving human participants were in accordance with the ethical standards of the institutional and/or national research committee and with the 1964 Helsinki declaration and its later amendments or comparable ethical standards.
Clinical data
We obtained esophageal cancer patient information from medical records of the First Hospital of Quanzhou Affiliated to Fujian Medical University from July 2006 - July 2010. In this study, a total of 324 esophageal cancer patients underwent either oncologic or thoracic surgery. All patients received a preoperative, contrast-enhanced chest CT scan and 281 individuals underwent barium esophagraphy performed in our hospital.
We recommend that patients should be followed up every 3 months during the first year after surgery. Specific information should be collected and recorded including detailed medical history, and results of a physical examination. Upper gastrointestinal imaging, upper GI endoscopy, chest and/or abdomen CT, and neck/abdominal color Doppler ultrasound examination should be selected based upon the patient’s condition. Patient survival can be confirmed by monthly telephone follow-up, combined with household registration information.
CT imaging and image analysis
For CT imaging (GE 64-slice spiral CT scanner), the scanning parameters were as follows: 120 kv, 90 mAs, collimation 5.0mm, pitch 25mm, bed-speed 50mm/s, thickness 10mm, layer interval 10mm. Scanning was performed from the neck down to the level of the hepatic portal. Patients received a cubital vein injection of nonionic iodinated contrast agent (100 ml, 3ml/s, 30s) prior to scanning. The raw scanning data were reconstructed to present an image of 2.5mm thickness.
In the NeusoftPacs 3.0 software, the reconstructed image was measured along CT mediastinal window according to the following standards and procedures: 1) Standards for defining presence of lesions were esophageal wall thickness > 5mm and esophageal diameter (without gas) > 10mm accompanied by local irregular luminal narrowing [11, 12]. 2) Visualization is performed in the layer in which the largest cross-sectional area of esophageal lesions is located. The image included the five layers above and below the largest cross-sectional layer, and the software outlined the cross-section, automatically calculated the cross-sectional area, and selected the maximum cross-sectional area. 3) According to the guidelines for evaluating solid tumor treatment response, the largest long diameter and the largest short diameter were measured [13]. 4) The vertical bisector method was used to obtain the center of the trachea/thoracic aorta. The central angle of the esophageal lesion and tracheal/thoracic aorta contact arc were measured using the software (Figures 1 & 2). 5) We calculated the total length of fat decrease between esophageal lesions and the pericardium.
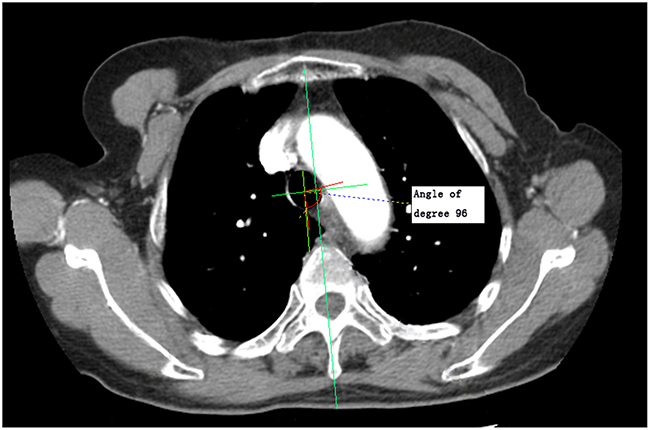
Figure 1: Measurement diagram of the maximum curvature formed by esophageal lesion contact with the trachea.
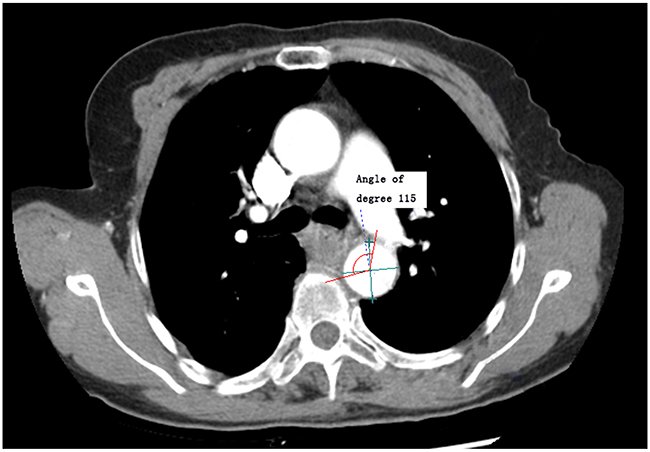
Figure 2: Measurement diagram of the maximum curvature formed by esophageal lesion contact with the thoracic aorta.
Examination following barium intake
Following barium swallow intake (130% W/V), the esophageal outline showing various filling states, mucosal fold characteristics, motility and density were visualized from multiple angles using an Italy GMM OPERA 800mA (DSA) multifunction digital X-ray machine. Anteroposterior, right anterior oblique and left anterior oblique films of the esophagus during barium ingestion were acquired, from which lesion lengths were measured.
Imaging parameter measurements
The imaging parameters included: 1) maximal lesion cross-sectional area; 2) the largest long diameter; 3) the largest short diameter; 4) CT-indicated lesion length; 5) barium-indicated lesion length; 6&7) the curvature formed by lesion contact with the trachea and thoracic aorta, and, 8) the length of pericardial fat reduction, were independently measured by two experienced physicians, a radiologist and radiation oncologist, blinded to other clinical data. If the difference between the measured values by the two experienced physicians was less than 10%, the resulting measurement was the average of the two values. If the measurement differences between these two experienced physicians was greater than 10%, the chief physician in the radiotherapy department re-measured the data, then selected the prior value closest to the new measurement to produce an average.
Statistical analysis
Statistical analyses were performed using SPSS 17.0 software. A paired Student’s t-test was used for the comparison of barium and CT-indicated lesion length values. Correlations between survival time and quantitative data were determined using Cox-regression analysis.
The differences in survival time among the groups were analyzed. All cases were sorted according to the date of operation, with odd cases selected as a training set, and even cases used as validation sets. For the training set, tumor characteristic grouping threshold C1, C2, C3 were selected using a genetic algorithm (GA) for adequate separation of survival times between the four groups. The full dataset was assumed to have a mean μ, and the ith group exhibited a mean μi. The separation of survival times in these four groups was primarily defined as the ratio of variance between groups to the variance within groups:
where
and Var(Num1, …, Num4), the sample size variance of these 4 groups, helps avoid generating insufficiently small groups.
Maximal survival time separation occurs when tumor characteristic group points are appropriately selected. Grouping threshold in Equation (1) were optimized using the global optimization toolbox in Matlab. Survival analysis of surgical staging and different radiographic parameters was performed using Kaplan-Meier survival and Mantel-Cox log rank analyses. Consistency between staging approaches was analyzed with kappa statistics. A P value <0.05 was considered statistically significant.
RESULTS
Of the 324 patients, 239 (73.8%) were male, 85 female (26.2%), with a median age of 56.5 years (range: 35-86 years). According to esophageal cancer staging standards presented in the 2009 UICC TNM 7th edition, 12 patients (3.7%) were diagnosed with upper thoracic esophageal cancer, 205 (63.3%) with middle thoracic esophageal cancer, and 107 (33%) with lower thoracic esophageal cancer. All patients underwent radical esophagectomy, 267 patients received chest/abdomen two-field lymphadenectomy, and 57 received neck/chest/abdomen three-field lymphadenectomy. The median follow-up time was 54 months (95% CI, 2.0-91.6 months).
Postoperative pathological analysis showed that 4 patients exhibited positive margins, while 320 had negative margins. Pathologic cellular differentiation level analysis identified 28 cases at G1, 231 cases at G2, and 62 cases at G3. Concerning pathological T stage assessment, 4 cases were at Tis (carcinoma in situ), 46 at T1, 27 staged at T2, 126 at T3, and 121 cases were at T4 stage. N stages were characterized as follows: N0, 187 cases, N1, 111 cases, N2, 18 cases, and N3, 8 cases. The median OS was 54 months (95% CI, 36.3-76.7 months), with a median follow-up time of 54 months (95% CI, 2.0-91.6 months).
The distribution of eight measured imaging parameters is presented in Table 1. Of the 324 patients in the study, 43 patients did not undergo barium esophagraphy at the hospital; therefore, we were unable to analyze images of barium ingestion in these patients.
Table 1: Patient characteristics (clinical factors and imaging factors) distribution and Cox regression analysis results of radiographic factors across included patients
Characteristics |
Numbers of patients |
95% CI |
Median |
Min |
Max |
P Value* |
||
|---|---|---|---|---|---|---|---|---|
Lower bound |
Upper bound |
|||||||
Largest long diameter (mm) |
324 |
19.6 |
50.9 |
34.7 |
14.4 |
75.8 |
0.000 |
|
Largest short diameter (mm) |
324 |
11.1 |
31.4 |
20.9 |
9 |
63 |
0.094 |
|
Barium lesion length (mm) |
281 |
0 |
70 |
40 |
0 |
120 |
0.104 |
|
CT lesion length (mm) |
324 |
10 |
110 |
50 |
0 |
187.5 |
0.003 |
|
Maximal lesion area (mm2) |
324 |
196.1 |
1091.6 |
535.5 |
0 |
2347 |
0.012 |
|
Maximal curvature angle: esophagus with aorta |
324 |
0 |
196.5 |
87 |
0 |
360 |
0.086 |
|
Maximal curvature angle: esophagus with trachea |
324 |
0 |
113.9 |
0 |
0 |
194 |
0.334 |
|
Length of pericardium invaded (mm) |
324 |
0 |
37.5 |
10 |
0 |
60 |
0.229 |
|
Sex |
Female |
239 |
0.010 |
|||||
Male |
85 |
|||||||
Age |
35 |
86 |
56.5 (yr) |
0.820 |
||||
Adjuvant chemotherapy |
Yes |
93 |
0.586 |
|||||
No |
231 |
|||||||
Adjuvantradiotherapy |
Yes |
22 |
0.226 |
|||||
No |
302 |
|||||||
Primary location |
Upper |
12 |
0.499 |
|||||
Middle |
204 |
|||||||
Lower |
108 |
|||||||
Positive margins |
Yes |
4 |
1.000 |
|||||
No |
320 |
|||||||
Pathologic cellular differentiation level |
G1 |
28 |
0.550 |
|||||
G2 |
231 |
|||||||
G3 |
62 |
|||||||
Type of lymph node dissection |
2-field |
267 |
0.194 |
|||||
3-field |
57 |
|||||||
PathologicalTstage |
Tis+T1 |
50 |
0.000 |
|||||
T2 |
27 |
|||||||
T3 |
126 |
|||||||
T4 |
121 |
|||||||
Pathological N stage |
N0 |
187 |
0.000 |
|||||
N+ |
137 |
|||||||
*As determined by Cox-regression analysis.
Analysis of case variable effects on survival
As shown in Table 1, we performed Cox regression analysis to determine potential impacts of various individual population variables as well as radiographic factors on equation calculation across the included patients. Gender, largest long diameter, CT lesion length, maximal lesion area, pathological T stage and pathological N stage were determined to be of significant influence (Table 1). Other demographic factors such as age, administration of adjuvant radiotherapy and adjuvant chemotherapy, location of thoracic esophageal cancer (upper, middle and lower) and type of lymph node dissection did not significantly affect survival.
Barium and CT lesion length analyses
Significant differences in lesion length measured following barium intake and CT-determined lesion length were determined. (T = 7.14, P < 0.001). Calculation of mean CT lesion length minus the mean esophageal barium lesion length measurement was 10.99 mm (95% CI 7.97-14.02mm).
Survival analysis of surgical staging
Relationship between pathological T stage and survival
The differences among different pathological T stages were statistically significant (P = 0.001). The resulting survival curve is shown in Figure 3. In staging groups, few patients were at Tis stage (n = 4) and they were therefore grouped with patients at T1. As such, all patients in T1 represent patients at Tis and T1 in the study.
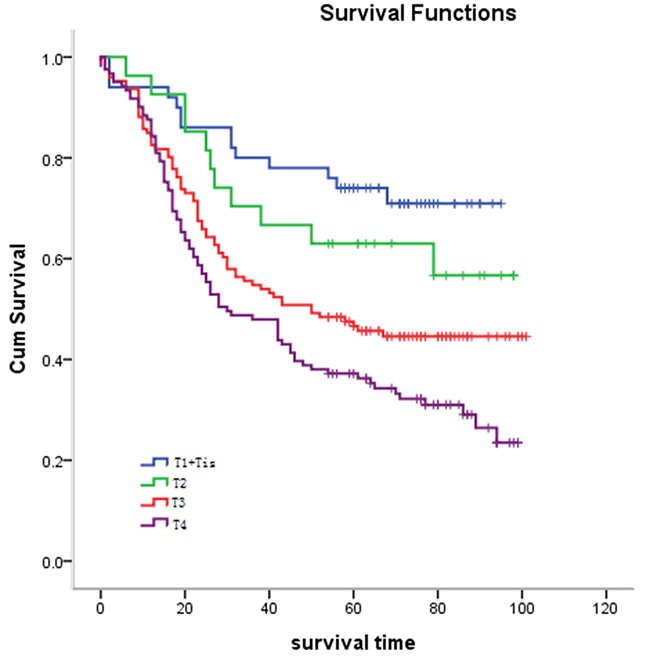
Figure 3: Relationship between pathological T stage and survival. Statistical analysis revealed significant differences between pathological T stage and survival (P = 0.001).
Relationship between pathological N stage and survival
As with T staging, survival differences between pathological N stages was statistically significant (P = 0.001) (Figure 4).
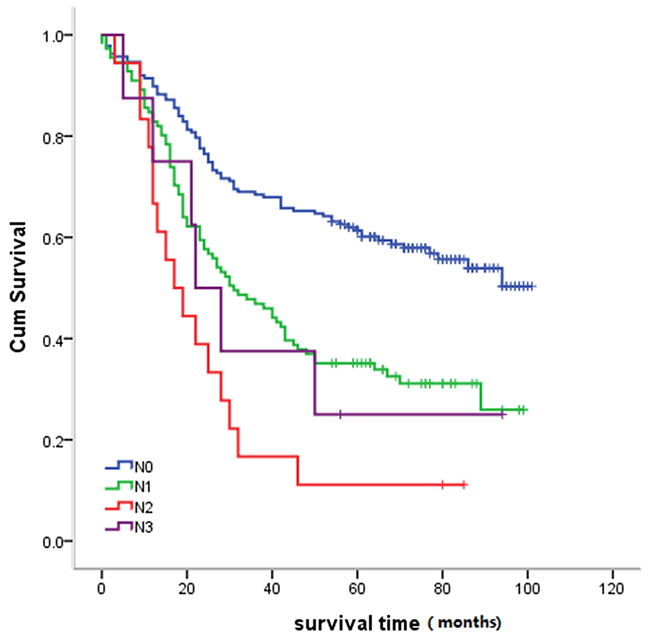
Figure 4: Relationship between survival and pathological N stage. Statistical analysis revealed significant differences between survival and pathological N staging (P = 0.001).
Relationship between histologic grade and survival time
Tumor grade was not statistically significantly associated with survival time (P = 0.85). The survival curve is illustrated in Figure 5.
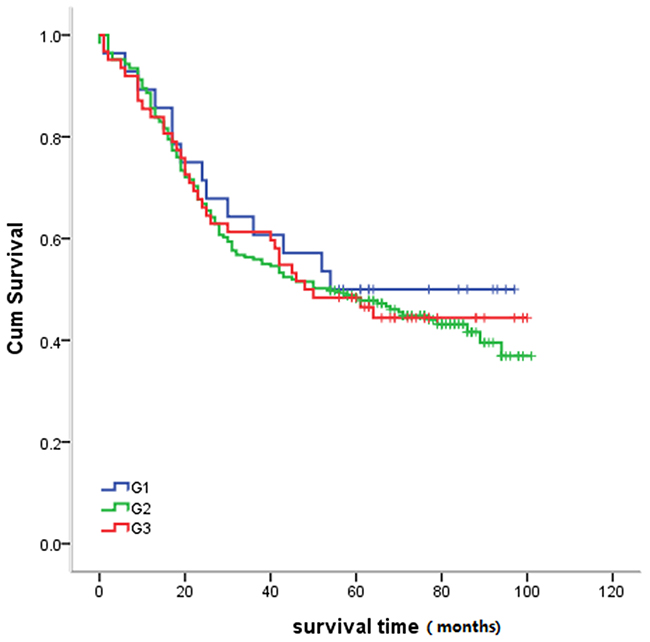
Figure 5: Relationship between histologic grade and survival. Statistical analysis revealed no significant differences between histologic grade and survival (P = 0.85).
Grouping threshold for imaging factor and survival analysis
All cases were sorted according to the date of operation, with odd cases selected as a training set, and even cases used as validation sets. Clinical characteristics of patients in the training and validation sets are shown in Table 2. The clinical characteristics of patients in the two datasets are comparable. Using the method described in Equation (1), the measured values for each image factor in the training dataset was divided into four intervals and evaluated for significant differences in survival time among intervals in the validation dataset. The results show that through grouping maximum esophageal lesion area, largest long diameter and CT lesion length by appropriate intervals, there is a significant difference in the survival time for each factor (p < 0.05). Contrarily, for the factors of barium-indicated lesion length, the curvature formed by lesion contact with the trachea and thoracic aorta, and the length of pericardial fat reduction, there is no difference in the survival time through this grouping method. The optimal thresholds for grouping these indicators to reveal statistical differences in survival curves are discussed below. N0 and N1 were stratified according to lymph node status (because N2 and N3 were only 18 cases and 8 cases, respectively, and were grouped into the N1 category), and analysis of the relationship between imaging group and the survival time under different lymph node status was performed.
Table 2: Clinical characteristics of patients in training set and validation set
Training set |
Validation set |
P Value |
||
|---|---|---|---|---|
Age |
57.46 |
57.21 |
0.19 |
|
Gender |
Male |
115 |
124 |
0.26 |
Female |
47 |
38 |
||
pT |
T1 |
27 |
23 |
0.92 |
T2 |
13 |
14 |
||
T3 |
61 |
65 |
||
T4 |
61 |
60 |
||
pN |
N0 |
100 |
87 |
0.19 |
N1 |
53 |
58 |
||
N2 |
5 |
13 |
||
N3 |
4 |
4 |
||
G |
G1 |
18 |
13 |
0.46 |
G2 |
109 |
121 |
||
G3 |
33 |
30 |
Groups based on maximum esophageal lesion area and survival
As stated in Equation (1), a specified grouping method was utilized to achieve maximal survival curve differences between groups. A genetic optimization algorithm was applied to obtain the four major diameter groups: less than 355.8mm2, 355.8-568.0mm2, 568.0-907.3mm2 and greater than 907.3mm2. According to this threshold, the validation data sets patients were divided into four groups, image T1(iT1), image T2(iT2), image T3(iT3) and image T4(iT4), respectively. The patient number in each group and in N-state stratification is shown in Table 3. Survival was statistically correlated with maximum esophageal lesion area (X2 = 15.862, P = 0.001) (Figure 6A). Pathological N negative group: Survival was statistically correlated with maximum esophageal lesion area (X2 = 10.138, P = 0.017) (Figure 6B). Pathological N positive group: Survival was not correlated with maximum esophageal lesion area (X2 = 4.924, P = 0.177) (Figure 6C).
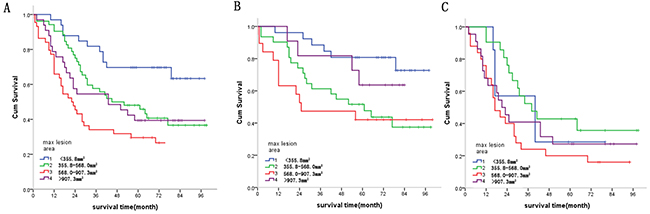
Figure 6: (A) Relationship between maximum esophageal lesion area and survival. Statistical analysis revealed significant differences between maximum esophageal lesion area and survival. (X2 = 15.862, P = 0.001). (B) Survival in pathological N negative patients was statistically correlated with maximum esophageal lesion area (X2 = 10.138, P = 0.017). (C) Survival in pathological N positive patients was not correlated with maximum esophageal lesion area (X2 = 4.924, P = 0.177).
Table 3: The patient number of validation datasets in each group by radiographic factors based stage and the N state based stratification, correlation analysis between imaging group and survival
Radiographic factors based stage |
iT1 |
iT2 |
iT3 |
iT4 |
P value |
|
|---|---|---|---|---|---|---|
Maximum esophageal lesion area |
pN0 |
26 |
31 |
19 |
11 |
0.017 |
*N+ |
7 |
21 |
25 |
22 |
0.177 |
|
Total |
33 |
52 |
44 |
33 |
0.001 |
|
Largest long diameter |
pN0 |
31 |
20 |
15 |
21 |
0.027 |
*N+ |
10 |
14 |
24 |
27 |
0.027 |
|
Total |
41 |
34 |
39 |
48 |
0.001 |
|
CT lesion length |
pN0 |
31 |
26 |
20 |
10 |
0.270 |
*N+ |
12 |
17 |
21 |
25 |
0.224 |
|
Total |
43 |
43 |
41 |
35 |
0.048 |
NOTE: 1.*N+ includes pN1,pN2,pN3; 2. P value refer to correlation between radiographic factors based stage and the N state based stratification and survival.
Groups based on largest long diameter and survival
Four largest long diameter groups, less than 28.7, 28.7-34.6mm, 34.6-41.4mm and greater than 41.4mm were established based on thresholds indicated by a genetic optimization algorithm. According to these thresholds, validation data set patients were divided into groups iT1, iT2, iT3 and iT4, respectively, Patient numbers in each group and in N-state stratification is shown in Table 3. Statistically significant differences in survival were identified between largest long diameter groups (X2 = 20.810, P = 0.001) (Figure 7A). For pathological N negative and pathological N positive groups, survival was statistically correlated with largest long diameter (X2 = 9.201, P = 0.027; X2 = 9.246, P = 0.027, respectively) (Figure 7B–7C, respectively).
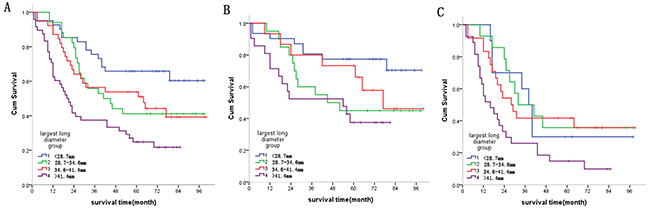
Figure 7: (A) Relationship between largest long diameter and survival. Statistical analysis revealed significant differences between largest long diameter and survival (X2 = 20.810, P = 0.001). (B) Survival in pathological N negative patients was statistically correlated with largest long diameter (X2 = 9.201, P = 0.027); (C) Survival in pathological N positive patients was statistically correlated with largest long diameter (X2 = 9.246, P = 0.027).
Groups based on CT lesion length and survival curves
A genetic optimization algorithm was applied to solve Equation (1) to generate four major groups based on lesion length indicated in CT imaging, less than 30.9mm, 30.9-57.3mm, 57.3-70.6mm and greater than 70.6mm. These lesion length-based validation data sets were designated groups iT1, iT2, iT3 and iT4, respectively. The patient number in each group and in N-state stratification is shown in Table 3. The CT lesion length groups were significantly different (X2 = 7.898, P = 0.048) (Figure 8A). For pathological N negative and pathological N positive groups, survival was not correlated with CT lesion length (X2 =3.918, P = 0.270; X2 = 4.374, P = 0.224, respectively) (Figure 8B–8C, respectively).
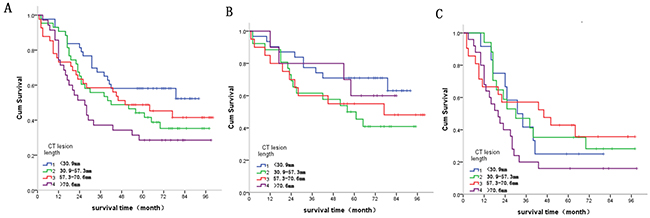
Figure 8: (A) Relationship between CT lesion length and survival. Statistical analysis revealed significant differences between CT lesion length and survival (X2 = 7.898, P = 0.048). (B) Survival in pathological N negative patients was not correlated with CT lesion length (X2 = 3.918, P = 0.270). (C) Survival in pathological N positive patients was not correlated with CT lesion length (X2 = 4.374, P = 0.224).
Consistency analysis of pathological T staging and diameter based groups
The consistency between pathological T stage and maximum esophageal lesion area group, largest long diameter group and CT lesion length group are shown in Table 4 (K = 0.088, 0.118 and, 0.113, respectively). All diameter based groups and pathological T stage were not consistent.
Table 4: Consistency analysis of pathological T staging and diameter based groups
Pathological stage |
Total |
KAPPA value |
|||||
|---|---|---|---|---|---|---|---|
1/Tis |
2 |
3 |
4 |
||||
Max lesion area groups |
1 |
32 |
10 |
16 |
13 |
71 |
0.088 |
2 |
13 |
9 |
48 |
36 |
106 |
||
3 |
4 |
6 |
35 |
50 |
95 |
||
4 |
1 |
2 |
27 |
22 |
52 |
||
Largest long diameter groups |
1 |
34 |
9 |
20 |
18 |
81 |
0.118 |
2 |
7 |
9 |
42 |
22 |
80 |
||
3 |
6 |
6 |
27 |
41 |
80 |
||
4 |
3 |
3 |
37 |
40 |
83 |
||
CT lesion length groups |
1 |
36 |
8 |
25 |
23 |
92 |
0.113 |
2 |
8 |
6 |
43 |
36 |
93 |
||
3 |
4 |
10 |
29 |
30 |
73 |
||
4 |
2 |
3 |
29 |
32 |
66 |
||
Total |
50 |
27 |
126 |
121 |
324 |
||
Survival analysis of diameter based groups across the different treatment
Survival analysis according to administration of adjuvant chemotherapy, adjuvant radiotherapy and type of lymph node dissection was performed on the three diameter based groups (Tables 5–7). No significant differences were observed in 3 field lymph node dissection and postoperative radiotherapy due to rare patient number. In postoperative adjuvant chemotherapy, patient survival in the iT4 group of the largest long diameter was superior to those without adjuvant chemotherapy (X2 = 6.003, P = 0.014).
Table 5: Survival analysis of radiographic-grouping by adjuvant chemotherapy
Radiographic-grouping |
Adjuvant chemotherapy |
Patient number |
Total |
Chi-Square |
P |
|
|---|---|---|---|---|---|---|
Largest long diameter group |
1 |
1 |
24 |
90 |
0.004 |
0.950 |
2 |
66 |
|||||
2 |
1 |
23 |
84 |
0.138 |
0.711 |
|
2 |
61 |
|||||
3 |
1 |
18 |
74 |
0.951 |
0.330 |
|
2 |
56 |
|||||
4 |
1 |
27 |
76 |
6.003 |
0.014 |
|
2 |
49 |
|||||
CT lesion length group |
1 |
1 |
25 |
97 |
0.300 |
0.584 |
2 |
72 |
|||||
2 |
1 |
32 |
88 |
0.000 |
0.986 |
|
2 |
56 |
|||||
3 |
1 |
16 |
73 |
2.500 |
0.114 |
|
2 |
57 |
|||||
4 |
1 |
19 |
66 |
0.129 |
0.719 |
|
2 |
47 |
|||||
Max lesion area group |
1 |
1 |
18 |
78 |
0.281 |
0.596 |
2 |
60 |
|||||
2 |
1 |
24 |
89 |
0.129 |
0.719 |
|
2 |
65 |
|||||
3 |
1 |
23 |
78 |
0.268 |
0.604 |
|
2 |
55 |
|||||
4 |
1 |
27 |
79 |
2.012 |
0.156 |
|
2 |
52 |
|||||
Total |
324 |
|||||
Table 6: Survival analysis of radiographic-grouping by adjuvant radiotherapy
Radiographic-grouping |
Adjuvant radiotherapy (yes = 1, no = 2) |
Patient |
Total |
Chi-Square |
P |
|
|---|---|---|---|---|---|---|
Largest long diameter group |
1 |
1 |
5 |
90 |
1.644 |
0.200 |
2 |
85 |
|||||
2 |
1 |
10 |
84 |
2.171 |
0.141 |
|
2 |
74 |
|||||
3 |
1 |
2 |
74 |
0.083 |
0.774 |
|
2 |
72 |
|||||
4 |
1 |
5 |
76 |
1.327 |
0.249 |
|
2 |
71 |
|||||
CT lesion length group |
1 |
1 |
8 |
97 |
0.358 |
0.550 |
2 |
89 |
|||||
2 |
1 |
9 |
88 |
3.415 |
0.065 |
|
2 |
79 |
|||||
3 |
1 |
3 |
73 |
0.001 |
0.980 |
|
2 |
70 |
|||||
4 |
1 |
2 |
66 |
0.606 |
0.436 |
|
2 |
64 |
|||||
Max lesion area group |
1 |
1 |
8 |
78 |
1.196 |
0.274 |
2 |
70 |
|||||
2 |
1 |
6 |
89 |
0.709 |
0.400 |
|
2 |
83 |
|||||
3 |
1 |
3 |
78 |
8.928 |
0.003 |
|
2 |
75 |
|||||
4 |
1 |
5 |
79 |
0.894 |
0.344 |
|
2 |
74 |
|||||
Total |
324 |
|||||
DISCUSSION
Surgical and radiation therapies are primary treatment modalities for esophageal cancer. Precise staging prior to beginning therapy is critical for the development of individualized treatment programs and improves treatment efficiency and prognostic accuracy. Of all imaging techniques used for the purposes of esophageal tumor staging, the most common method is CT scanning. Other imaging technologies, including magnetic resonance imaging (MRI), endoscopic ultrasound (EUS), and positron emission (PET) scanning, are used increasingly frequently over time for clinical pre-treatment staging. Although the value of CT in clinical staging with use of barium tablets is somewhat inferior to MRI and EUS, the widespread use of CT and its resulting electron density data make CT desirable to many clinicians, especially radiation oncologists in particular, who utilize CT for 3-dimensional treatment planning.
The TNM staging of esophageal cancer, as stated in the current 7th edition of AJCC/UICC, does not help determine clinical staging of esophageal cancer. Rice et al. [14] most recently reported that thirty-three institutions from six continents submitted data using variables with standard definitions: demographics, comorbidities, clinical cancer categories, and all-causes of mortality from first management decision. These data will form the foundation for the 8th edition cancer staging manuals following risk adjustment for patient characteristics, cancer categories, and treatment characteristics and should direct 9th edition data collection. However, it should be noted that Rice et al. concluded “it became evident that clinical categories did not share the same prognostic implications as pathologic categories after esophagectomy alone” [14]. In the study presented here, we compared imaging-based groups and pathological T staging and found no consistencies between imaging T groups and pathologic T staging. Therefore, it is necessary to establish a new clinical T staging approach based on imaging characteristics that are independent of pathological T staging. This new staging system may be valuable for clinical stage of non-surgical patients. Exploration of CT and other radiological imaging-based non-surgical staging still has practical value.
CT exhibits high density and spatial resolution and is very effective at demarcating esophageal borders and illustrating its association with surrounding tissues and organs. Currently CT scan imaging is the main foundation of esophageal gross tumor volume (GTV) delineation [15]. The thickness of normal esophageal wall varies due to different degrees of expansion; however, the wall thickness is usually less than 3mm. An esophageal wall thickness greater than 5 mm is usually regarded as abnormal, but unfortunately, CT based measurements of esophageal wall thickness are currently not very accurate. Studies have previously reported that the accuracy of CT diagnosis of esophageal cancer via T staging was 45% to 80% [16, 17], especially for early stage esophageal lesions, for example those confined to the mucosa or submucosa. During these early stages of disease, wall thickening is not obvious in CT images. The diagnostic accuracy of CT imaging in T staging is remarkably low, with accuracy rates reported as low as 33% [17, 18]. The esophageal mucosa imaging by barium swallow can display small changes, so for early esophageal lesions positioning and measurement. The combination of CT and X-ray imaging comprise a more accurate approach. Non-surgical staging of esophageal cancer is currently based on both CT, barium imaging and EUS (to determine depth of invasion), although it is likely that the eight indicators identified contribute differently by imaging type to non-surgical staging. It is also possible that some of these indicators could be substituted or replaced by others in particular types of assessment of association.
Various characteristics of tumors can be visualized using CT scanning in patients with esophageal carcinoma, such as tumor texture and other morphologic characteristics [19]. Of such characteristics, tumor length has extensive evidence supporting it as a characteristic linked to diagnosis and prognosis in ESCC [20–26]. In the present study, the measured CT esophageal lesion length is larger than barium lesion length, with a mean CT measured length of 10.99mm. Though barium swallow esophagram is often used as a primary imaging modality to identify esophageal masses and wall defects, it is of limited value for the purposes of TNM staging [27]. Concerning non-surgical staging, only one of two possible indicators can be utilized. Our conclusion that the CT-determined esophageal lesion length is greater than that determined via barium esophagram differs from the conclusions presented by Thompson et al [28]. In their study, they report that CT imaging often underestimates tumor length (up to 3cm) compared to imaging with barium swallow intake. Reasons for this difference may be a result of differences in diagnostic criteria. For example, Thompson et al. report that the standard measure of CT lesion length utilized was determined following lesion confirmation by three or more radiologists. Our study did not utilize these criteria in our assessments. In addition, our barium esophagrams may have actually underestimated the length of the tumors, contrary to what Thompson et al. observed. In studies using double-contrast barium imaging, early ESCC exhibits the appearance of small, polypoid lesions, or as flat lesions optimally visualized in profile [29, 30]. They could also appear as superficial mucosal nodules, which would be hard to quantify morphologically [29, 30]. On the opposite spectrum, large masses may have extensive spread and can be better visualized and measured with higher resolution CT imaging. Such underestimation could be why our barium-swallow esophagram measurements did not correlate with overall patient survival.
The present study identified a significant influence of gender on survival. In general, men are at least 3 times more likely to be diagnosed with esophageal cancer than women [31, 32]. Regarding different survival prognosis based different gender, women have a better prognosis upon diagnosis and treatment than men [33]. There are several possible reasons for these differences. Prevalence of ESCC is dependent on many factors including geographic location, lifestyle choices, nutritional quality, and temperature of foods and beverages have been suggested to be risk factors [34–38]. Of those that could account for differences in prevalence and poor prognosis in men, men are more likely to be involved in lifestyle activities such as tobacco and alcohol use [39–41], which are the most common risk factors for ESCC [37, 38]. For example, recent estimates in China for the percentage of males who smoke are about 50%, versus about only 3% of women [39].
Although histopathologic confirmation of malignancy by endoscopic biopsy and CT examination with intravenous contrast are primary and complimentary approaches to diagnosis and staging of esophageal carcinomas, consistency in staging between these modalities is surprisingly debatable. Extensive documentation and comparison of these techniques is available in the literature, and will not be discussed in further detail here. Rather, our focus was to highlight our novel approach to CT-based tumor staging and directly analyze relationships between radiological factors and survival time. By grouping tumor severity by CT and application of algorithms, we evaluated the influence of various different parameters on survival. In our study, we found significant correlations between survival and radiographic characteristics in accordance with algorithmic grouping. With grouping by genetic algorithm, survival time was significantly different among different intervals of CT imaging characteristics including maximum lesion area, largest long and short tumor diameter, and lesion length. The results of our analysis also indicate that surgical staging (T staging and N staging) correlated with survival, while tumor histologic grade was not associated with survival. Our findings highlight and further support the importance of CT imaging for ESCC lesion staging and diagnosis. In the max long diameter group of iT4 patients, the survival of patients with adjuvant chemotherapy was superior to those without adjuvant chemotherapy. In combination with algorithmic grouping, our study may contribute to the establishment of a novel sensitive CT image based clinical staging system, which is a technique that is widely applied clinically in China and other developing countries.
In consideration of the effect of Tis, T1 and positive margin patients on prognosis and the existence of data measurement difficulties, it remains arguable whether to retain this part of the data. Several reasons exist that lead us to believe it is worthwhile to keep this data in the analysis. Firstly, when we exclude the Tis, T1 and positive margin patients and reanalyzed the data and performed a new comparison between the new and previous grouping thresholds (Table 8), we still identify a similar threshold for iT2iT3iT4 to that reported in our previous results. Secondly, the purpose of this study is to investigate radiographic factors as prognostic indicators for survival in ESCC and determine the appropriate radiographic parameters for clinic staging. Tis, T1 and positive margin identification is available only after pathological T staging is performed, although clinic staging typically occurs prior to pathological T staging. It is not possible to obtain this information during clinic staging. According to the Precision Medicine Core of the AJCC, “All predictors must be known at time zero” [42]. We suggest including these data to increase clinical practicability. Thirdly, another arguable point concerns the methods by which researchers delineate the lesions for Tis and T1 patients. We have described the possibility of measurement in our schematic drawing Figure 9. Therefore, we think it is necessary to include these patients in this study.
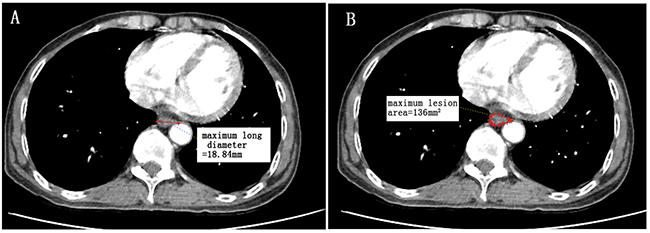
Figure 9: A patient with lower thoracic esophagus squamous cell carcinoma (T1N0M0). An illustration of radiographic factors and endoscopic pathology reports that the distance from the incisors to the proximal edge of the tumor is 36cm. (A) maximum long diameter (18.84mm), (B) maximum lesion area (136mm2). Since no wall thickness was greater than the 5mm level as determined by CT based diagnostic criteria, CT-based lesion length is considered to be 0mm. This patient is “iT1”. (Measured by Neusoft PACS/RIS version 3.1,Neusoft Beyond Technology).
Table 7: Survival analysis of radiographic-grouping by the type of lymph node dissection
Radiographic-grouping |
Lymph node dissection type |
Patient number |
Total |
Chi-square |
P |
|
|---|---|---|---|---|---|---|
Largest long diameter group |
1 |
2 |
65 |
90 |
2.936 |
.087 |
3 |
25 |
|||||
2 |
2 |
72 |
84 |
.376 |
.540 |
|
3 |
12 |
|||||
3 |
2 |
63 |
74 |
1.170 |
.279 |
|
3 |
11 |
|||||
4 |
2 |
67 |
76 |
.059 |
.808 |
|
3 |
9 |
|||||
CT lesion length group |
1 |
2 |
74 |
97 |
6.567 |
.010 |
3 |
23 |
|||||
2 |
2 |
70 |
88 |
.426 |
.514 |
|
3 |
18 |
|||||
3 |
2 |
64 |
73 |
.002 |
.966 |
|
3 |
9 |
|||||
4 |
2 |
59 |
66 |
8.377 |
.004 |
|
3 |
7 |
|||||
Max lesion area group |
1 |
2 |
55 |
78 |
2.631 |
.105 |
3 |
23 |
|||||
2 |
2 |
77 |
89 |
.292 |
.589 |
|
3 |
12 |
|||||
3 |
2 |
66 |
78 |
.010 |
.920 |
|
3 |
12 |
|||||
4 |
2 |
69 |
79 |
.925 |
.336 |
|
3 |
10 |
|||||
Overall |
324 |
|||||
Table 8: Optimal thresholds for imaging in the total dataset and excluding patients with T1, Tis, and positive margins
Maximum esophageal lesion area (mm2) |
Largest long diameter (mm) |
CT lesion length (mm) |
||||
All* |
Delete** |
All* |
Delete** |
All* |
Delete** |
|
iT1 |
<355.8 |
None |
<28.7 |
None |
<30.9 |
None |
iT2 |
355.8-568.0 |
<548.4 |
28.7-34.6 |
<32.7 |
30.9-57.3 |
<60.1 |
iT3 |
568.0-907.3 |
548.4-960.5 |
34.6-41.4 |
32.7-40.3 |
57.3-70.6 |
60.1-71.8 |
iT4 |
≥907.3- |
≥960.5 |
≥41.4 |
≥40.3 |
≥70.6 |
≥71.8 |
NOTE: All*, total dataset; Delete** exclude patients with T1,Tis, positive margin;
None: Patients with T1 and Tis was deleted.
Limitations of this study should be noted. First, we were still unable to combine different imaging parameters into a single criterion for direct application to clinical staging. In addition, this study did not calculate survival-associated groups based on lymph node imaging. The role of T and N staging in esophageal cancer is inseparable, so we try to hierarchically analyze different image T stage by N-state to test whether the image T stage is prognostic in different N states, Although the combination of pathological N stage and image T stage is not related to any practical meaning. Only the largest long diameter was associated with survival in different N states. The maximum esophageal lesion area according to the image T stage are survival-related only in N-negative patients. CT lesion length image T stage did not correlate with survival after stratification by N state. This result may be because the CT image cannot clearly distinguish between esophageal lesions and esophageal lymph nodes. When we measure the largest long diameter, esophageal lymph nodes are inadvertently included, so that the largest long diameter can be associated with survival regardless of N status. According to the AJCC staging system, tumor length may be a strong surrogate benchmark for the presence or absence of nodal disease in early to intermediate stage esophageal cancer [43]. This maybe the reason why CT lesion length image T stage did not correlate with survival after stratification by N stage. Future research will address these limitations and build on the foundation the present study has provided. Continuation of this study will include additional focus on 1) the relationships between survival and imaging characteristics of thoracic esophageal cancer patients that underwent radical radiotherapy and chemotherapy; 2) the relationships between survival and the image-based nodal status (including lymph node status as shown by PET / CT).
CONCLUSION
In conclusion, this is the first clinical study, to the best of our knowledge, to utilize a genetic algorithm to group various types of radiographic characteristics. We found that reasonable stratification of imaging factors, including maximum esophageal lesion area, largest long diameter and lesion length measured in CT is valuable for clinical T staging of thoracic esophagus squamous cell carcinoma. Further optimization and feasibility of this staging approach for patients with non-surgical treatments remains to be further validated.
DECLARATIONS
Ethics statement
Study participants voluntarily agreed to participate in the study and provided written informed consent prior to enrollment. The study was approved by the Ethics Committee of First Hospital of Quanzhou Affiliated to Fujian Medical University. All procedures performed in studies involving human participants were in accordance with the ethical standards of the institutional and/or national research committee and with the 1964 Helsinki declaration and its later amendments or comparable ethical standards.
Consent for publication
All patients have agreed to use their information in this publication.
Availability of data and material
All data generated during the project will be made freely available via First Hospital of Quanzhou Affiliated to Fujian Medical University’s Research Data Repository. DOIs to these data will be provided (as part of the DataCite programme) and cited in any published articles using these data and any other data generated in the project. There are no security, licensing, or ethical issues related to these data.
Author contributions
W. Cai, J. Lu, and X.Yang designed the study; : W. Cai, J. Lu, R. Xu, P. Xin, Jun Xin, Y. Chen, Jieyun Chen and B. Gao performed the study; W. Cai and X. Yang analyzed the data; W. Cai and J. Lu wrote the manuscript; all authors have read the approved the final version of the manuscript.
ACKNOWLEDGMENTS
We thank the support from our colleague of First Hospital of Quanzhou Affiliated to Fujian Medical University.
CONFLICTs OF INTEREST
The authors declare no conflicts of interest.
FUNDING SUPPORT
This project was funded under the Quanzhou Science and Technology Project (#2010Z83) and Fujian Province Innovative Medical Research 2011-CXB-30, People’s Republic of China.
REFERENCES
1. Torre LA, Bray F, Siegel RL, Ferlay J, Lortet-Tieulent J, Jemal A. Global cancer statistics, 2012. CA Cancer J Clin. 2015; 65:87–108. https://doi.org/10.3322/caac.21262.
2. Chen LQ, Hu CY, Ghadirian P, Duranceau A. Early detection of esophageal squamous cell carcinoma and its effects on therapy: an overview. Dis Esophagus. 1999; 12:161–7.
3. Lightdale CJ. Esophageal cancer. american college of gastroenterology. Am J Gastroenterol. 1999; 94:20–9. https://doi.org/10.1111/j.1572-0241.1999.00767.x.
4. Thosani N, Singh H, Kapadia A, Ochi N, Lee JH, Ajani J, Swisher SG, Hofstetter WL, Guha S, Bhutani MS. Diagnostic accuracy of EUS in differentiating mucosal versus submucosal invasion of superficial esophageal cancers: a systematic review and meta-analysis. Gastrointest Endosc. 2012; 75:242–53. https://doi.org/10.1016/j.gie.2011.09.016.
5. Li JJ, Shan HB, Gu MF, He L, He LJ, Chen LM, Luo GY, Xu GL. Endoscopic ultrasound combined with submucosal saline injection for differentiation of T1a and T1b esophageal squamous cell carcinoma: a novel technique. Endoscopy. 2013; 45:667–70. https://doi.org/10.1055/s-0033-1344024.
6. Puli SR, Reddy JB, Bechtold ML, Antillon D, Ibdah JA, Antillon MR. Staging accuracy of esophageal cancer by endoscopic ultrasound: a meta-analysis and systematic review. World J Gastroenterol. 2008; 14:1479–90.
7. Dhupar R, Rice RD, Correa AM, Weston BR, Bhutani MS, Maru DM, Betancourt SL, Rice DC, Swisher SG, Hofstetter WL. Endoscopic ultrasound estimates for tumor depth at the gastroesophageal junction are inaccurate: implications for the liberal use of endoscopic resection. Ann Thorac Surg. 2015; 100:1812–6. https://doi.org/10.1016/j.athoracsur.2015.05.038.
8. Berry MF. Esophageal cancer: staging system and guidelines for staging and treatment. J Thorac Dis. 2014; 6:S289–97. https://doi.org/10.3978/j.issn.2072-1439.2014.03.11.
9. Bruzzi JF, Munden RF, Truong MT, Marom EM, Sabloff BS, Gladish GW, Iyer RB, Pan TS, Macapinlac HA, Erasmus JJ. PET/CT of esophageal cancer: its role in clinical management. Radiographics. 2007; 27:1635–52. https://doi.org/10.1148/rg.276065742.
10. Hong SJ, Kim TJ, Nam KB, Lee IS, Yang HC, Cho S, Kim K, Jheon S, Lee KW. New TNM staging system for esophageal cancer: what chest radiologists need to know. Radiographics. 2014; 34:1722–40. https://doi.org/10.1148/rg.346130079.
11. Moss AA, Schnyder P, Thoeni RF, Margulis AR. Esophageal carcinoma: pretherapy staging by computed tomography. AJR Am J Roentgenol. 1981; 136:1051–6. https://doi.org/10.2214/ajr.136.6.1051.
12. Reinig JW, Stanley JH, Schabel SI. CT evaluation of thickened esophageal walls. AJR Am J Roentgenol. 1983; 140:931–4. https://doi.org/10.2214/ajr.140.5.931.
13. Therasse P, Arbuck SG, Eisenhauer EA, Wanders J, Kaplan RS, Rubinstein L, Verweij J, Van Glabbeke M, van Oosterom AT, Christian MC, Gwyther SG. New guidelines to evaluate the response to treatment in solid tumors. european organization for research and treatment of cancer, national cancer institute of the united states, national cancer institute of canada. J Natl Cancer Inst. 2000; 92:205–16.
14. Rice TW, Apperson-Hansen C, DiPaola LM, Semple ME, Lerut TE, Orringer MB, Chen LQ, Hofstetter WL, Smithers BM, Rusch VW, Wijnhoven BP, Chen KN, Davies AR, et al. Worldwide esophageal cancer collaboration: clinical staging data. Dis Esophagus. 2016; 29:707–14. https://doi.org/10.1111/dote.12493.
15. Thomas L, Lapa C, Bundschuh RA, Polat B, Sonke JJ, Guckenberger M. Tumour delineation in oesophageal cancer - a prospective study of delineation in PET and CT with and without endoscopically placed clip markers. Radiother Oncol. 2015; 116:269–75. https://doi.org/10.1016/j.radonc.2015.07.007.
16. Luo LN, He LJ, Gao XY, Huang XX, Shan HB, Luo GY, Li Y, Lin SY, Wang GB, Zhang R, Xu GL, Li JJ. Endoscopic ultrasound for preoperative esophageal squamous cell carcinoma: a meta-analysis. PLoS One. 2016; 11:e0158373. https://doi.org/10.1371/journal.pone.0158373.
17. Wu LF, Wang BZ, Feng JL, Cheng WR, Liu GR, Xu XH, Zheng ZC. Preoperative TN staging of esophageal cancer: comparison of miniprobe ultrasonography, spiral CT and MRI. World J Gastroenterol. 2003; 9:219–24.
18. Reed CE, Mishra G, Sahai AV, Hoffman BJ, Hawes RH. Esophageal cancer staging: improved accuracy by endoscopic ultrasound of celiac lymph nodes. Ann Thorac Surg. 1999; 67:319–21; discussion 22.
19. Ganeshan B, Skogen K, Pressney I, Coutroubis D, Miles K. Tumour heterogeneity in oesophageal cancer assessed by CT texture analysis: preliminary evidence of an association with tumour metabolism, stage, and survival. Clin Radiol. 2012; 67:157–64. https://doi.org/10.1016/j.crad.2011.08.012.
20. Feng JF, Huang Y, Zhao Q. Tumor length in elderly patients with esophageal squamous cell carcinoma: is it a prognostic factor? Ups J Med Sci. 2013; 118:145–52. https://doi.org/10.3109/03009734.2013.792887.
21. Wang BY, Liu CY, Lin CH, Hsu PK, Hsu WH, Wu YC, Cheng CY. Endoscopic tumor length is an independent prognostic factor in esophageal squamous cell carcinoma. Ann Surg Oncol. 2012; 19:2149–58. https://doi.org/10.1245/s10434-012-2273-y.
22. Wang BY, Goan YG, Hsu PK, Hsu WH, Wu YC. Tumor length as a prognostic factor in esophageal squamous cell carcinoma. Ann Thorac Surg. 2011; 91:887–93. https://doi.org/10.1016/j.athoracsur.2010.11.011.
23. Bollschweiler E, Baldus SE, Schroder W, Schneider PM, Holscher AH. Staging of esophageal carcinoma: length of tumor and number of involved regional lymph nodes. are these independent prognostic factors? J Surg Oncol. 2006; 94:355–63. https://doi.org/10.1002/jso.20569.
24. Akiyama H, Kogure T, Itai Y. The esophageal axis and its relationship to the resectability of carcinoma of the esophagus. Ann Surg. 1972; 176:30–6.
25. Ma MQ, Yu ZT, Tang P, Jiang HJ, Zhao XJ, Zhang JG, Qu DW, Jin QW, Zhang XZ. Is tumor length a prognostic indicator for esophageal squamous cell carcinoma? a single larger study among chinese patients. Int J Clin Exp Pathol. 2015; 8:5008–16.
26. Valmasoni M, Pierobon ES, Ruol A, De Pasqual CA, Zanchettin G, Moletta L, Salvador R, Costantini M, Merigliano S. Endoscopic tumor length should be reincluded in the esophageal cancer staging system: analyses of 662 consecutive patients. PLoS One. 2016; 11:e0153068. https://doi.org/10.1371/journal.pone.0153068.
27. Patel AN, Buenaventura PO. Current staging of esophageal carcinoma. Surg Clin North Am. 2005; 85:555–67. https://doi.org/10.1016/j.suc.2005.01.012.
28. Thompson WM, Halvorsen RA, Foster WL Jr, Williford ME, Postlethwait RW, Korobkin M. Computed tomography for staging esophageal and gastroesophageal cancer: reevaluation. AJR Am J Roentgenol. 1983; 141:951–8. https://doi.org/10.2214/ajr.141.5.951.
29. Gore RM, Mehta UK, Berlin JW, Rao V, Newmark GM. Upper gastrointestinal tumours: diagnosis and staging. Cancer Imaging. 2006; 6:213–7. https://doi.org/10.1102/1470-7330.2006.0032.
30. Gore RM. Upper gastrointestinal tract tumours: diagnosis and staging strategies. Cancer Imaging. 2005; 5:95–8. https://doi.org/10.1102/1470-7330.2005.0020.
31. Eloubeidi MA, Desmond R, Arguedas MR, Reed CE, Wilcox CM. Prognostic factors for the survival of patients with esophageal carcinoma in the u.s.: the importance of tumor length and lymph node status. Cancer. 2002; 95:1434–43. https://doi.org/10.1002/cncr.10868.
32. Liu J, Wei Z, Zhang J, Hu W, Ma Z, Liu Q. Which factors are associated with extremely short-term survival after surgery in patients with esophageal squamous cell carcinoma? Asia Pac J Clin Oncol. 2016; 12:308–13. https://doi.org/10.1111/ajco.12503.
33. Su XD, Zhang X, Xie HJ, Lin P, Zhang L, Rong T. Younger women have a better prognosis among patients with esophageal squamous cell carcinoma after esophagectomy. J Thorac Dis. 2016; 8:872–9. https://doi.org/10.21037/jtd.2016.03.49.
34. Islami F, Boffetta P, Ren JS, Pedoeim L, Khatib D, Kamangar F. High-temperature beverages and foods and esophageal cancer risk--a systematic review. Int J Cancer. 2009; 125:491–524. https://doi.org/10.1002/ijc.24445.
35. Rasool S, A Ganai B, Syed Sameer A, Masood A. Esophageal cancer: associated factors with special reference to the kashmir valley. Tumori. 2012; 98:191–203. https://doi.org/10.1700/1088.11929.
36. Islami F, Pourshams A, Nasrollahzadeh D, Kamangar F, Fahimi S, Shakeri R, Abedi-Ardekani B, Merat S, Vahedi H, Semnani S, Abnet CC, Brennan P, Moller H, et al. Tea drinking habits and oesophageal cancer in a high risk area in northern iran: population based case-control study. BMJ. 2009; 338:b929. https://doi.org/10.1136/bmj.b929.
37. Ishikawa A, Kuriyama S, Tsubono Y, Fukao A, Takahashi H, Tachiya H, Tsuji I. Smoking, alcohol drinking, green tea consumption and the risk of esophageal cancer in japanese men. J Epidemiol. 2006; 16:185–92.
38. Freedman ND, Abnet CC, Leitzmann MF, Mouw T, Subar AF, Hollenbeck AR, Schatzkin A. A prospective study of tobacco, alcohol, and the risk of esophageal and gastric cancer subtypes. Am J Epidemiol. 2007; 165:1424–33. https://doi.org/10.1093/aje/kwm051.
39. Li S, Meng L, Chiolero A, Ma C, Xi B. Trends in smoking prevalence and attributable mortality in China, 1991-2011. Prev Med. 2016; 93:82–7. https://doi.org/10.1016/j.ypmed.2016.09.027.
40. Praud D, Rota M, Rehm J, Shield K, Zatonski W, Hashibe M, La Vecchia C, Boffetta P. Cancer incidence and mortality attributable to alcohol consumption. Int J Cancer. 2016; 138:1380–7. https://doi.org/10.1002/ijc.29890.
41. Payne S. ‘smoke like a man, die like a man’?: a review of the relationship between gender, sex and lung cancer. Soc Sci Med. 2001; 53:1067–80.
42. Kattan MW, Hess KR, Amin MB, Lu Y, Moons KG, Gershenwald JE, Gimotty PA, Guinney JH, Halabi S, Lazar AJ, Mahar AL, Patel T, Sargent DJ, et al. American joint committee on cancer acceptance criteria for inclusion of risk models for individualized prognosis in the practice of precision medicine. CA Cancer J Clin. 2016; 66:370–4. https://doi.org/10.3322/caac.21339.
43. Amin MB, Edge S, Greene F, Byrd DR, Brookland RK, Washington MK, Gershenwald JE, Compton CC, Hess KR, Sullivan DC, Jessup JM, Brierley JD, Gaspar LE, et al. AJCC Cancer Staging Manual. 8th ed. Switzerland: Springer, 2017:184–202. https://doi.org/10.1007/978-3-319-40618-3_16.