
INTRODUCTION
Gastric cancer (GC) is one of the most common malignant tumors. In 2012, approximately 951,600 new cases of GC were diagnosed, and 723,100 deaths resulted from GC worldwide [1]. In China in 2015, GC ranked second and third for the most commonly diagnosed cancers among men and women, respectively [2]. However, GC is a complicated disease, with histological and aetiological heterogeneity [3], and it exhibits a wide range of molecular alterations [4]. Even patients in similar clinical stages can experience vastly different outcomes [5]. This may be due to the diverse molecular characteristics of GC. Both the Cancer Genome Atlas Research Group (TCGA) and the Asian Cancer Research Group (ACRG) have proposed molecular classification systems which divide GC into different groups based on gene expression profiling [3, 6], aiming at specific GC molecular phenotypes. Although a decline in incidence and mortality rates has been observed in recent years, GC still has a poor prognosis, with only 28.3% of new cases expected to survive longer than 5 years [7]. Therefore, finding ways to improve prognostic conditions or explore aberrant molecular biomarkers of GC patients remains an important yet difficult challenge for scientists and researchers.
With the development of microarray and sequencing technologies, as well as available transcriptome profiling datasets such as TCGA and the Gene Expression Omnibus (GEO), gene expression profiling studies on GC have been increasingly reported. Differentially expressed genes and their integrated biological pathways and molecular functions are increasingly being considered as potential diagnostic markers, therapeutic targets, or biomarkers for many diseases [8, 9] and cancers [10, 11]. Diverse gene expression-based prognostic systems have also been established for many cancers including GC [12–14] to assess prognoses risk of patients [5, 15–17]. In one study, researchers used microarray technologies based on 65 GC patients to identify a 6-gene signature associated with relapse [5]. These six genes (CTNNB1, EXOSC3, TOP2A, LBA1, LZTR1 and CCL5) were shown to be significantly associated with survival and early relapse, which hold strong clinical implications. In another study, researchers developed a 53-gene signature and a prognostic scoring system for GC using a canonical discriminant analysis [15].
Although there have been recent discoveries identifying molecular markers and potential constructions of gene models for GC, there are still only a few gene signatures designed to assess prognosis and overall survival (OS). Effective and strong methods for assembling these gene models are still difficult to formulate.
In order to explore the molecular features and biological significance possessed by certain genes, and to better assess the prognosis of GC, we have successfully developed a six-gene signature as a prognostic predictor of patients with GC based on robust likelihood-based survival modeling. We further established a prognostic risk scoring system to predict OS of GC patients. Based on internal and external data validations, we have demonstrated the strong reliability of this signature. Therefore, our six-gene signature can provide new insights and promising biomarkers for GC prognosis, and it may also aid in the discovery of novel therapeutic targets for GC in clinical applications.
RESULTS
Identification of perturbed genes associated with overall survival
In this study, we developed a multi-step strategy to establish a gene signature for the prognostic prediction of patients with GC (Figure 1). First, a dataset of GC patient gene expression profiles (GSE62254, 300 tumor samples) was downloaded from the GEO database. We used this dataset as a training set for the prognosis model construction. When the data generation of gene expression was analyzed, a total of 21,755 genes were enrolled for further study. We next performed primary screening to select significant genes that may be involved in tumor development and progression. These genes would be expected to display differential expression patterns among different GC patients. We therefore used the following screening conditions: 1) the median expression level of the target gene was higher than 70% of total samples; and 2) the variance expression level of the target gene was higher than 70% of total samples. Following these conditions, we found 12,695 genes with high expression and alteration levels among the different GC samples.
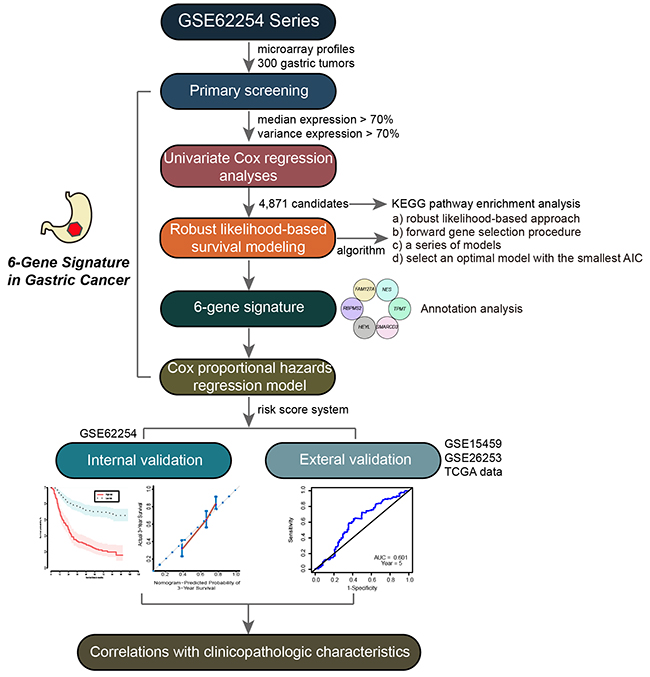
Figure 1: Workflow of the multi-step strategy for developing the six-gene signature as a prognostic predictor of patients with GC.
In the GSE62254 dataset, each patient sample included detailed clinicopathologic information, survival time, and status. To evaluate the prognostic value of the above genes in GC patients, we performed univariate survival analysis using the Cox proportional hazard regression model, with p < 0.05 as the threshold. 4,871 genes were found to be associated with the OS of GC patients (Supplementary Table 1). A pathway enrichment analysis was then carried out with WebGestalt (http://bioinfo.vanderbilt.edu/webgestalt/option.php) [18], using the Fisher’s exact test with an adjusted p-value of 0.05. We found that these genes were significantly enriched in cancer-related pathways including pathways in cancer, p53 signaling pathway, metabolic pathways, and MAPK signaling pathway (Figure 2A). This suggested that the genes identified above should be involved in GC progression and contribute strongly as genes signatures in GC.
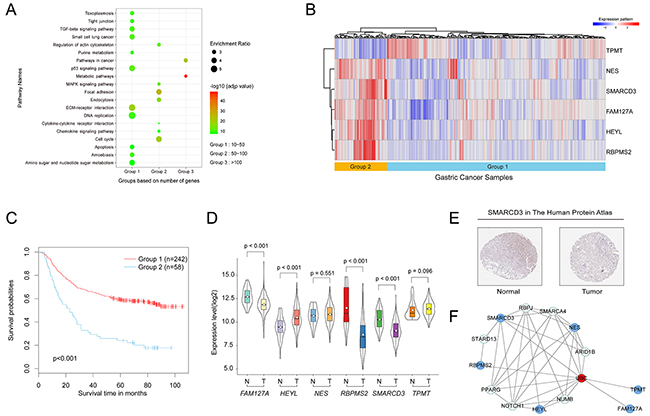
Figure 2: Establishment of the six-gene signature and molecular characteristics of the six genes in GC. (A) Pathway enrichment analysis of genes associated with the OS of patients. (B) Heat map of the expression patterns of the six genes in the training set. (C) Kaplan–Meier curves for the six-gene signature in the training set (log-rank test p-value <0.001). (D) Violin plot of the expression patterns of the six genes from 375 tumor samples and 32 normal samples in the TCGA database (https://cancergenome.nih.gov/). (E) SMARCD3 expression in normal stomach tissue and tumor tissues taken from The Human Protein Atlas (http://www.proteinatlas.org) online database. (F) A protein-protein interaction network was developed based on the STRING database and generated using the Cytoscape software. Blue nodes represent the six genes above. The red node represents at the hub gene that connects all six genes.
Establishment of the six-gene signature of GC by robust likelihood-based survival modeling
In order to build a strong gene model able to predict OS of patients with GC, we used robust likelihood-based survival modeling. This utilized the partial likelihood of the Cox model to select significant survival-associated genes, where available using the rbsurv package in the R language environment. Briefly, given data with large variability, this cross-validation method separates samples into training and validation sets. In the forward selection steps, it develops a series of gene models in which AICs are calculated and an optimal model with the smallest AICs is defined.
Based on the above algorithm, we established a six-gene signature for the prognostic predictor of GC. The six survival-associated genes selected by AICs were RBPMS2, HEYL, NES, TPMT, SMARCD3 and FAM127A. Using the hierarchical clustering analysis, 300 patients were divided into two groups according to their expression patterns (Figure 2B). Kaplan–Meier curves were then used to compare different outcomes of GC patients in the two groups (Figure 2C). We found that patients in group 1 had significantly better OS outcomes than patients in group 2 (log-rank test p-value <0.001). Therefore, these six genes were considered to be prognostic predictor for patients with GC.
Molecular characteristics of the six genes in GC
To explore whether the expression of these genes are dysregulated in the tumors compared to the normal tissues in GC, we compared their expression levels between tumor and normal tissues in the TCGA database. We downloaded gene expression profiling data from a total of 375 GC tumor samples and 32 adjacent normal stomach samples. As Figure 2D shows, the expression level of FAM127A, RBPMS2 and SMARCD3 were significantly down-regulated in tumor tissues compared with normal stomach. Conversely, the expression level of HEYL was up-regulated in tumor tissues. Both NES and TPMT genes were not differentially expressed between tumor and normal tissues. Meanwhile, we compared these six genes expression in 27 pairs of tumor and their matched normal tissues in TCGA. Results were consistent with above that FAM127A (p-value=0.003), RBPMS2 (p-value<0.001), SMARCD3 (p-value<0.001) and HEYL (p-value=0.009) were dysregulated. Both NES (p-value=0.458) and TPMT (p-value=0.135) genes were also not differentially expressed. FAM127A, previously named CXX1, was identified as down-regulated in GC in another study [19]. Likewise, studies of colon and breast cancer showed that HEYL was highly expressed in cancerous endothelial cells compared to their normal counterparts [20–22]. Surprisingly, one study found RBPMS2 to be up-regulated in gastrointestinal stromal tumors when compared to normal adult gastrointestinal tissues [23].
To determine normal protein expression of the six genes, we analyzed them in The Human Protein Atlas database. We found that SMARCD3 is strongly expressed in healthy stomach tissues and weakly expressed in tumor tissues (Figure 2E), consistent with results from the TCGA database.
Subsequently, the STRING database was used to illustrate the protein-protein interaction (PPI) network of the above genes. The PPI correlations were generated using the Cytoscape software. As shown in Figure 2F, these six genes may not directly connect with each other until ubiquitin C (UBC) was added into this interaction that we made up an interactive network.
Since the 6-gene signature is generated from tumor samples to predict the prognosis with high risks or low risks, we compared the gene expression of these 6 individual genes by analyzing them between different histological types of GC cell lines. We used the database “The Cancer Cell Line Encyclopedia (CCLE)” (https://portals.broadinstitute.org/ccle/home) which provides public access to genomic data for 38 GC cell lines (Supplementary Table 2). We first download the gene expression profile of these six genes. Then we drew heatmap in R to compare the expression of these 6 genes in high and low-grade GC cell lines (tubular adenocarcinoma, signet ring adenocarcinoma and undifferentiated adenocarcinoma) in Supplementary Figure 1A. However, similar histological types were not obviously clustered together. Using analysis of variance (ANOVA), we found that there was no statistically significance (p-value>0.05). Next, we picked out the intestinal and diffuse type GC cell lines (Supplementary Figure 1B). We found that the expressions of NES (3.05 fold-change), FAM127A (3.96 fold-change) and SAMRCD3 (1.19 fold-change) in the diffuse type were higher than those in the intestinal type. In our results, this six-gene signature was established by a robust survival model. So they were closely associated with prognosis rather than histological type.
Establishment of a prognostic risk scoring system for the six-gene signature
To develop a prognostic risk scoring system for the six-gene signature to predict the OS of GC patients, we used the Cox proportional hazard regression to obtain the regression coefficient of each gene, using the survival package in the R language. We established the risk scoring system using gene expression values (log2-transformed) as follows: risk scoring = (0.199) * FAM127A value + (0.709) * SMARCD3 value + (-1.381)* TPMT value + (-0.153)* HEYL value + (1.930)* NES value + (0.656)* RBPMS2 value. We then calculated the risk score of each patient in the training set. As shown in Figure 3A, the area under the time-dependent ROC curve (AUC) was 0.760 for predicting 5-year survival by the survivalROC package in the R language environment, indicating the accuracy of prognostic prediction based on our six-gene signature.
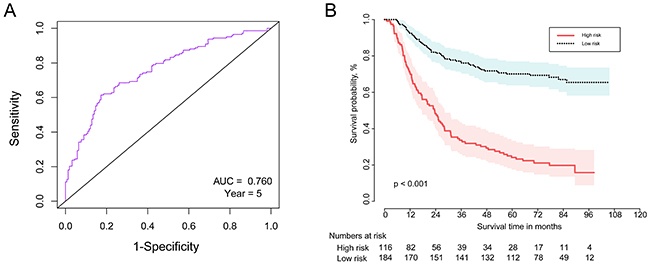
Figure 3: The time-dependent ROC and Kaplan–Meier curve for the six-gene signature in the training set. (A) The time-dependent ROC curve for predicting the 5-year survival. (B) The Kaplan–Meier curve for the six-gene signature that divided the 300 patients by the optimum cut-off point (log-rank test p-value <0.001). Survival probability is shown on the y-axis and survival time in months is on the x-axis. Shaded ribbons denote 95% confidence intervals (95%CI).
We then separated the 300 GC patients into high- and low-risk groups using the optimum cut-off point of the risk score according to the ROC curve. Patients in the high-risk group had significantly poorer OS results compared with those in the low-risk group (log-rank test p-value <0.001) (Figure 3B). Therefore, our six-gene signature can strongly predict OS for GC patients.
Internal and external data validation of the six-gene signature in GC
To demonstrate the robustness of the six-gene signature, we used internal and external data for verification. We first constructed a prognostic nomogram to visualize our Cox proportional hazard regression (Figure 4A). This nomogram is able to predict the 3- and 5-year OS using the expression levels of all six genes. The nomogram illustrated that NES is the largest contributor to prognosis, followed by RBPMS2, TPMT, SMARCD3, FAM127A, then HEYL. The C-index was calculated to evaluate the performance of this nomogram with a calibration curve conducted to determine its discrimination and prediction. The C-index was 0.696 (95%CI: 0.6579-0.7351, p-value < 0.001) and the calibration plot for the probability of the 3- and 5-years survival showed optimal agreement between prediction by the nomogram and the actual observation (Figure 4B and 4C).
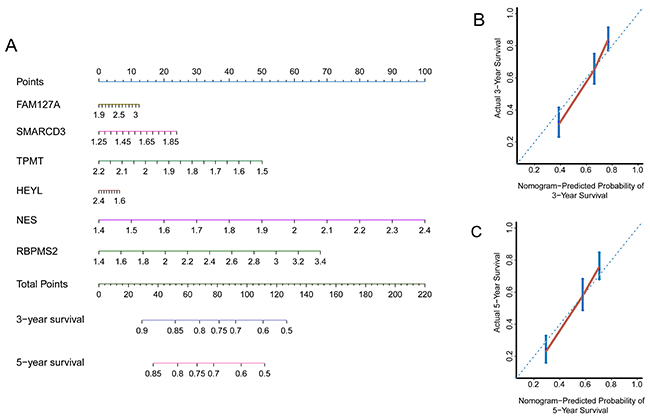
Figure 4: Internal data validation of the nomogram and calibration plots. (A) Prognostic nomogram able to predict the 3- and 5-year OS (In brief, draw an upward vertical line from each individual gene line to the “points” line to calculate the score for each factor. Based on the sum of the points of all six genes, draw a downward vertical line from the “total points” line to calculate the 3- or 5-year survival. (B) Calibration plot of the nomogram for the probability of the 3-year survival. (C) Calibration plot of a nomogram for the probability of 5-year survival (Nomogram-predicted probability of survival is plotted on the x-axis; actual survival is plotted on the y-axis).
We next used an independent cohort of patients from the GEO series GSE15459, (n=192, with detailed clinicopathologic and survival information) as an external validation set. The gene expression array platform for this dataset was the same as for the training set previously described. The survival risk score of each patient was calculated based on the above results. The time-dependent ROC curve results demonstrated that this six-gene signature can appropriately predict OS for patients with GC (AUC = 0.601, year=5, Figure 5A). When we used the same cut-off point as in the training set for risk score (cut-off point = 3.562) to separate all patients in the validation set, as shown in Figure 5B, the Kaplan-Meier curves indicated significant differences between high-risk and low-risk groups (log-rank test p-value=0.039). We again divided all patients into two risk groups based on the optimal cut-off risk scoring (Figure 5C), and Kaplan-Meier curves indicated significant differences between the high- and low-risk groups (log-rank test p-value=0.004).
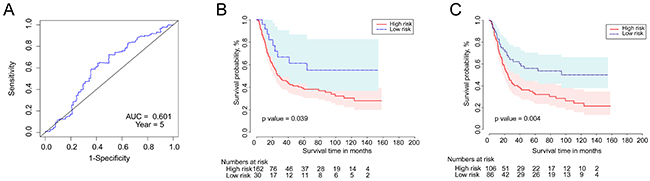
Figure 5: The time-dependent ROC and Kaplan–Meier curves for the six-gene signature in the validation set. (A) The time-dependent ROC curve for predicting the 5-year survival. (B) The Kaplan–Meier curve for the six-gene signature dividing 192 patients by the above cut-off point (log-rank test p-value =0.039). Survival probability is shown on the y-axis and survival time in months is on the x-axis. Shaded ribbons denote 95% confidence intervals (95%CI). (C) The Kaplan–Meier curve based on optimal cut-off point (log-rank test p-value =0.004).
Besides GSE15459, we also employed another two series GSE26253 (n=432) and TCGA data (n=368) to verify robustness of our six-gene signature. The survival risk score of each patient was calculated based on the above results. Kaplan-Meier curves also indicated significant differences between 5-year OS of two risk groups in GSE26253 (p-value=0.010, Supplementary Figure 2A) and TCGA (p-value= 0.022, Supplementary Figure 2B). Therefore, our six-gene signature is functional for the prognostic prediction of patients with GC.
Correlations between the six-gene signature and clinicopathologic characteristics
In order to investigate the association of the six-gene signature with clinical information in GC, we performed univariate and multivariate Cox regression analyses for the external validation set. The univariate survival analysis revealed that the six-gene signature (p-value=0.043) and the tumor stage (p-value<0.001) were both prognostic factors for OS. The multivariate analysis confirmed that the six-gene signature (p-value=0.032) and the tumor stage (p-value<0.001) can be considered as independent prognostic indicators in predicting the OS of patients with GC (Table 1).
Table 1: Univariate and multivariate Cox regression analyses of prognostic factors for patients with GC (HR: Hazard Ratio)
Variables |
No. of patients |
Univariate analysis |
Multivariate analysis |
||||
|---|---|---|---|---|---|---|---|
HR |
95% CI |
p-value |
HR |
95% CI |
p-value |
||
Age at surgery |
|
0.888 |
0.593-1.330 |
0.564 |
1.114 |
0.734-1.692 |
0.612 |
≤64.8 |
77 |
|
|
|
|
|
|
>64.8 |
115 |
|
|
|
|
|
|
Gender |
|
0.925 |
0.610-1.402 |
0.712 |
1.319 |
0.854-2.036 |
0.212 |
Male |
118 |
|
|
|
|
|
|
Female |
74 |
|
|
|
|
|
|
Lauren classification |
|
1.03 |
0.689-1.542 |
0.885 |
0.777 |
0.506-1.194 |
0.25 |
Intestinal |
96 |
|
|
|
|
|
|
Diffuse + Mixed |
96 |
|
|
|
|
|
|
Stage |
|
5.311 |
3.032-9.301 |
<0.001 |
5.909 |
3.323-10.508 |
<0.001 |
I + II |
61 |
|
|
|
|
|
|
III + IV |
131 |
|
|
|
|
|
|
Groups |
|
2.036 |
1.024-4.050 |
0.043 |
2.235 |
1.070-4.669 |
0.032 |
Low Risk |
30 |
|
|
|
|
|
|
High Risk |
162 |
|
|
|
|
|
|
Finally, we performed the Chi-square test to explore correlations between the six-gene signature and clinicopathologic information. Table 2 shows that risk groups of the six-gene signature were only significantly correlated with the Lauren classification (p-value<0.001). Therefore, this six-gene signature may take part in the development and progression of GC.
Table 2: Correlations between the six-gene signature and clinicopathologic characteristics (χ2 and p-value were obtained from the Chi-square test using SPSS software)
|
Age |
χ2 |
p-value |
Gender |
χ2 |
p-value |
Lauren classification |
χ2 |
p-value |
Stage |
χ2 |
p-value |
||||
|---|---|---|---|---|---|---|---|---|---|---|---|---|---|---|---|---|
|
≤64.8 |
>64.8 |
|
|
Male |
Female |
|
|
Diffuse + Mixed |
Intestinal |
|
|
I + II |
III + IV |
|
|
Groups |
|
|
2.673 |
0.102 |
|
|
3.472 |
0.062 |
|
|
12.800 |
<0.001 |
|
|
2.193 |
0.139 |
High Risk |
69 |
93 |
|
|
95 |
67 |
|
|
72 |
90 |
|
|
48 |
114 |
|
|
Low Risk |
8 |
22 |
|
|
23 |
7 |
|
|
24 |
6 |
|
|
13 |
17 |
|
|
DISCUSSION
In the present study, we aimed to explore the molecular characteristics of GC and build a potential gene model to assess its prognosis. We successfully developed a six-gene signature for the prognostic prediction of patients with GC based on robust likelihood-based survival modeling. Simultaneously, we also established a prognostic risk scoring system to predict patient OS and presented validation of the external data. Collectively, our results can provide new insights and promising biomarkers for GC prognosis, and may help to discover novel therapeutic targets for GC in clinical applications.
Many genes have been shown to be differentially expressed and involved in the tumorigenesis of malignant tumors. Liang et al. identified 3,500 differentially expressed genes (DEGs) in colorectal cancer (CRC), including 1,370 up- and 2,130 down-regulated genes. These DEGs were enriched in significant biological pathways including cell cycle, DNA replication, and metabolism, suggesting that they can be used as molecular targets and diagnostic biomarkers for CRC [10]. However, there have only been a few studies correlating genes or gene models with patient prognosis and survival. For example, a prognostic 4-gene expression signature for squamous cell lung carcinoma was established using the LASSO method to select key genes influencing patient prognosis [24]. Also, RNA-seq data and clinical information from TCGA were combined with a stepwise multivariable Cox analysis to obtain a 4-gene signature including one lncRNA in lung adenocarcinoma [25]. In a screen for the gene signatures in colon cancer recurrence, a 15-gene signature was identified using the support vector machine (SVM) analysis [26]. In GC, a total of 17 genes, including DAB2, ALDH2, CD58, CITED2, BNIP3L, SLC43A2, FAU, and COL5A1 were identified as signature genes associated with prognosis [17]. Similarly, based on the GEO database and the LASSO method, five or more genes in the 11-gene model generated were able to evaluate the prognostic risk of GC patients [16]. These potential gene models for predicting the OS and prognosis of patients may be applied in further clinical practice. We have generated a table with comparison of these published studies (Supplementary Table 3) [5, 15, 16, 27–29]. However, we found out that no genes were overlapped between our present study and others. The reasons may due to different databases used, different platforms as well as different analysis methods, suggesting us there exists different and various gene signatures or panels for predicting the OS and prognosis of GC patients.
For the six-gene signature developed here, expression levels of FAM127A, RBPMS2 and SMARCD3 were seen to be down-regulated in tumor tissues compared with healthy stomach, HEYL was up-regulated, and neither NES nor TPMT were differentially expressed between tumor and normal tissues in the TCGA database (Figure 2D). FAM127A (family with sequence similarity 127, member A), a protein coding gene previously named CXX1, was identified to be down-regulated gene in eight GC cell lines compared with a normal gastric cell line using cDNA microarray [19]. RBPMS2 (RNA binding protein with multiple splicing 2), which functions in mRNA and nucleotide binding and is shown to be involved in the regulation of gastrointestinal smooth muscle differentiation and proliferation [30], was shown to be 42-fold higher in gastrointestinal stromal tumors than in the control samples [23]. RBPMS2 with the rs11672691 SNP was significantly associated with gene expression after accounting for multiple comparisons for each SNP in prostate cancer [31]. SMARCD3 (SWI/SNF related, matrix associated, actin dependent regulator of chromatin, subfamily d, member 3) is a member of the SWI/SNF family of proteins, regulating gene transcription. Smarcd3/Baf60c has been proven to epigenetically induce the epithelial-mesenchymal transition by activating the Wnt signaling pathway [32]. In one study, the expression level of SMARCD3 was reduced in a subset of endometrial cancer samples, particularly in those samples with loss of ARID1A expression [33]. HEYL (hes-related family bHLH transcription factor with YRPW motif-like), which functions as a direct target of the Notch signaling pathway [34], was significantly higher in breast tumors compared to normal breast tissue [22]. This study, also demonstrated that HEYL can inhibit TGF-β signaling by binding Smad proteins to promote the occurrence of breast cancer. NES (nestin) was shown to be in the regulation of cell proliferation, cycle, survival, apoptosis and other molecular functions. Nestin expression has also been detected in many types of human solid tumors [35]. The genetic polymorphism of TPMT (thiopurine S-methyltransferase) has been shown to be one of the most striking examples of pharmacogenetics in cancer therapy [36].
Meanwhile, we have built protein-protein interaction based on these six genes. As shown in Figure 2F, these six genes may not directly connect with each other until ubiquitin C (UBC) was added into this interaction. Ubiquitin and ubiquitin-like proteins (Ubls) are not only associated with protein degradation, but are also closely involved in many other cellular functions, such as proliferation, apoptosis, cell cycle, and DNA repair [37]. Moreover, the UBC gene has been considered as an effective radiosensitizing target in non-small cell lung cancer [38].
In the comparison of histological type cell lines and these six genes expression profile, we found similar histological types were not obviously clustered together. Using ANOVA, there was no statistically significance which suggested us that there is no relationship between histological type and expression pattern. When we picked out the intestinal and diffuse type GC cell lines, we found that the expressions of NES, FAM127A and SAMRCD3 in the diffuse type were higher than those in the intestinal type. However, there was only one intestinal type cell line which may result in bias.
Most other studies on gene signatures of human cancers are involved in how DEGs interact with significant biological processes or pathways, and few studies are focused on assessing patient prognosis and OS. Hence, we aimed to establish a multi-gene model to fill this gap. In this study, we showed, for the first time, a six-gene signature with a robust likelihood-based survival model for prognostic prediction of patients with GC. We further established a prognostic risk scoring system by the Cox proportional hazard regression. However, there are several limitations in our present study. First, our six-gene signature should be further verified in other independent cohorts including the TCGA database or clinical samples. Second, future research must investigate the prognostic value of our model for specific clinicopathologic features of GC patients, such as TNM stage, disease free survival (DFS) and relapse free survival (RFS).
In summary, we have established a six-gene signature that can be considered as a prognostic predictor of patients with GC. This study provides new insights and novel biomarkers for GC prognosis, and may help to discover novel therapeutic targets in clinical applications.
MATERIALS AND METHODS
Microarray data source and generation
Three independent gene expression microarray datasets (GSE62254, GSE15459 and GSE26253) were downloaded from the GEO database (http://www.ncbi.nlm.nih.gov/geo/). The GSE62254 series contained microarray profiles of 300 tumors from GC patients with detailed clinicopathologic and survival information based on the GPL570 platform (Affymetrix Human Genome U133 Plus 2.0 Array), contributed by Cristescu R. et al [6]. The GSE15459 series contained data from 192 GC patients based on the same platform, contributed by Ooi C. et al [39]. The GSE26253 series contained data from 432 GC patients based on the Illumina HumanRef-8 WG-DASL v3.0 platform, contributed by Lee J. et al [40]. GSE62254 was used as a training set for gene signature establishment, GSE15459 and GSE26253 was both used as validation sets to test the reliability of the model. Briefly, the probe symbols were first converted into the corresponding gene symbols based on the annotation platform. When one gene corresponded to multiple probes, the average expression level of the gene was considered to be its initial value. Finally, the limma package [41] in the R language environment was used to normalize gene expression intensities.
Establishment of the six-gene signature
In order to select survival-associated genes, a robust likelihood-based survival model was used which utilized the partial likelihood of the Cox model to select significant survival-associated genes by the rbsurv package in the R language environment [42]. In brief, GC patients were divided into the training set with 300*(1-1/4) samples and the validation set with 300*1/4 samples. Each gene was evaluated by being individually fit into the training set, obtaining the parameter estimate, and evaluating the log likelihood with the parameter estimate and the validation set. The above procedure was repeated 10 times and the best gene with the largest mean log likelihood was chosen. The next best gene was investigated by repeating the previous two steps and selecting an optimal two-gene model. When the forward selection steps developed a series of gene models, Akaike information criterions (AICs) were computed, and the optimal model with the smallest AICs was selected.
Integrated analyses of the six-gene signature
Hierarchical clustering analysis was used to observe the expression of six genes and sample correlation by the pheatmap package in the R language, with the “correlation” parameter in the row cluster and the “euclidean” parameter in the column cluster. A kaplan-Meier curve was used to observe the different survival outcomes of the two groups divided using the above heatmap by the survival package (p-value was computed from log-rank test). Gene expression profiling data from a total of 375 tumor samples and 32 adjacent normal sampleswas downloaded from the TCGA database to explore whether these six genes were differentially expressed in GC. A violin plot of the expression patterns for the six genes was drawn with the ggplot2 package in the R environment. The Human Protein Atlas database (http://www.proteinatlas.org/) was used to generate images of the six protein expression profiles using immunohistochemistry. The STRING database [43] (http://string-db.org/) was used to indicate interactions of the six with others proteins. The software Cytoscape (version 3.4.0) was used to visualize protein-protein interaction networks.
Establishment of a prognostic risk scoring system
To generate a risk scoring system for the six genes, Cox proportional hazard regressions were performed to obtain the regression coefficient of each gene using the survival package in the R language. The risk score was the sum of the products of the log2-transformed expression level of each gene and its corresponding coefficient, as follows: risk score = (0.199) * FAM127A + (0.709) * SMARCD3 + (-1.381)* TPMT + (-0.153)* HEYL + (1.930)* NES + (0.656)* RBPMS2. The area under the time-dependent receiver operating characteristic (ROC) curve (AUC) was determined to predict the 5-years survival by the survivalROC package in the R language to evaluate the specificity and sensitivity of the six-gene signature. GC patients were split into high- and low-risk groups by optimal cut-off value based on the ROC curve, and the Kaplan-Meier curve was used to observe survival outcomes of the two groups.
Data validation of the six-gene signature
A nomogram was used to visualize the Cox proportional hazard regression using the rms package in the R language. The nomogram was used to predict the 3- and 5-year OS using results from the expression levels of all six genes. The concordance index (C-index) and a calibration curve were also used to determine the discrimination and prediction of our signature. GSE15459, GSE26253 and TCGA data was analyzed as validation sets. The procedures of external data validation were done as described above.
Statistical analyses
Statistical analyses were performed using SPSS software version 23.0 (SPSS Inc., Chicago, IL, USA). The Mann–Whitney U test was performed to compare the differentially expressed genes between GC and normal tissues in the TCGA database. The ANOVA analysis was used to compare six genes expression pattern in three different grades of GC cell lines in R language. The log-rank test was applied for statistical comparison of the Kaplan-Meier curve. Univariate and multivariate Cox proportional hazard regression analyses were performed to explore the independent prognostic factors associated with OS. The Chi-square test was used to explore correlations between the six-gene signature and the clinicopathologic characteristics. A two-tailed p-value of less than 0.05 was considered to be statistically significant.
Abbreviations
GC: gastric cancer; GEO: Gene Expression Omnibus; TCGA: The Cancer Genome Atlas; ACRG: Asian Cancer Research Group; OS: overall survival; AICs: Akaike information criterions; PPI: protein-protein interaction; UBC: ubiquitin C; Ubls: ubiquitin-like proteins; ROC: receiver operating characteristic; AUC: area under the time-dependent ROC curve; C-index: concordance index; CI: confidence interval; DEGs: differentially expressed genes; CRC: colorectal cancer; SVM: support vector machine; FAM127A: family with sequence similarity 127, member A; RBPMS2: RNA binding protein with multiple splicing 2; SMARCD3: SWI/SNF related, matrix associated, actin dependent regulator of chromatin, subfamily d, member 3; HEYL: hes-related family bHLH transcription factor with YRPW motif-like; NES: nestin; TPMT: thiopurine S-methyltransferase; DFS: disease free survival; RFS: relapse free survival; HR: hazard ratio.
Author contributions
JW and PG designed this study. JXS participated in the conception of the idea. JXS and ZHW contributed to the literature search. JW and XZ analyzed the data. JW, PG and YXS wrote the initial draft of the manuscript. YXS and ZNW designed and supervised the study, developed the concept and edited the paper. All the authors have approved the final version.
ACKNOWLEDGMENTS
We gratefully thank Mr. Rangfei Zhu for help and assistance in the generation of experimental idea. We thank the department of Surgical Oncology of The First Hospital of China Medical University for technical assistance.
CONFLICTS OF INTEREST
The authors declare that they have no conflicts of interest.
FUNDING
This work was supported by National Science Foundation of China (81372549), the Key Laboratory Programme of Education Department of Liaoning Province (LZ2015076) and Scientific Programme of Science & Technology Department of Liaoning Province (2015225002).
REFERENCES
1. Torre LA, Bray F, Siegel RL, Ferlay J, Lortet-Tieulent J, Jemal A. Global cancer statistics, 2012. CA Cancer J Clin. 2015; 65:87–108.
2. Chen W, Zheng R, Baade PD, Zhang S, Zeng H, Bray F, Jemal A, Yu XQ, He J. Cancer statistics in China, 2015. CA Cancer J Clin. 2016; 66:115–132.
3. Cancer Genome Atlas Research Network. Comprehensive molecular characterization of gastric adenocarcinoma. Nature. 2014; 513:202–209.
4. Strand MS, Lockhart AC, Fields RC. Genetics of gastric cancer. Surg Clin North Am. 2017; 97:345–370.
5. Cho JY, Lim JY, Cheong JH, Park YY, Yoon SL, Kim SM, Kim SB, Kim H, Hong SW, Park YN, Noh SH, Park ES, Chu IS, et al. Gene expression signature-based prognostic risk score in gastric cancer. Clin Cancer Res. 2011; 17:1850–1857.
6. Cristescu R, Lee J, Nebozhyn M, Kim KM, Ting JC, Wong SS, Liu J, Yue YG, Wang J, Yu K, Ye XS, Do IG, Liu S, et al. Molecular analysis of gastric cancer identifies subtypes associated with distinct clinical outcomes. Nat Med. 2015; 21:449–456.
7. Marques-Lespier JM, Gonzalez-Pons M, Cruz-Correa M. Current perspectives on gastric cancer. Gastroenterol Clin North Am. 2016; 45:413–428.
8. Jia X, Yu H, Zhang H, Si Y, Tian D, Zhao X, Luan J, Jia H. Integrated analysis of different microarray studies to identify candidate genes in type 1 diabetes. J Diabetes. 2017; 9:149–157.
9. Zhang X, Yuan Z, Cui S. Identifying candidate genes involved in osteoarthritis through bioinformatics analysis. Clin Exp Rheumatol. 2016; 34:282–290.
10. Liang B, Li C, Zhao J. Identification of key pathways and genes in colorectal cancer using bioinformatics analysis. Med Oncol. 2016; 33:111.
11. Jin B, Wang W, Du G, Huang GZ, Han LT, Tang ZY, Fan DG, Li J, Zhang SZ. Identifying hub genes and dysregulated pathways in hepatocellular carcinoma. Eur Rev Med Pharmacol Sci. 2015; 19:592–601.
12. Chen H, Sun X, Ge W, Qian Y, Bai R, Zheng S. A seven-gene signature predicts overall survival of patients with colorectal cancer. Oncotarget. 2017; 8:95054–95065. https://doi.org/10.18632/oncotarget.10982.
13. Liu D. Gene signatures of estrogen and progesterone receptor pathways predict the prognosis of colorectal cancer. FEBS J. 2016; 283:3115–3133.
14. Dai J, Lu Y, Wang J, Yang L, Han Y, Wang Y, Yan D, Ruan Q, Wang S. A four-gene signature predicts survival in clear-cell renal-cell carcinoma. Oncotarget. 2016; 7:82712–82726. https://doi.org/10.18632/oncotarget.12631.
15. Wang P, Wang Y, Hang B, Zou X, Mao JH. A novel gene expression-based prognostic scoring system to predict survival in gastric cancer. Oncotarget. 2016; 7:55343–55351. https://doi.org/10.18632/oncotarget.10533.
16. Hou JY, Wang YG, Ma SJ, Yang BY, Li QP. Identification of a prognostic 5-Gene expression signature for gastric cancer. J Cancer Res Clin Oncol. 2017; 143:619–629.
17. Zhao X, Cai H, Wang X, Ma L. Discovery of signature genes in gastric cancer associated with prognosis. Neoplasma. 2016; 63:239–245.
18. Zhang B, Kirov S, Snoddy J. WebGestalt: an integrated system for exploring gene sets in various biological contexts. Nucleic Acids Res. 2005; 33:W741–W748.
19. Kim JM, Sohn HY, Yoon SY, Oh JH, Yang JO, Kim JH, Song KS, Rho SM, Yoo HS, Kim YS, Kim JG, Kim NS. Identification of gastric cancer-related genes using a cDNA microarray containing novel expressed sequence tags expressed in gastric cancer cells. Clin Cancer Res. 2005; 11:473–482.
20. Parker BS, Argani P, Cook BP, Liangfeng H, Chartrand SD, Zhang M, Saha S, Bardelli A, Jiang Y, St Martin TB, Nacht M, Teicher BA, Klinger KW, et al. Alterations in vascular gene expression in invasive breast carcinoma. Cancer Res. 2004; 64:7857–7866.
21. St Croix B, Rago C, Velculescu V, Traverso G, Romans KE, Montgomery E, Lal A, Riggins GJ, Lengauer C, Vogelstein B, Kinzler KW. Genes expressed in human tumor endothelium. Science. 2000; 289:1197–1202.
22. Han L, Diehl A, Nguyen NK, Korangath P, Teo W, Cho S, Kominsky S, Huso DL, Feigenbaum L, Rein A, Argani P, Landberg G, Gessler M, et al. The Notch pathway inhibits TGFbeta signaling in breast cancer through HEYL-mediated crosstalk. Cancer Res. 2014; 74:6509–6518.
23. Hapkova I, Skarda J, Rouleau C, Thys A, Notarnicola C, Janikova M, Bernex F, Rypka M, Vanderwinden JM, Faure S, Vesely J, de Santa Barbara P. High expression of the RNA-binding protein RBPMS2 in gastrointestinal stromal tumors. Exp Mol Pathol. 2013; 94:314–321.
24. Li J, Wang J, Chen Y, Yang L, Chen S. A prognostic 4-gene expression signature for squamous cell lung carcinoma. J Cell Physiol. 2017; 232:3702–3713.
25. Shukla S, Evans JR, Malik R, Feng FY, Dhanasekaran SM, Cao X, Chen G, Beer DG, Jiang H, Chinnaiyan AM. Development of a RNA-seq based prognostic signature in lung adenocarcinoma. J Natl Cancer Inst. 2017.
26. Xu G, Zhang M, Zhu H, Xu J. A 15-gene signature for prediction of colon cancer recurrence and prognosis based on SVM. Gene. 2017; 604:33–40.
27. Wang Z, Chen G, Wang Q, Lu W, Xu M. Identification and validation of a prognostic 9-genes expression signature for gastric cancer. Oncotarget. 2017; 8:73826–73836. https://doi.org/10.18632/oncotarget.17764.
28. Wang Z, Yan Z, Zhang B, Rao Z, Zhang Y, Liu J, Yu L, Zhao Y, Yang B, Wu T, Gao J. Identification of a 5-gene signature for clinical and prognostic prediction in gastric cancer patients upon microarray data. Med Oncol. 2013; 30:678.
29. Shen J, Wei J, Wang H, Yue G, Yu L, Yang Y, Xie L, Zou Z, Qian X, Ding Y, Guan W, Liu B. A three-gene signature as potential predictive biomarker for irinotecan sensitivity in gastric cancer. J Transl Med. 2013; 11:73.
30. Notarnicola C, Rouleau C, Le Guen L, Virsolvy A, Richard S, Faure S, De Santa Barbara P. The RNA-binding protein RBPMS2 regulates development of gastrointestinal smooth muscle. Gastroenterology. 2012; 143:687–697.
31. Penney KL, Sinnott JA, Tyekucheva S, Gerke T, Shui IM, Kraft P, Sesso HD, Freedman ML, Loda M, Mucci LA, Stampfer MJ. Association of prostate cancer risk variants with gene expression in normal and tumor tissue. Cancer Epidemiol Biomarkers Prev. 2015; 24:255–260.
32. Jordan NV, Prat A, Abell AN, Zawistowski JS, Sciaky N, Karginova OA, Zhou B, Golitz BT, Perou CM, Johnson GL. SWI/SNF chromatin-remodeling factor Smarcd3/Baf60c controls epithelial-mesenchymal transition by inducing Wnt5a signaling. Mol Cell Biol. 2013; 33:3011–3025.
33. Bosse T, ter Haar NT, Seeber LM, v Diest PJ, Hes FJ, Vasen HF, Nout RA, Creutzberg CL, Morreau H, Smit VT. Loss of ARID1A expression and its relationship with PI3K-Akt pathway alterations, TP53 and microsatellite instability in endometrial cancer. Mod Pathol. 2013; 26:1525–1535.
34. Maier MM, Gessler M. Comparative analysis of the human and mouse Hey1 promoter: hey genes are new Notch target genes. Biochem Biophys Res Commun. 2000; 275:652–660.
35. Krupkova O Jr, Loja T, Zambo I, Veselska R. Nestin expression in human tumors and tumor cell lines. Neoplasma. 2010; 57:291–298.
36. Krynetski E, Evans WE. Drug methylation in cancer therapy: lessons from the TPMT polymorphism. Oncogene. 2003; 22:7403–7413.
37. Hoeller D, Hecker CM, Dikic I. Ubiquitin and ubiquitin-like proteins in cancer pathogenesis. Nat Rev Cancer. 2006; 6:776–788.
38. Tang Y, Geng Y, Luo J, Shen W, Zhu W, Meng C, Li M, Zhou X, Zhang S, Cao J. Downregulation of ubiquitin inhibits the proliferation and radioresistance of non-small cell lung cancer cells in vitro and in vivo. Sci Rep. 2015; 5:9476.
39. Ooi CH, Ivanova T, Wu J, Lee M, Tan IB, Tao J, Ward L, Koo JH, Gopalakrishnan V, Zhu Y, Cheng LL, Lee J, Rha SY, et al. Oncogenic pathway combinations predict clinical prognosis in gastric cancer. PLoS Genet. 2009; 5:e1000676.
40. Lee J, Sohn I, Do IG, Kim KM, Park SH, Park JO, Park YS, Lim HY, Sohn TS, Bae JM, Choi MG, Lim DH, Min BH, et al. Nanostring-based multigene assay to predict recurrence for gastric cancer patients after surgery. PLoS One. 2014; 9:e90133.
41. Ritchie ME, Phipson B, Wu D, Hu Y, Law CW, Shi W, Smyth GK. limma powers differential expression analyses for RNA-sequencing and microarray studies. Nucleic Acids Res. 2015; 43:e47.
42. Cho H, Yu A, Kim S, Kang J, Hong S. Robust likelihood-based survival modeling with microarray data. J Stat Softw. 2009; 29:1–6.
43. Szklarczyk D, Franceschini A, Wyder S, Forslund K, Heller D, Huerta-Cepas J, Simonovic M, Roth A, Santos A, Tsafou KP, Kuhn M, Bork P, Jensen LJ, et al. STRING v10: protein-protein interaction networks, integrated over the tree of life. Nucleic Acids Res. 2015; 43:D447–D452.