
INTRODUCTION
Schizophrenia (SC) is a mental disorder characterized by abnormal social behavior and failure to understand reality. Common symptoms include false beliefs, unclear or confused thinking, hearing voices that others do not hear, reduced social engagement and emotional expression, and a lack of motivation [1]. The Positive and Negative Syndrome Scale (PANSS), a widely used clinical assessment for severity of SC symptoms, classified the typical symptoms of SC into three dimensions: positive, negative, and general syndromes [2].
With the rapid development of brain image techniques, the relationship between brain metabolites and clinical manifestation of schizophrenia has become a popular perspective to explore the mechanism of SC. Magnetic resonance spectroscopy (MRS), a technique that exploits the magnetic properties of certain atomic nuclei [3], can reflect the concentration of brain metabolites, and thus reveal the activation and number of neuron cells in brain cortex [4].
The metabolites selected by the researchers have two important characteristics in common: they mark the number or the function of neuron cells [5, 6] and they are easily detected by the MRS device [7]. For instance, N-acetylaspartate (NAA), synthesized in neuronal mitochondria from acetyl-coenzyme A and aspartate by the enzyme NAA transferase, has been considered to be a marker of neuronal integrity and an indicator for the number of viable neurons [8–10]. Also, glutamate is the agonist of N-methyl-D-aspartate (NMDA) receptors, which play an important role in excitatory neurotransmission, plasticity, and excitotoxicity. The activation of NMDA receptors is considered to be correlated with the positive and negative syndromes of SC [11–15]. Choline (Cho), generated from the cell membrane phospholipids, which reflects the density of neuron cells, and myo-inositol (MI), considered to be the agonist for Ca2+release in mitochondria and endoplasmic reticulum, which reveals the function of neuron cells and astrocytes, both interest the scientists [16–19].
Dorsolateral prefrontal cortex (DLPFC) was considered to be associated with cognitive function [20, 21]. It has been indicated that the regional cerebral blood flow in DLPFC may help to distinguish patients with SC and normal subjects when they are involved in the same cognition task (no matter what the task is). Also, the better the DLPFC is able to function, the better the cognition performance recorded by the patients with SC [22–24]. Based on the physiological and neuroimaging findings on DLPFC in patients with SC, it is meaningful to detect the neuron-metabolite level in DLPFC to understand the mechanism of SC.
The number of researches using MRS to explore the pathophysiology of SC has grown rapidly in recent years. Most studies have reported a decreased metabolite level in DLPFC among patients with SC, comparing to the healthy controls [25]. Depletion of metabolite of NAA [26], Glx [27], Cho [16] or MI [19] in DLPFC of patients with SC has been widely studied by researchers, which are thought to reflect the dysfunction of schizophrenia-related neuron cells [28]. However, few studies have explored whether the change in certain metabolite is correlated with the process of disease or its medical treatment. As a matter of fact, it is necessary to perform long-term longitudinal studies to explore the problem.
Longitudinal studies carried out before majorly focused on the alteration of metabolite level after a period of time or were for the purpose of pharmacology [29, 30]. However, few studies had discussed the correlation between the metabolite level and the severity of clinical symptoms of SC. The results given out by previous studies about the correlation between the metabolite level and the PANSS score were unstable: Tanaka et al [31] reported that there was significant negative correlation between the NAA level in DLPFC and PANSS-N scores while Sigmundsson et al. [32] reported a positive correlation between the NAA level in right frontal lobe and PANSS-P scores, however, other researchers did not observe significant correlation [33, 34]. Meanwhile, most previous longitudinal studies were carried out within no longer than 3 months [6, 8, 33, 35], the change of metabolite level in a longer treatment period remained unexplored. Moreover, few studies were carried out to explore the change of metabolite level after the treatment of SC in mainland China.
The aim of the study was to investigate the correlation between the alterations in dorsolateral prefrontal cortex (DLPFC) metabolite levels of Chinese patients with first-episode schizophrenia (FES) and the change in clinical symptoms after one year treatment to explore the pathophysiology of SC.
MATERIALS AND METHODS
Subjects
A total of 33 patients were recruited from the First Affiliated Hospital of Medical School of Zhejiang University, while 33 healthy people were recruited from communities or through advertisements. Routine laboratory tests and physical and neurological examinations were administered to each participant. One patient decided to quit the study right before the MRS scanned, two patients as well as three healthy people failed to finish the MRS scan at the baseline. One patient lost contact during the one-year follow up and four patients refused to have a MRS scan again. Therefore, the statistics of 25 patients with FES and 30 healthy people were included in the final statistical analysis (Figure 1).
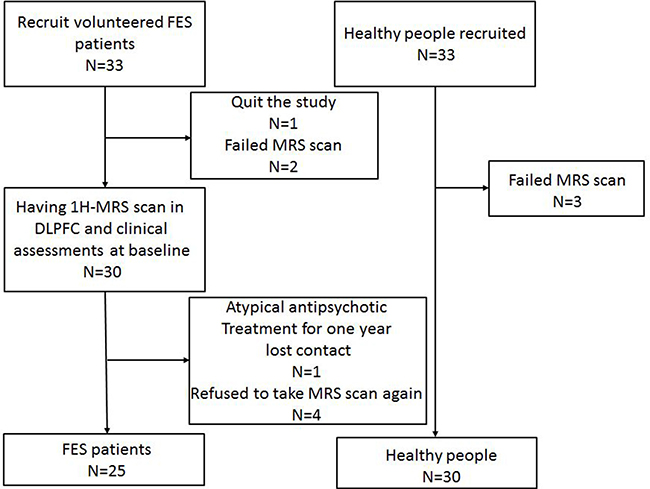
Figure 1: CONSORT flow chart.
The inclusion criteria were as follows: (1) met the diagnostic criteria for schizophrenia in the International Statistical Classification of Diseases and Related Health Problems, 10th revision [International Classification of Diseases (ICD)-10 F20; ICD-10 diagnosis in all studies verified by the mini-International Neuropsychiatric Interview (MINI)] (World Health Organization, 1992); (2) first episode; (3)being antipsychotic drug-naïve; (4) ethnicity of Han origin; and (5) right-handed. The exclusion criteria for both patients and healthy people were as follows: (1)with a primary active ICD-10 diagnosis other than schizophrenia at screening or an ICD-10 diagnosis of active substance dependence within 3 months before screening (except nicotine and caffeine); (2) with a diagnosis of past psychiatric or central nervous system disorders; (3) any contraindications to MRS scanning(e.g., claustrophobia or metallic implants); (4) with a diagnosis of serious disease of the heart, liver, kidney, internal secretion, blood system or any other disease that might disturb the outcome of the study; (5) with a diagnosis of organic mental disorders or mental retardation; and (6) pregnancy.
The study was approved by the ethics committee of the First Affiliated Hospital of Medical School of Zhejiang University. All subjects provided written informed consent before participating in the study. The trial was conducted in accordance with the ethical principles included in the Declaration of Helsinki consistent with Good Clinical Practices and applicable regulatory requirements. All subjects were informed that they could quit the study at any time with an additional examination and further therapy support. The clinical trial number of the study is ChiCTR-COC-14005302.
Study design
This was a one-year longitudinal research to investigate the correlation between the alterations in dorsolateral prefrontal cortex (DLPFC) metabolite level of patients with drug-naïve first-episode schizophrenia (FES) and the change in clinical symptoms.
The first patient was included to the study in January 2014, and the last patient was included in November 2014. The healthy controls were recruited during the period. The patients were followed for at least one year when they were taking atypical antipsychotic therapies. The study was totally finished in December 2015.
All patients fulfilled their demographic data, and both groups underwent an 1H-MRS scan in DLPFC at the baseline. The initial clinical characteristics of the FES patients were recorded with PANSS. All patients received antipsychotic drugs for one year, including risperidone, paliperidone, quetiapine, and olanzapine, and were reevaluated at week 1, 2, 3, 4, 8, 12, 24, 36, and 48 with PANSS during the year. After 1-year treatment, 1H-MRS of the patients was reevaluated and recorded.
Clinical assessments and MRS acquisition
Clinical assessments
PANSS was used to evaluate the clinical characteristics of the subjects in the schizophrenia group. The PANSS is a 30-item medical scale including 7 positive symptoms (delusions, conceptual disorganization, hallucinations, hyperactivity, grandiosity, suspiciousness/persecution, and hostility), 7 negative symptoms (blunted affect, emotional withdrawal, poor rapport, passive/apathetic social withdrawal, difficulty in abstract thinking, lack of spontaneity and flow of conversation, and stereotyped thinking), and 16 general psychopathology items (somatic concern, anxiety, guilt feelings, tension, mannerisms and posturing, depression, motor retardation, uncooperativeness, unusual thought content, disorientation, poor attention, lack of judgment and insight, disturbance of volition, poor impulse control, preoccupation, and active social avoidance). It is used to assess the degree of psychopathology on a number of symptomatic domains. Each item is rated from 1 (no evidence) to 7 (extreme) based on objective criteria. The reliability of PANSS scale in chinese version is 0.8707 and the vadility is above 0.7434 [36].
MRS acquisition
All MRI and MRS examinations were performed on a 3.0-Tesla MR scanner (Achieva 3.0T; Philips Medical Systems, Netherlands). Routine maintenance was performed to the scanner every few month, and patients were scanned on the same scanner after a year. Water model experiments were performed every two months, the signal-noise ratios of water model were all above 200, which assured the reliability of the scanner. The system was tested for data stability prior to use. A standard coil was used to emit and receive magnetic resonance imaging signals. Head movement was reduced using foam pads, and earplugs were used to reduce noise stimulation. The subjects were instructed to relax, keep their eyes closed, stay awake, remain still, and not think of anything in particular. The subjects’ compliance was confirmed after the scanning was completed. Spectroscopy data were acquired from a single voxel using chemical shift selective saturation (for water suppression) stimulated echo pulse with the following acquisition parameters: echo time = 9.2 ms; repetition time = 2000 ms; mixing time = 16ms; volume of interest(VOI) = 15 × 15 × 15 mm3; number of signal average = 128; and sample = 1024. The volume of interest (VOI) was prescribed to include mostly grey matter in the left and right dorsallateral prefrontal cortex using coronal, sagittal and transverse image as shown in Figure 1. A three-plane localizer MRI was first acquired to define the spatial position of the brain. Three-plane oblique localizer MRI was then acquired: an axial/oblique MRI series parallel to the Sylvian fissure, a coronal/oblique localizer MRI series perpendicular to the previous axial/oblique planes, and sagittal/oblique MRI series. To ensure correct slice prescription, the anterior commissure was located on a coronal/oblique image, and the sagittal/oblique slices were oriented parallel to the brain surface at the middle frontal gyrus, forming a 45º angle (approximately) with the interhemispheric fissure (Figure 2).
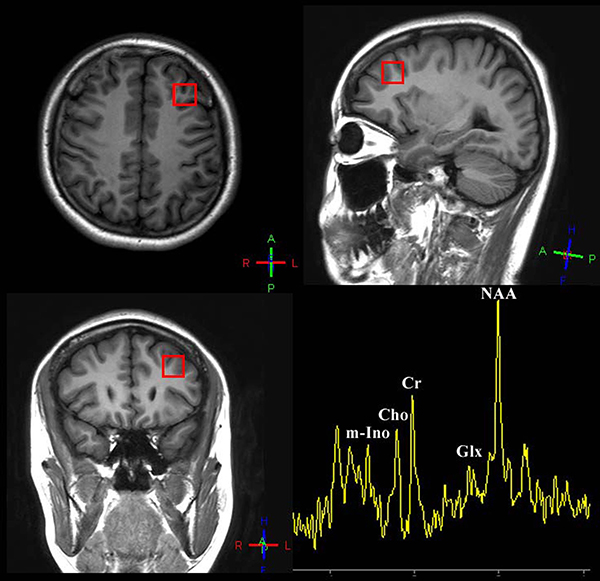
Figure 2: Voxel placement of interest: dorsolateral prefrontal cortex and a sample of quantifying 1H-spectrum acquired from DLPFC of patients/healthy people.
The standard spectroscopic phantom was used to determine reliability before spectrum scanning. The line width was less than 4 Hz and water suppression level was at least 99% in the pre-scan for patients. The data post-processing (including signal-to-noise ratio assessment and baseline adjustment) and quantification steps were automated performed by the Spectrum View. The quantitative data of NAA and Glx (major metabolites), choline-containing compounds, and MI (minor metabolites) were calculated using the Spectrum View.
Statistical analysis
All analyses were performed using the statistical package SPSS version 17.0 (SPSS, IL, USA). Differences in demographical characteristics and the index of 1H-MRS at the baseline between control and patient groups were determined using the independent t-test or χ2 test. The paired t-test (two-tailed) was used to evaluate significant changes in the index of 1H-MRS, neuropsychological assessment results, and clinical symptoms before and after an atypical antipsychotic treatment. Partial correlation analysis was used to calculate the correlations between the metabolite alteration and pathological characteristics or cognition condition (set baseline metabolite concentration as the unconcerned confounding factor). The level of significance was set at α = 0.05.
RESULTS
Demographic data and clinical symptoms
As shown in Table 1, no significant difference was found in all the domains of demographic statistics including age, gender, nationality, and education years between patients with schizophrenia and the healthy subjects.
Table 1: Demographic and clinical characteristics of schizophrenia group and control group at the baseline and 1 year later
Measure |
Schizophrenia (N = 25) |
Control (N = 30) |
t/χ2 |
p |
|
|---|---|---|---|---|---|
Baseline |
1 year |
||||
Age, mean ± SD (year) |
19.92 ± 4.65 |
19.23 ± 4.41 |
0.568a |
0.573 |
|
Gender (male/female) |
12/13 |
16/14 |
0.155b |
0.694 |
|
Nationality, Han/other (n) |
25/0 |
30/0 |
|||
Education years |
11.40 ± 3.08 |
11.65 ± 3.51 |
–1.422 a |
0.164 |
|
Course of illness (mo) |
12.28 ± 13.54 |
||||
Age at first onset (year) |
18.12 ± 4.47 |
||||
PANSS total scores |
80.83 ± 15.64 |
50.50 ± 18.39 |
6.154 |
< 0.001*** |
|
PANSS-P scores |
19.87 ± 7.45 |
12.33 ± 5.19 |
4.067a |
< 0.001*** |
|
PANSS-N scores |
37.25 ± 11.34 |
14.79 ± 6.76 |
4.310a |
< 0.001*** |
|
PANSS-G scores |
24.67 ± 9.21 |
23.54 ± 10.87 |
0.387a |
0.701 |
|
at test; bχ2 test;*P <0.05; **P <0.01; ***P <0.001.
The clinical symptoms, which were measured using PANSS, were significantly improved after 1-year treatment. The line chart of the PANSS score recorded at every time point is shown in Figure 3. The PANSS total score and the subscales of PANSS-P score and PANSS-N score all showed a significant reduction after one year treatment However, there was no significant difference in the PANSS-G score after the treatment compared with the baseline (Table 1).
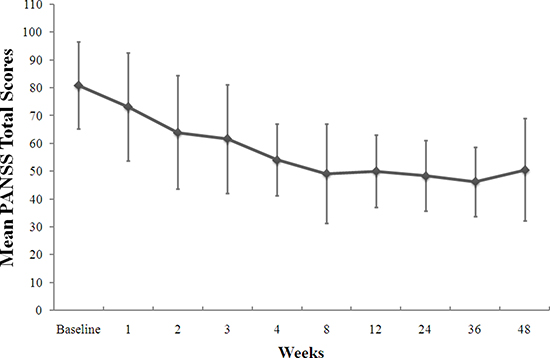
Figure 3: Change from the baseline in PANSS total scores during the 1-year treatment.
MRS data
Table 2 showed that at the baseline, a lower ratio of NAA/Cr was observed in the left DLPFC of the FES group compared with the healthy group (t(24) = –2.222; P = 0.031). The same result was also obtained for the Cho/Cr level in the left (t(24) = –3.363, P = 0.001) and the right lobe (t(24) = –2.762, P = 0.008). Other metabolite levels showed no significant changes.
Table 2: 1H-MRS statistics of schizophrenia group and control group at the baseline and 1 year later
Measure |
Baseline |
1 year |
Control |
ta |
P |
tb |
P |
tc |
P |
|---|---|---|---|---|---|---|---|---|---|
Left NAA/Cr |
1.89 ± 0.42 |
2.15 ± 0.69 |
2.34 ± 0.93 |
–2.222 |
0.031* |
-0.887 |
0.379 |
–1.572 |
0.122 |
Left Ml/Cr |
0.92 ± 1.18 |
0.87 ± 0.39 |
0.75 ± 0.50 |
0.409 |
0.520 |
0.966 |
0.339 |
0.199 |
0.844 |
Left Glx/Cr |
1.84 ± 1.15 |
1.72 ± 0.93 |
1.43 ± 0.56 |
1.630 |
0.113 |
1.370 |
0.179 |
0.405 |
0.688 |
Left Cho/cr |
0.83 ± 0.26 |
0.88 ± 0.27 |
1.19 ± 0.48 |
–3.363 |
0.001* |
–2.836 |
0.006* |
-0.712 |
0.480 |
Right NAA/Cr |
1.91 ± 0.72 |
1.62 ± 0.45 |
2.16 ± 0.58 |
–1.351 |
0.183 |
–3.817 |
< 0.001 |
1.677 |
0.101 |
Right Ml/Cr |
2.05 ± 2.14 |
0.83 ± 0.46 |
1.88 ± 2.11 |
0.297 |
0.768 |
–2.425 |
0.019* |
2.766 |
0.008* |
Right Glx/Cr |
1.55 ± 0.74 |
2.24 ± 2.13 |
1.38 ± 0.87 |
0.787 |
0.435 |
1.897 |
0.067 |
–1.532 |
0.136 |
Right Cho/cr |
0.72 ± 0.24 |
0.72 ± 0.28 |
1.12 ± 0.67 |
–2.762 |
0.008* |
–2.731 |
0.009* |
0.032 |
0.975 |
*P < 0.05.
aComparison of baseline and control;
bcomparison of one year later and control.
cComparison of baseline and one year later;
Both ta and tb used independent-sample t test, tc used paired t test.
After a one-year treatment, the NAA/Cr level in the left DLPFC showed no significant difference compared with the control group (t(24) = 0.887, P = 0.379). However, the Cho/Cr on both sides did not change significantly compared with the control group after the treatment (left: t(24) = 2.836, P = 0.006; right: t(24) = 2.731, P = 0.009). Meanwhile, the NAA/Cr and MI/Cr levels in the right lobe were significantly lower compared with the control groups (NAA: t(24)=3.871, P < 0.001; MI: t(24) = 2.425, P = 0.019).
Compared with the baseline, the MI/Cr level in the right DLPFC of patients with FES showed a significant decrease (t(24) = 2.766, P = 0.008), while the levels of other metabolites showed no significant difference.
Correlation analysis
After the treatment, a significant negative correlation was observed between the alterations of the NAA/Cr levels in the left DLPFC and the PANSS-P reduction ratios (r = -0.407, P < 0.05) (Figure 4).
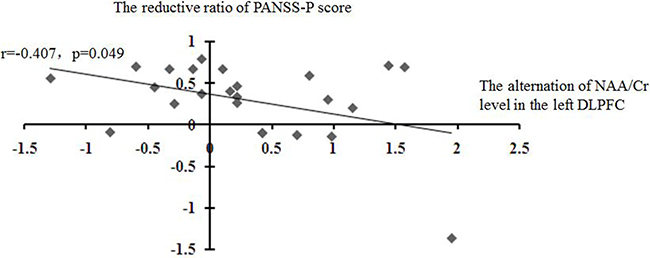
Figure 4: Correlations of the alteration of the NAA level in the left DLPFC with the reduction ratio of PANSS-P score.
Nonetheless, this study did not find any correlations between the change in the levels of other metabolites and PANSS score reduction or any other demographic statistics (Table 3).
Table 3: Correlation analysis between the alternation of MRS statics and the reductive ratio of PANSS scores
Measure |
Left NAA/Cr |
Left Ml/Cr |
Left Glx/Cr |
Left Cho/Cr |
Right NAA/Cr |
Right Ml/Cr |
Right Glx/Cr |
Right Cho/Cr |
|---|---|---|---|---|---|---|---|---|
PANS-T reductive ratio |
−0.285 |
0.089 |
0.072 |
0.097 |
−0.222 |
−0.029 |
−0.177 |
−0.040 |
p |
0.176 |
0.678 |
0.738 |
0.651 |
0.298 |
0.894 |
0.408 |
0.852 |
PANSS-P reductive ratio |
−0.407 |
−0.002 |
−0.151 |
0.093 |
−0.177 |
−0.145 |
0.090 |
0.027 |
p |
0.049* |
0.992 |
0.481 |
0.665 |
0.409 |
0.498 |
0.677 |
0.899 |
PANSS-N reductive ratio |
0.320 |
−0.068 |
0.118 |
−0.006 |
0.000 |
−0.146 |
−0.142 |
0.073 |
p |
0.127 |
0.751 |
0.581 |
0.978 |
1.000 |
0.496 |
0.507 |
0.735 |
PANSS-G reductive ratio |
−0.223 |
0.184 |
0.290 |
0.068 |
−0.239 |
0.328 |
−0.233 |
−0.066 |
p |
0.294 |
0.390 |
0.169 |
0.751 |
0.260 |
0.117 |
0.274 |
0.760 |
*P < 0.05.
DISCUSSION
In this study, the clinical symptoms of FES patients were significantly improved after a one-year treatment. Compared with the baseline, the NAA/Cr level of FES patients in the left DLPFC showed a tendency to rise while the NAA/Cr and MI/Cr level in the right DLPFC showed a tendency to fall. The Cho/Cr level of FES patients was lower than the healthy control, both at baseline and one year later.
At the baseline, the NAA/Cr levels in the left DLPFC of patients with drug-naïve FES was significantly lower compared with the control groups, which was consistent with many other researches and the meta-analysis conducted by Marsman et al and Brugger et al [25, 26, 28, 37]. The difference in the NAA/Cr levels disappeared after the treatment, implying that the NAA/Cr level might change synchronously with the healing process. Several previous studies have shown that the NAA/Cr level in the left DLPFC increased significantly or had a tendency to increase after the atypical antipsychotic medical treatment [29, 30, 38]. In agreement with these results, the present study also showed an increasing trend of the NAA/Cr level in the left DLPFC after one-year treatment. However, the patients were followed up for 1 year in the present study, which was much longer compared with any of the previous studies with similar results. It is believed that the reproducibility of NAA-related neuron cells could be activated with the recovery of schizophrenia using a chronic atypical antipsychotic therapy [39], no matter the treatment lasted for 4 weeks [29], 8 weeks [30], or a year, suggesting that the depletion of NAA might be a state characteristic. More importantly, a significant negative correlation was observed between the alterations of the NAA/Cr levels in the left DLPFC and the PANSS-P reduction ratios, indicating that the rise in NAA levels might be associated with the change in the positive symptoms. On the contrary, a lower NAA/Cr level was found in the right DLPFC compared with the healthy people, while no significant difference was noted at the baseline, which differed from the increasing tendency in the left lobe after the treatment. Although the concrete function of the two lobes has not been explored, it was demonstrated that the left and right lobes of DLPFC played different roles in cognitive or emotional process for both healthy people and patients with SC [40–42]. Moreover, in most previous studies, only the NAA/Cr level in the left lobe, rather than both, of the DLPFC increased significantly or showed a tendency to rise after the treatment [29, 38, 43].
Compared with the healthy people, the patients with FES had significantly lower Cho/Cr levels in both lobes, and the levels remained unchanged after the treatment. Some other researches also yielded similar results [8, 35]. This might be reason that the depletion of Cho reflected a cortical impairment caused by schizophrenia and it did not recover easily despite the therapy, suggesting that Cho could be the potential endophenotype of SC.
MI was thought to be a marker of astroglial activity [18]. Also, the dysfunction or loss of astrocytes was considered to obstruct the glutamate metabolism system [44] and was widely found in patients with schizophrenia [19, 45, 46]. MI is the only metabolite whose level significantly changed after the treatment. Nonetheless, the reduction of the MI/Cr level in the right DLPFC was more a sign of worsening than a sign of recovery. Considering no significant differences between the two groups at the baseline were found, the huge reduction in the MI/Cr level in patients could not be explained by the recovery. Rather, it might be due to the development of SC.
This study did not find any significant difference in the Glx/Cr level between patients with FES and healthy people, whether at baseline or after the treatment. Although some studies reported the same finding. [47, 48], the outcome of this study was different from the meta-analysis performed by Marsman et al. [28]. According to Marsman [28], the Glx level in the frontal region was significantly lower in patients than healthy people. This discrepancy might be due to the small sample size, heterogeneity of schizophrenia, different measurement methods, enrollment criteria, or individual specialties.
This study had certain limitations. First, with the difficulty to recruit and follow up the Chinese patients with drug-naïve FES for 1 year in clinical researches; the sample size might be too small to get proper statistics, which might unavoidably affect some outcomes of this study. Second, the patients with FES recruited in this study took a different kind of medicine for the treatment. The sample size was too small to carry out an analysis of the effect of a different medicine on the metabolite level. Third, Most healthy people refused to have MRI after 1 year, so their MRS data were not reevaluated, which might somehow influence the result of this study. Finally, because of the lack of a standard research fitting package such as Linear combination of Model in vitro spectra (LC model), the concentrations of metabolites could not be calculated. As a consequence, only the ratios of metabolites to Cr were chosen as the dependent variables. Although the results using a dependent variable such as concentration or ratio are reported to be the same in most studies and meta-analyses, using only the ratio for analysis might challenge the reliability of outcomes of the present study.
ACKNOWLEDGMENTS
First of all, we are grateful to all the patients and volunteers for their participation in the study. Secondly, we appreciate Professor Yi Shen of Zhejiang University for his suggestion in statistics. Thirdly, we are grateful to Professor Ze Wang of Hangzhou Normal University for his assistance and suggestion in MRI localization.
CONFLICTS OF INTEREST
All authors declare no conflicts of interest. All authors have approved the final manuscript.
FUNDING
This work was supported by National Key Research and Development Program of China (2016YFC1307005, 2016YFC1307104, 2016YFC1306900) and grants 2015BAI13B02 from the National Science and Technology Program, grants 2014RCA005 from the Department of Health Foundation of Zhejiang Province, and grants 2015C03040 and 2015C03054 from the key research project of the Zhejiang Province. The funding sources had no role in the study design; collection, analysis, and interpretation of data; writing of the manuscript; or decision to submit the paper for publication.
REFERENCES
1. WHO. Fact sheet on schizophrenia: key facts, symptoms, causes of schizophrenia, WHO response. 2014.
2. Kay SR, Fiszbein A, Opler LA. The positive and negative syndrome scale (PANSS) for schizophrenia. Schizophr Bull. 1987; 13:261–76.
3. Provencher SW. Estimation of metabolite concentrations from localized in vivo proton NMR spectra. Magn Reson Med. 1993; 30:672–9.
4. Steen RG, Hamer RM, Lieberman JA. Measurement of brain metabolites by 1H magnetic resonance spectroscopy in patients with schizophrenia: a systematic review and meta-analysis. Neuropsychopharmacology. 2005; 30:1949–62. https://doi.org/10.1038/sj.npp.1300850.
5. Lutkenhoff ES, van Erp TG, Thomas MA, Therman S, Manninen M, Huttunen MO, Kaprio J, Lonnqvist J, O’Neill J, Cannon TD. Proton MRS in twin pairs discordant for schizophrenia. Mol Psychiatry. 2010; 15:308–18. https://doi.org/10.1038/mp.2008.87.
6. Zong X, Hu M, Li Z, Cao H, He Y, Liao Y, Zhou J, Sang D, Zhao H, Tang J, Lv L, Chen X. N-acetylaspartate reduction in the medial prefrontal cortex following 8 weeks of risperidone treatment in first-episode drug-naive schizophrenia patients. Sci Rep. 2015; 5:9109. https://doi.org/10.1038/srep09109.
7. Luyten PR, den Hollander JA. Observation of metabolites in the human brain by MR spectroscopy. Radiology. 1986; 161:795–8. https://doi.org/10.1148/radiology.161.3.3786735.
8. Gan JL, Cheng ZX, Duan HF, Yang JM, Zhu XQ, Gao CY. Atypical antipsychotic drug treatment for 6 months restores N-acetylaspartate in left prefrontal cortex and left thalamus of first-episode patients with early onset schizophrenia: A magnetic resonance spectroscopy study. Psychiatry Res. 2014; 223:23–7. https://doi.org/10.1016/j.pscychresns.2014.04.010.
9. Klar AA, Ballmaier M, Leopold K, Hake I, Schaefer M, Bruhl R, Schubert F, Gallinat J. Interaction of hippocampal volume and N-acetylaspartate concentration deficits in schizophrenia: a combined MRI and 1H-MRS study. Neuroimage. 2010; 53:51–7. https://doi.org/10.1016/j.neuroimage.2010.06.006.
10. Reynolds LM, Reynolds GP. Differential regional N-acetylaspartate deficits in postmortem brain in schizophrenia, bipolar disorder and major depressive disorder. J Psychiatr Res. 2011; 45:54–9. https://doi.org/10.1016/j.jpsychires.2010.05.001.
11. Guo X, Zhang Z, Wei Q, Lv H, Wu R, Zhao J. The relationship between obesity and neurocognitive function in Chinese patients with schizophrenia. BMC Psychiatry. 2013; 13:109. https://doi.org/10.1186/1471-244X-13-109.
12. Krystal JH, Karper LP, Seibyl JP, Freeman GK, Delaney R, Bremner JD, Heninger GR, Bowers MB Jr, Charney DS. Subanesthetic effects of the noncompetitive NMDA antagonist, ketamine, in humans. Psychotomimetic, perceptual, cognitive, and neuroendocrine responses. Arch Gen Psychiatry. 1994; 51:199–214.
13. Moghaddam B, Adams B, Verma A, Daly D. Activation of glutamatergic neurotransmission by ketamine: a novel step in the pathway from NMDA receptor blockade to dopaminergic and cognitive disruptions associated with the prefrontal cortex. J Neurosci. 1997; 17:2921–7.
14. Mwansisya TE, Wang Z, Tao H, Zhang H, Hu A, Guo S, Liu Z. The diminished interhemispheric connectivity correlates with negative symptoms and cognitive impairment in first-episode schizophrenia. Schizophr Res. 2013; 150:144–50. https://doi.org/10.1016/j.schres.2013.07.018.
15. Olney JW, Farber NB. Glutamate receptor dysfunction and schizophrenia. Arch Gen Psychiatry. 1995; 52:998–1007.
16. Bird ED, Spokes EG, Barnes J, MacKay AV, Iversen LL, Shepherd M. Increased brain dopamine and reduced glutamic acid decarboxylase and choline acetyl transferase activity in schizophrenia and related psychoses. Lancet. 1977; 2:1157–8.
17. Karson CN, Casanova MF, Kleinman JE, Griffin WS. Choline acetyltransferase in schizophrenia. Am J Psychiatry. 1993; 150:454–9. https://doi.org/10.1176/ajp.150.3.454.
18. Malhi GS, Valenzuela M, Wen W, Sachdev P. Magnetic resonance spectroscopy and its applications in psychiatry. Aust N Z J Psychiatry. 2002; 36:31–43.
19. Rothermundt M, Ohrmann P, Abel S, Siegmund A, Pedersen A, Ponath G, Suslow T, Peters M, Kaestner F, Heindel W, Arolt V, Pfleiderer B. Glial cell activation in a subgroup of patients with schizophrenia indicated by increased S100B serum concentrations and elevated myo-inositol. Prog Neuropsychopharmacol Biol Psychiatry. 2007; 31:361–4. https://doi.org/10.1016/j.pnpbp.2006.09.013.
20. Hornak J, O’Doherty J, Bramham J, Rolls ET, Morris RG, Bullock PR, Polkey CE. Reward-related reversal learning after surgical excisions in orbito-frontal or dorsolateral prefrontal cortex in humans. J Cogn Neurosci. 2004; 16:463–78. https://doi.org/10.1162/089892904322926791.
21. MacDonald AW 3rd, Cohen JD, Stenger VA, Carter CS. Dissociating the role of the dorsolateral prefrontal and anterior cingulate cortex in cognitive control. Science. 2000; 288:1835–8.
22. Berman KF, Zec RF, Weinberger DR. Physiologic dysfunction of dorsolateral prefrontal cortex in schizophrenia. II. Role of neuroleptic treatment, attention, and mental effort. Arch Gen Psychiatry. 1986; 43:126–35.
23. Weinberger DR, Berman KF, Illowsky BP. Physiological dysfunction of dorsolateral prefrontal cortex in schizophrenia. III. A new cohort and evidence for a monoaminergic mechanism. Arch Gen Psychiatry. 1988; 45:609–15.
24. Weinberger DR, Berman KF, Zec RF. Physiologic dysfunction of dorsolateral prefrontal cortex in schizophrenia. I. Regional cerebral blood flow evidence. Arch Gen Psychiatry. 1986; 43:114–24.
25. Schwerk A, Alves FD, Pouwels PJ, van Amelsvoort T. Metabolic alterations associated with schizophrenia: a critical evaluation of proton magnetic resonance spectroscopy studies. J Neurochem. 2014; 128:1–87. https://doi.org/10.1111/jnc.12398.
26. Molina V, Sanchez J, Sanz J, Reig S, Benito C, Leal I, Sarrarnea F, Rebolledo R, Palomo T, Desco M. Dorsolateral prefrontal N-acetyl-aspartate concentration in male patients with chronic schizophrenia and with chronic bipolar disorder. European Psychiatry. 2007; 22:505–12. https://doi.org/10.1016/j.eurpsy.2007.07.006.
27. Natsubori T, Inoue H, Abe O, Takano Y, Iwashiro N, Aoki Y, Koike S, Yahata N, Katsura M, Gonoi W, Sasaki H, Takao H, Kasai K, et al. Reduced frontal glutamate + glutamine and N-acetylaspartate levels in patients with chronic schizophrenia but not in those at clinical high risk for psychosis or with first-episode schizophrenia. Schizophr Bull. 2014; 40:1128–39. https://doi.org/10.1093/schbul/sbt124.
28. Marsman A, van den Heuvel MP, Klomp DW, Kahn RS, Luijten PR, Hulshoff Pol HE. Glutamate in schizophrenia: a focused review and meta-analysis of (1)H-MRS studies. Schizophr Bull. 2013; 39:120–9. https://doi.org/10.1093/schbul/sbr069.
29. Bertolino A, Callicott JH, Mattay VS, Weidenhammer KM, Rakow R, Egan MF, Weinberger DR. The effect of treatment with antipsychotic drugs on brain N-acetylaspartate measures in patients with schizophrenia. Biol Psychiatry. 2001; 49:39–46. http://dx.doi.org/10.1016/S0006-3223(00)00997-5.
30. Ertugrul A, Volkan-Salanci B, Basar K, Karli Oguz K, Demir B, Ergun EL, Senturk S, Erbas B, Cila A, Ulug B. The effect of clozapine on regional cerebral blood flow and brain metabolite ratios in schizophrenia: relationship with treatment response. Psychiatry Res. 2009; 174:121–29. https://doi.org/10.1016/j.pscychresns.2009.04.007.
31. Tanaka Y, Obata T, Sassa T, Yoshitome E, Asai Y, Ikehira H, Suhara T, Okubo Y, Nishikawa T. Quantitative magnetic resonance spectroscopy of schizophrenia: Relationship between decreased N-acetylaspartate and frontal lobe dysfunction. Psychiatry and Clinical Neurosciences. 2006; 60:365–72. https://doi.org/10.1111/j.1440-1819.2006.01515.x.
32. Sigmundsson T, Maier M, Toone BK, Williams SC, Simmons A, Greenwood K, Ron MA. Frontal lobe N-acetylaspartate correlates with psychopathology in schizophrenia: a proton magnetic resonance spectroscopy study. Schizophr Res. 2003; 64:63–71.
33. Jarskog LF, Dong Z, Kangarlu A, Colibazzi T, Girgis RR, Kegeles LS, Barch DM, Buchanan RW, Csernansky JG, Goff DC, Harms MP, Javitt DC, Keefe RS, et al. Effects of davunetide on N-acetylaspartate and choline in dorsolateral prefrontal cortex in patients with schizophrenia. Neuropsychopharmacology. 2013; 38:1245–52. https://doi.org/10.1038/npp.2013.23.
34. Stone JM, Dietrich C, Edden R, Mehta MA, De Simoni S, Reed LJ, Krystal JH, Nutt D, Barker GJ. Ketamine effects on brain GABA and glutamate levels with 1H-MRS: relationship to ketamine-induced psychopathology. Mol Psychiatry. 2012; 17:664–5. https://doi.org/10.1038/mp.2011.171.
35. Bustillo JR, Rowland LM, Jung R, Brooks WM, Qualls C, Hammond R, Hart B, Lauriello J. Proton magnetic resonance spectroscopy during initial treatment with antipsychotic medication in schizophrenia. Neuropsychopharmacology. 2008; 33:2456–66. https://doi.org/10.1038/sj.npp.1301631.
36. Tianmei S, Jiangzhong Y, Liang S. The Reliability,Validity of PANSS and its Implication. Chin Ment Health J. 2004; 18:45–47.
37. Brugger S, Davis JM, Leucht S, Stone JM. Proton magnetic resonance spectroscopy and illness stage in schizophrenia--a systematic review and meta-analysis. Biol Psychiatry. 2011; 69:495–503. https://doi.org/10.1016/j.biopsych.2010.10.004.
38. Ertugrul A, Ulug B. The effect of clozapine on neuroimaging findings in schizophrenia. Psychiatr Danub. 2007; 19:367–69.
39. Bertolino A, Callicott JH, Nawroz S, Mattay VS, Duyn JH, Tedeschi G, Frank JA, Weinberger DR. Reproducibility of proton magnetic resonance spectroscopic imaging in patients with schizophrenia. Neuropsychopharmacology. 1998; 18:1–9. https://doi.org/10.1016/S0893-133X(97)00090-0.
40. Grimm S, Beck J, Schuepbach D, Hell D, Boesiger P, Bermpohl F, Niehaus L, Boeker H, Northoff G. Imbalance between left and right dorsolateral prefrontal cortex in major depression is linked to negative emotional judgment: An fMRI study in severe major depressive disorder. Biological Psychiatry. 2008; 63:369–76. https://doi.org/10.1016/j.biopsych.2007.05.033.
41. Kaller CP, Heinze K, Frenkel A, Lappchen CH, Unterrainer JM, Weiller C, Lange R, Rahm B. Differential impact of continuous theta-burst stimulation over left and right DLPFC on planning. Human Brain Mapping. 2013; 34:36–51. https://doi.org/10.1002/hbm.21423.
42. Mendrek A, Kiehl KA, Smith AM, Irwin D, Forster BB, Liddle PF. Dysfunction of a distributed neural circuitry in schizophrenia patients during a working-memory performance. Psychological Medicine. 2005; 35:187–96. https://doi.org/10.1017/S0033291704003228.
43. Heimberg C, Komoroski RA, Lawson WB, Cardwell D, Karson CN. Regional proton magnetic resonance spectroscopy in schizophrenia and exploration of drug effect. Psychiatry Res. 1998; 83:105–15.
44. Araque A, Parpura V, Sanzgiri RP, Haydon PG. Tripartite synapses: glia, the unacknowledged partner. Trends in Neurosciences. 1999; 22:208–15. https://doi.org/10.1016/S0166-2236(98)01349-6.
45. Cotter DR, Pariante CM, Everall IP. Glial cell abnormalities in major psychiatric disorders: the evidence and implications. Brain Res Bull. 2001; 55:585–95.
46. Rajkowska G, Miguel-Hidalgo JJ, Makkos Z, Meltzer H, Overholser J, Stockmeier C. Layer-specific reductions in GFAP-reactive astroglia in the dorsolateral prefrontal cortex in schizophrenia. Schizophr Res. 2002; 57:127–38. http://dx.doi.org/10.1016/S0920-9964(02)00339-0.
47. Stanley JA, Williamson PC, Drost DJ, Rylett RJ, Carr TJ, Malla A, Thompson RT. An in vivo proton magnetic resonance spectroscopy study of schizophrenia patients. Schizophr Bull. 1996; 22:597–609.
48. Yoo SY, Yeon S, Choi CH, Kang DH, Lee JM, Shin NY, Jung WH, Choi JS, Jang DP, Kwon JS. Proton magnetic resonance spectroscopy in subjects with high genetic risk of schizophrenia: investigation of anterior cingulate, dorsolateral prefrontal cortex and thalamus. Schizophr Res. 2009; 111:86–93. https://doi.org/10.1016/j.schres.2009.03.036.