
INTRODUCTION
Prostate cancer is the most common cancer in Western men and its rate is increasing in the Eastern world [1]. During the multiple-step process of tumorigenesis, a typical prostate cancer cell has accumulated around 100 genetic and epigenetic alterations of its genome [2, 3]. It is now widely believed that tumor microenvironment plays key role in the carcinogenesis and resistance of cancer cells to anti-cancer drugs. Due to the transient and long-term lack of nutrients, energy and oxygen, cancer cells frequently undergo hypoxia and nutrient deprivation. It has been well documented that hypoxia enhances tumorigenesis by promoting genome instability [4, 5]. Moreover, hypoxia is currently becoming an important prognostic marker in prostate cancers [6], which indicates that hypoxia may cause molecular changes that contribute to the proliferation or differentiation of prostate cancer cells. However, the mechanism by which hypoxia affects the survival of prostate cancer cells remains to be determined.
It was recently discovered that hypoxia induces autophagy, providing a mechanism of the protection of prostate cancer cells by hypoxia [7]. Autophagy is a tightly controlled process that eliminates defective organelles and proteins from the cell. Classic macroautophagy initiates from an isolation membrane (phagophore), followed by the formation of a double-membrane autophagosome, which in turn fuses with lysosomes. Autophagy is mainly controlled by MTOR signaling and ATG family members. Recently, autophagy has been found as a key regulator of cancer cell survival. By providing nutrition and reducing oxidative stress, autophagy contributes to sustained growth of various types of tumor cells [8-10]. In contrast, deregulation of autophagy results in metabolic imbalance and cell death [11]. Autophagy mediates lipid droplet degradation and lipolysis, which promotes the survival of prostate cancer cells [12]. Furthermore, the combinatory treatment of autophagy inhibitors and anticancer drugs has a more significant inhibitory effect on prostate cancer growth [13, 14]. However, it is still unknown how autophagy is regulated in prostate cancer under hypoxia.
It has been reported that hypoxia regulates microRNAs (miRNAs) expression [15]. miRNAs are small, noncoding RNA molecules that modulate gene expression and regulate many cellular processes [16]. miRNAs can function as tumor suppressors, oncogenes, or both. Deregulation of miRNAs has been found in most cancers. It has been demonstrated that miRNAs modulate autophagic signaling networks in cancer cells [17, 18]. These facts led us to propose that miRNAs may affect the growth and survival of cancer cells through modulating autophagy under hypoxia.
In this study, we have investigated the function of miR-96 in the regulation of autophagy in prostate cancer cells under hypoxia, and found that miR-96 regulates autophagy under hypoxia via targeting MTOR and ATG7.
RESULTS
Either up-regulation or down-regulation of miR-96 suppresses prostate cancer cell proliferation in vitro and tumor growth in vivo under hypoxia
miR-96 is located at chromosome 7q32, a region containing several oncogenes including MET and BRAF and frequently amplified in cancers [19, 20]. miR-96 is up-regulated and demonstrates oncogenic activities in many common cancers, including liver [21, 22], prostate [23, 24], bladder [25] and colon cancers [26]. However, ectopic expression of miR-96 inhibited the growth of several cancer cells [27, 28], indicating a complex function of miR-96 in the initiation, progression and maintenance of tumorigenesis. In order to understand the biology of miR-96 in prostate cancer, we assayed the cell viability of prostate cancer cells in hypoxia by either up-regulating or down-regulating miR-96. Prostate cancer LNCaP, 22Rv1 and LAPC4 cells were transfected with 100nM miR-96 mimics (miR-96M) or miR-96 inhibitors (miR-96I), in the presence or absence of hypoxia. Cell viability was assessed by the CCK-8 assay after 36 h. The results showed that miR-96M significantly inhibited the cell proliferation of LNCaP, 22Rv1 and LAPC4 cells in hypoxia but not normoxia (Fig. 1A). Unexpectedly, miR-96I also significantly suppressed the proliferation of LNCaP and LAPC4 cells and slightly of 22Rv1 cells in hypoxia but not normoxia. Increase in the concentration of miR-96M or miR-96I resulted in further inhibition of LNCaP cell proliferation (Fig. 1B); however, different doses of mimics negative controls (M-NC) or inhibitors negative controls (I-NC) caused similar changes in cell survival (Fig. S1A). We next determined the viability of LNCaP cells for 24 h, 48 h and 72 h and found that enhanced inhibitory effects were observed for miR-96M or miR-96I after both 48 and 72 h in comparison to M-NC or I-NC (Fig. 1C). These results indicate that either miR-96M or miR-96I reduces the cell proliferation of prostate cancer cells in a time and dosage dependent manner under hypoxia.
To extend our observations from cell cultures, we established prostate cancer LNCaP mouse xenograft model. Intratumoral injections of agomiR-96 or antagomiR-96I significantly reduced the volumes of subcutaneous tumors (Fig. 1D), demonstrating that both agomiR-96M and miR-96I can inhibit tumor growth.
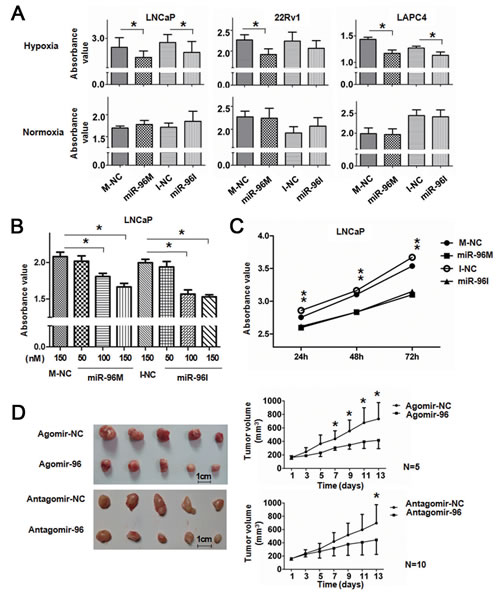
Figure 1: Up-regulation or down-regulation of miR-96 inhibited prostate cancer cell proliferation in vitro and tumor growth in vivo. A, LNCaP, 22Rv1, and LAPC4 cells were transfected with 100nM miR-96M or miR-96I in the presence or absence of hypoxia. Cell viability was assessed by the CCK-8 assay after 36 h. 450nm absorbance value was tested. (n=6) B, LNCaP cells were transfected with miR-96M or miR-96I with the concentrations as indicated. Cell viability was determined by CCK-8 after incubation in hypoxia for 36 h. (n=6) C, LNCaP cells were transfected with 100nM miR-96M or miR-96I and incubated for the time as indicated. Cell viability was determined by CCK-8. (n=6) D, LNCaP cells were injected into mice subcutaneously. After the tumor was established, tumors were directly injected with 4nmol agomiR-96 or antagomiR-96 in 50ul PBS followed by monitoring of tumor size for 2 weeks (mean±SD), and representative tumor samples were taken. M-NC: miRNAs mimics negative control; I-NC: miRNAs inhibitors negative control. *p < 0.05
Up-regulation and down-regulation of miR-96 abolishes hypoxia-induced autophagy
One of the physiological responses of hypoxia is the induction of autophagy [29]. To investigate if hypoxia induces autophagy in prostate cancer cells, we detected LC3B and SQSTM1 expression level in LNCaP and 22Rv1 cells treated with hypoxia in the presence or absence of CQ (Fig. 2A). Consistent with the rapid turnover of LC3-II in prostate cancer cells [30, 31], only basal levels of LC3-II were detected in the cells in the absence of CQ. However, in the presence of CQ, cells treated with hypoxia showed increased level of LC3-II and decreased SQSTM1, which indicates hypoxia induces autophagy in these cells.
To test if miR-96 modulates autophagy under hypoxia, we treated LNCaP, 22Rv1 and LAPC4 cells with miR-96M or miR-96I with or without CQ in hypoxia for 36 h and assessed the lipidation of endogenous LC3 (Fig. 2B). Only basal levels of LC3-II were detected in the cells without treatment with CQ. However, in the presence of CQ, cells transfected with either miR-96M or miR-96I demonstrated decrease of LC3-II and accumulation of SQSTM1. To support this observation, we detected the punctate GFP-LC3 in LNCaP and 22Rv1 cells by confocal microscopy (Fig. 2C) and high-content screening system (Fig. 2D). The number of punctate GFP-LC3 per cell significantly decreased in cells transfected with either miR-96M or miR-96I (Fig. 2D). In addition, increasing the concentrations of either miR-96M or miR-96I led to further down-regulation of LC3-II (Fig. 2E), however different doses of M-NC or I-NC caused similar changes in autophagy level (Fig. S1B).
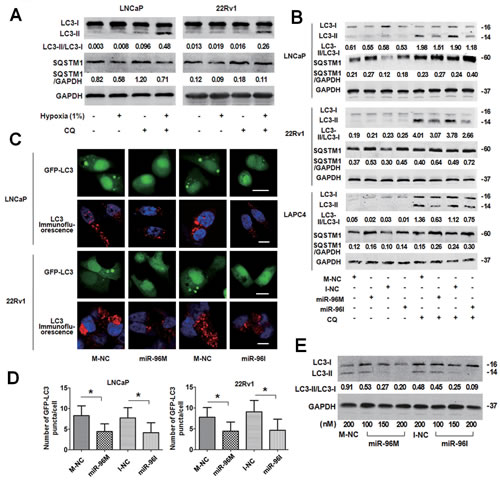
Figure 2: Transfection of miR-96M or miR-96I inhibited hypoxia-induced autophagy in prostate cancer cell. A, LNCaP and 22Rv1 cells were exposed to normoxia or hypoxia (1%) with or without CQ (50μM and 30μM, respectively) for 24 h. LC3B, SQSTM1 and GAPDH were determined by Western blot. B, LNCaP, 22Rv1, and LAPC4 cells were transfected with 100nM miR-96M or miR-96I with or without CQ (50μM, 30μM and 30μM, respectively). After 36 h exposure to hypoxia, LC3B, SQSTM1 and GAPDH were determined by western blot. C, LNCaP and 22Rv1 cells were co-transfected with GFP-LC3 and miR-96M or miR-96I and subjected to hypoxia for 36 h. LC3 was stained for immunocytochemistry. The cells were then observed under confocal microscopy. (Scale bars: LNCaP 20 μm; 22Rv1 10 μm.) D, Number of GFP-LC3 puncta/cell was calculated with high-content screening. (n=3) E, LNCaP cells were transfected with miR-96M or miR-96I at the indicated concentrations and incubated under hypoxia for 36 h. LC3B, and GAPDH were determined by Western blot. 50 µM CQ was used in this experiment. M-NC: miRNAs mimics negative control; I-NC: miRNAs inhibitors negative control. *p < 0.05
Dose-dependent regulation of miR-96 on hypoxia induced autophagy and cell viability
To further investigate the role of miR-96 in prostate cancer cells subjected to hypoxia, we first detected the relative expression level of miR-96 by qPCR in cells incubated under normoxia or hypoxia. miR-96 levels in the cells exposed to hypoxia were increased by 2-3 folds (2.1, 2.5 and 3.5 folds in LNCaP, 22Rv1 and LAPC4 cells, respectively, p<0.05) as compared with the normoxic groups (Fig. 3A). In order to explore the function of the increased miR-96 in hypoxic environment, we inhibited the up-regulation of miR-96 under hypoxia by transfection of different doses of miR-96I, and assessed miR-96 expression level (Fig 3B1), LC3-II accumulation (Fig 3B2) and cell proliferation (Fig 3B3). In addition, different doses of miR-96M were transfected and the above experiments were also performed. The results demonstrated that transfection of different doses (25-150nM) of miR-96M or miR-96I led to 0.01-4500 folds change (2-∆∆ct) of miR-96 expression (Fig. 3B1). When up-regulation of miR-96 under hypoxia was suppressed (about 2-3 fold), autophagy was also inhibited and LC 3-II decrease was more obvious when larger doses of inhibitors were transfected. In contrast, when miR-96M was transfected, the expression LC3-II was first increased and then decreased (Fig. 3B2). Cell viability test by CCK-8 kit demonstrated that large doses of miR-96M or miR-96I induced significant decrease of cell viability when autophagy was considerably inhibited. However, modest inhibition of miR-96 significantly increased cells viability in LNCaP cells (Fig. 3B3). Taken together, these results suggest that hypoxia-induced up-regulation of miR-96 might promote autophagy flux. However, further increase of miR-96 to a certain threshold might suppress autophagy and hence decrease cell viability.
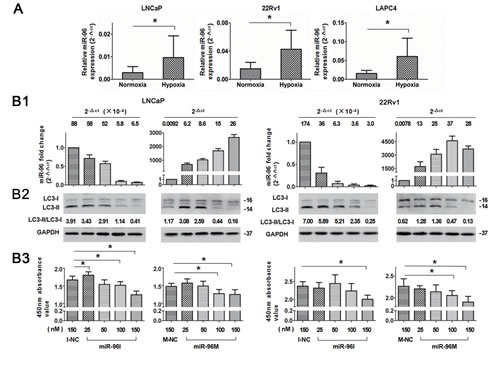
Figure 3: Dose-dependent regulation of miR-96 on hypoxia induced autophagy in prostate cancer cells. A, LNCaP, 22Rv1, and LAPC4 cells were cultured in hypoxia for 36 h. miR-96 expression levels were determined by qPCR (n=3). B, Cells were transfected with different concentrations of miR-96M or miR-96I (25-150nM) and then exposed to hypoxia for 36 h. miR-96M expression level (B1), LC3B (B2), and cell viability (B3) were assayed by qPCR (n=3), immunoblots and CCK-8 (n=6), respectively. CQ was used in immunoblot experiments. M-NC: miRNAs mimics negative control; I-NC: miRNAs inhibitors negative control. *p < 0.05.
miR-96 regulates autophagy by directly targeting MTOR and ATG7
To explore the mechanism by which miR-96 regulates autophagy, we searched “Targetscan” for the potential targets of miR-96 and identified 6 potential target genes including ATG7, ATG16L1, ATG9A, MTOR, DEPTOR, and RICTOR. We then evaluated the effects of miR-96 on those genes by transfecting miR-96M in LNCaP and 22Rv1 cells and checking the mRNA and protein levels of these genes with qPCR and Western blots. In both cell lines, we found that transfection of miR-96M resulted significant reduction of the mRNA levels of ATG7 and MTOR (Fig. 4A). In contrast, transfection of miR-96I led to significant increase of the mRNA levels of ATG7 and MTOR (Fig. 4A). Consistent with the alteration of mRNA levels, transfection of miR-96M and miR-96I resulted in significant reduction and increase, respectively, of the protein levels of ATG7 and MTOR (Fig. 4B). Phosphorylation of P70S6K, a direct downstream substrate of MTOR, was inhibited by over-expression of miR-96 (Fig. 4B), further supporting the inhibition of MTOR by miR-96. In addition, dual-luciferase reporter assays showed that over-expression of miR-96 significantly reduced the luciferase activity in cells transfected with plasmids containing wild-type but not mutant 3’UTR sequences of ATG7 or MTOR (Fig. 4C).
We next asked whether miR-96 regulates autophagy through targeting ATG7 or MTOR. Over-expression of miR-96 in LNCaP cells inhibited autophagy, whereas rapamycin did not reverse the effect of miR-96. However, co-transfection of miR-96M and plasmids with ATG7 cDNA rescued autophagy back to control levels (Fig. 4D left). In contrast, miR-96I also inhibited autophagy, which was reversed by rapamycin but not ectopic expression of ATG7 (Fig. 4D right). These results together demonstrated that miR-96 regulates hypoxia-induced autophagy through targeting ATG7 or MTOR.
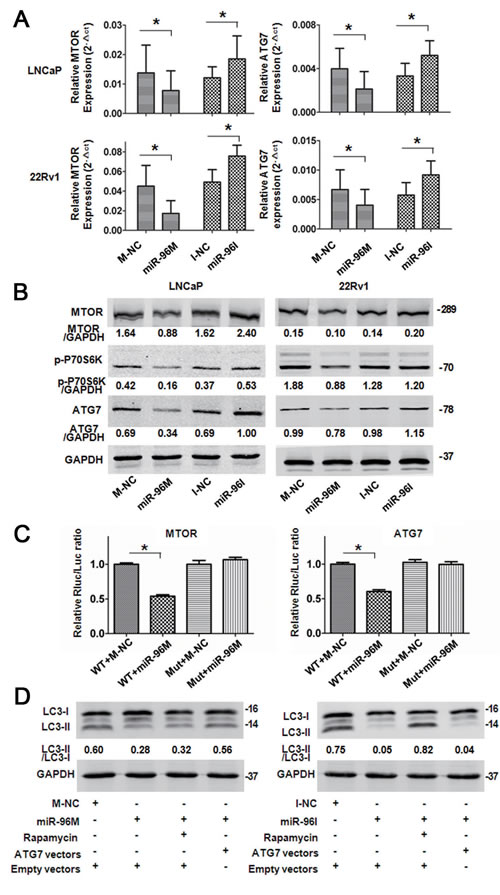
Figure 4: miR-96 regulated autophagy by targeting MTOR and ATG7. A, LNCaP and 22Rv1 cells were transfected with 100nM miR-96M or miR-96I and incubated for 36 h. MTOR and ATG7 mRNA levels were determined by qPCR (n=6). B, LNCaP and 22Rv1 cells were transfected with 100nM miR-96M or miR-96I and incubated for 36 h. MTOR, p-P70S6K and ATG7 protein levels were checked by Western blots. C, Normalized luciferase activity in 293T cells co-transfected with the wild-type or mutant MTOR (ATG7) and negative control or miR-96M (n=3). D, Rescue experiments by over-expressing MTOR or ATG7 in LNCaP cells. miR-96M (100nM), miR-96I (100nM), rapamycin (10nM), and CQ (50 M) was used in this experiment. M-NC: miRNAs mimics negative control; I-NC: miRNAs inhibitors negative control. *p < 0.05
MTOR inhibits autophagy while ATG7 is essential for the formation of autophagosome. Targeting both MTOR and ATG7 predicts that miR-96 can both inhibit and promote autophagy, indicating that miR-96 acts as both suppressor and promoter of autophagy. How does miR-96 modulate autophagy in such a contradictory way? Figure 3B1 and figure 3B2 demonstrated that, in LNCaP cells, when miR-96 level increased to the relative fold range 2-∆∆ct <1,000, or the relative miR-96 expression level 2-∆ct < 8.6, autophagy was promoted. Similarly, in 22Rv1 cells, when miR-96 level increased to the relative fold range 2-∆∆ct < 3,000, or the relative miR-96 expression level 2-∆ct < 25, autophagy was enhanced. However when miR-96 level was further increased, autophagy was suppressed. These results suggest the following model of the function of miR-96 in the regulation of autophagy: when miR-96 level increases at the first stage, the effect of inhibition on MTOR is more significant than that on ATG7, the outcome is the promotion of autophagy (Fig. 5A). However, when miR-96 continues to increase and exceeds the threshold, the inhibition on ATG7 becomes the main event. Although a large dose of miR-96 might suppress MTOR expression and hence promote the initiation of autophagosome, the downstream autophagosome expansion is likely attenuated via inhibition of ATG7 by a large dose of miR-96. This may cause the final outcome of autophagy inhibition (Fig. 5B). Therefore, miR-96 regulates autophagy in a dose dependent manner in prostate cancer cells.
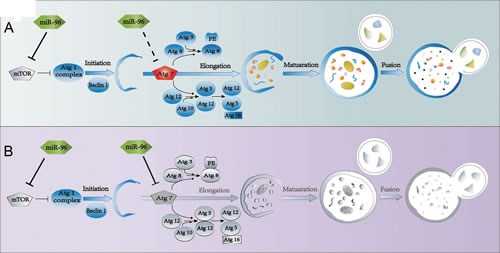
Figure 5: Schematic diagram demonstrating dose-dependent regulation of miR-96 on hypoxia induced-autophagy. A, When miR-96 expression levels in LNCaP cells were 2-Δct <8.6 or 2-ΔΔct <1,000, while in 22Rv1 cells 2-Δct <25 or 2-ΔΔct <3,000, autophagy was promoted. B, When miR-96 expression levels in LNCaP cells were 2-Δct >8.6 or 2-ΔΔct >1,000, while in 22Rv1 cells 2-Δct >25 or 2-ΔΔct >3,000, autophagy was inhibited. Colorful draws represent active state of the factors, and gray draws represent the inactivated state.
Apoptosis and cell cycle shift contributes to the changes of cell viability
Autophagy may reduce apoptosis to help tumor cells to survive hypoxic stress [29]. In consistence, blockage of autophagy induces apoptosis under metabolic stresses such as hypoxia [10]. In addition, deregulation of autophagy or MTOR pathway leads to alterations of cell cycle distribution [32, 33]. We next assessed the apoptosis level and cell cycle distribution of LNCaP and 22Rv1 cells subjected to hypoxia for 36 h. Transfection of small doses (25nM) of miR-96M or miR-96I didn’t change the rate of apoptotic cells (Fig. 6A), the activity of CASP3 (Fig. 6B), and the level of cleaved CASP3 (Fig. 6C). However, large doses of miR-96M or miR-96I (100nM) led to significant enhancement of apoptosis (Fig. 6A-C).
Hypoxia can induce cell cycle arrest [34]. To test if miR-96 affects cell cycle progression in hypoxia, we performed high-content screening systems. We found that miR-96I significantly restored cell proliferation in LNCaP cells subjected to 36 h hypoxia, regardless of transfection doses (Fig. 6D). In contrast, large dose of miR-96M induced a more significant cell cycle arrest in both LNCaP and 22Rv1 cells (Fig. 6D). These data suggest that the increase of cell viability by low dose of miR-96I (Fig. 3B3) may result from the restored cell proliferation by miR-96 inhibition, while large dose of miR-96I might decrease cell viability by enhancing apoptosis (Fig. 3B3). However, large dose of miR-96M may cause a significant decrease of cell viability by inducing both cell apoptosis and cell cycle arrest (Fig. 3B3).
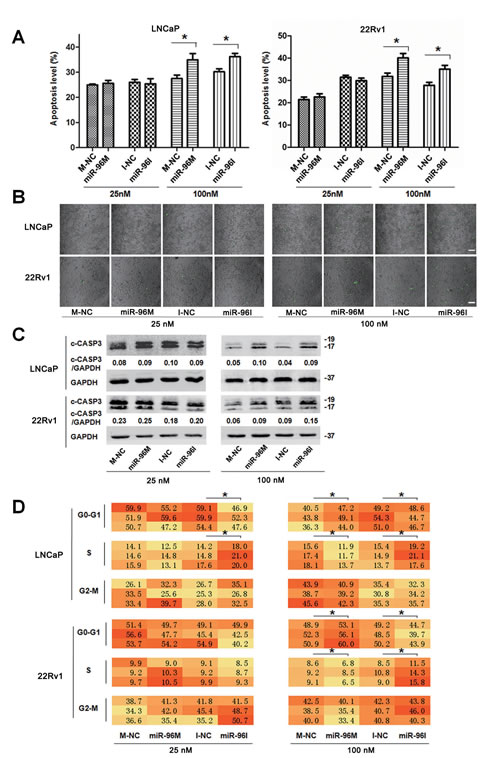
Figure 6: Apoptosis level and cell cycle shifted by miR-96 in prostate cancer cells subjected to hypoxia. A, LNCaP and 22Rv1 cells were transfected with miR-96M or miR-96I at the indicated concentrations and incubated under hypoxia for 36 h. Apoptosis was examined by flow cytometer (n=3). B, LNCaP and 22Rv1 cells were transfected with miR-96M or miR-96I at the indicated concentrations and incubated under hypoxia for 36 h. CASP3 activity in adherent prostate cancer cells was tested. Green dots represented the cells in which CASP3 was activated. (Scale bars: 100 μm). C, Cells were treated as A, cleaved CASP3 was determined by western blots. D, Cells were treated as A, cell cycle distribution was determined by high-content screening. M-NC: miRNAs mimics negative control; I-NC: miRNAs inhibitors negative control. *p < 0.05
miR-96 expression level correlates with clinical parameters in prostate cancer tissues
To evaluate the role of miR-96 in prostate cancer, we detected miR-96 expression level and analyzed the relationship between miR-96 and patients’ clinical parameters in 20 prostate cancer tissues. The results showed that miR-96 level increased with WHO grade with the mean miR-96 expression (2-∆ct) of 0.004, 0.007, and 0.018 in WHO I, II and III grade, respectively (p<0.05) (Fig. 7A).
Further, we found that the maximum relative expression level (2-∆ct ) of miR-96 in the 20 prostate cancer tissues was 0.03 and the maximum fold change (2-∆∆ct ) was 83, which indicate that miR-96 might promote autophagy (Fig. 3B) and serve as an oncogene in prostate cancer. In addition, great differences were found in the miR-96 expression level between prostate cancer tissues and the cells transfected with large dose of miR-96M.
To further investigate the relationship between miR-96 and ATG7 or MTOR, we detected miR-96 expression level, ATG7 and MTOR protein levels in 10 prostate cancer tissues (Fig. 7B). We found that the miR-96 level was reversely correlated with the protein levels of ATG7 and MTOR (p < 0.05) (Fig. 7C), which indicate that miR-96 regulates ATG7 and MTOR in prostate cancer tissues.
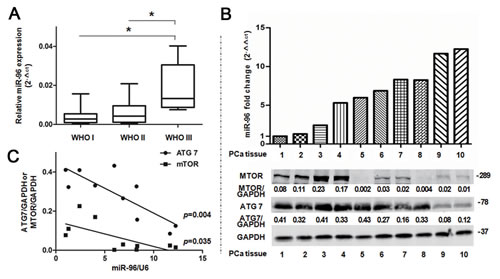
Figure 7: miR-96 expression level in prostate cancer tissues is correlated with clinical parameters. A, miR-96 expression in the 20 prostate cancer tissues was determined by TaqMan qPCR analysis and grouped according to WHO I (n=8), II (n=7) and III (n=5) grade. Boxes represent the lower and the upper quartiles with medians; whiskers illustrate the 10 to 90 percentiles of the samples. B, Normalized miR-96 expression in the 10 prostate cancer (PCa) tissues was aligned with MTOR and ATG7 protein levels determined by immunoblots. C, Quantitative analysis of the correlations between miR-96 expression and ATG7 (r=0.82) or MTOR (r=0.67) expression in the above 10 prostate cancer tissues. *p < 0.05
DISCUSSION
In this study, we found that miR-96 regulated autophagy in prostate cancer cells in a dose-dependent manner through directly targeting two critical autophagy-related factors, MTOR and ATG7. Both in vitro and in vivo results demonstrated that regulation of autophagy by miR-96 affected prostate cancer cell proliferation and tumor growth. To the best of our knowledge, miR-96 is the first reported miRNA, which has a dual regulation on autophagy, providing a novel regulation mode of autophagy by miRNAs.
Both MTOR and ATG7 are essential regulators in autophagy pathways. MTOR is an upstream factor and involves in the phosphorylation of ATG1/ULK1 and ATG13. MTOR not only modulates autophagy, but also controls numerous other biological processes such as cell proliferation, survival and metabolism. ATG7 is a downstream factor and participates in the formation of LC3-PE and ATG12-ATG5 conjugate. In this study, we found that miR-96 regulated autophagy through modulation of both MTOR and ATG7. It seems that when miR-96 increases in response to hypoxia, the effects of targeting MTOR play a more important role. However when miR-96 further increases and exceeds a certain threshold, the effects of targeting ATG7 prevail.
miR-96 is a widely recognized oncogenic miRNA and was found to inhibit apoptosis [24, 35]. Our findings indicate that when miR-96 expression is elevated in response to hypoxic stress, it enhances autophagy and maintain cell survival by targeting MTOR. Tumor cells’ response to hypoxia is mediated partly through the suppression of MTOR activity [36, 37]. Inhibition of MTOR in hypoxia may reduce cell metabolism and suppress cellular senescence [38], which is believed to be a self -protective mechanism to maintain energy homeostasis and cell survival. In addition, inhibition of MTOR enhances autophagy, which helps cells to eliminate defective organelles and molecules, thereby recycling nutrients for survival under hypoxia. Hypoxia inhibits the MTOR pathway by REDD1 and the TSC1/TSC2 tumor suppressor complex [37, 39, 40]. In this study, we found that miR-96 was increased under hypoxia, accompanied with decrease of both mRNA and protein levels of MTOR. Our data indicated that miR-96 is a new factor connecting hypoxia and MTOR. The hypoxic tumor microenvironment is a hallmark of most solid tumors. Hypoxia might increase the expression of miR-96, which in turn inhibits MTOR subsequently leading to decreased cell proliferation and nutrition consumption while enhanced cell survival. Although the hypoxia~miR-96~MTOR pathway need to be further investigated in a large-scale clinic analysis, our data suggest that the hypoxia-induced up-regulation of miR-96 is one of the mechanisms by which hypoxia suppresses MTOR signaling. In conclusion, the up-regulation of miR-96 in response to hypoxic stress in prostate cancer cells inhibited MTOR, enhanced autophagy, and maintained cell survival.
miR-96 is over-expressed in prostate cancer cells [23, 41] and was found to promote prostate cancer cell proliferation by suppressing FOXO1 [35] and SLC39A1 [23]. However, recently it was reported that over-expression of miR-96 could shift its oncogenic role towards inhibition of tumor growth [20]. But the underlying mechanism is largely unknown. In this study, we found when miR-96 further increased and exceeded a certain threshold, it shifted from its autophagy-promoting to autophagy-inhibiting function by predominantly targeting an essential autophagy-related gene ATG7. Although high level of miR-96 may inhibit MTOR and thereby promote the initiation of autophagosome, it will prevent the expansion of autophagosome, which depends on ATG7. However, we found great differences in the miR-96 expression levels between prostate cancer tissues and the cells transfected with large dose of miR-96M, suggesting that the inhibition on autophagy by miR-96 is probably an off target effect, which indicated ATG7 might not be a target gene of miR-96 in prostate cancer tissues. However, we can’t ascertain with confidence that targeting ATG7 is an off-target effect, because miR-96 level was inversely correlated with the protein levels of ATG7 (Fig. 7B, 7C) in prostate cancer tissues, which indicated miR-96 might target ATG7 in prostate cancer tissues. Future studies are warranted to further elucidate the off-target effects of miR-96M [42] in a greater number of prostate cancer tissues.
It is not clear why inhibition of ATG7 is not observed when the expression of miR-96 is below the threshold. Firstly, it is possible that the effects of miR-96 on ATG7 are impaired by other potential factors or pathways when miR-96 expression level is below the threshold. Secondly, the dose-dependent regulation of autophagy by miR-96 might be due to the different binding affinity between miR-96 and MTOR or ATG7. It is possible the binding affinity between miR-96 and MTOR is stronger than that between miR-96 and ATG7, which is supported by the finding that MTOR scored higher than ATG7 according to both “Targetscan” and “miRDB”. Consistent with our findings, miR-375, known as a tumor suppressive gene, was reported to target PDK1, leading to the inhibition of PDK1/AKT/MTOR pathway [43] and thus promotion of autophagy [44]. However, it was recently demonstrated that over expression of miR-375 targets ATG7 and suppresses autophagy independently of its regulation on PDK1/AKT/MTOR signaling [45].
In summary, we found a dose dependent modulation of autophagy by miR-96 through regulation of MTOR and ATG7. These facts indicate that regulation of autophagy is complicated and flexible. Our data suggest that the regulation of miR-96 is in a dynamic balance in hypoxia, inhibition of MTOR by up-regulation of miR-96 may promote autophagy. However, ectopic over-expression of miR-96 to exceed a certain threshold may disrupt the balance and suppress autophagy. Of note, this biphasic regulation of autophagy by miR-96 affected prostate cancer cell proliferation and tumor growth. However, further studies are required to understand the complex role of miR-96 in autophagy regulation in hypoxia.
METHODS
Ethics Statement
Investigation has been conducted in accordance with the ethical standards and according to the Declaration of Helsinki and according to national and international guidelines and has been approved by the local institutional review board.
Cell Lines and Patient Samples
Prostate cancer cell lines LNCaP and 22Rv1 were purchased from the Cell Bank of the Chinese Academy of Sciences (Shanghai, China) and recently authenticated based on cross species checks, DNA authentication and quarantine. LAPC4 cells were obtained from University of California at Los Angeles (UCLA) and authenticated as described [46]. Cells were cultured in RPMI 1640 medium (11875, Gibco, MD, USA) supplemented with 10% fetal bovine serum (10099, Gibco) at 37 °C in an atmosphere of 5% CO2 and 95% air. If cells were cultured in hypoxia, the oxygen was maintained at 1%.
Prostate cancer tissue samples were collected from 20 patients who underwent radical prostatectomy between 2011 and 2012 in Shanghai Renji Hospital (Shanghai, China) and stored in the biobank [47]. All cases were diagnosed using adjacent histopathological slice and graded according to the WHO standard. Informed consent has been obtained for all the patients.
Chemical Reagents, miRNA Mimics, miRNA Inhibitors, Agomir, Antagomir, Plasmid, and Transfection.
Chloroquine (CQ), 4’,6-Diamidino-2-phenylindole (DAPI) and rapamycin were obtained from Sigma-Aldrich, MO, USA (C6628, D9564, 37094). miRNA mimics, inhibitors, agomir, and antagomir were purchased from RiboBio, Guangzhou, China (miR10000095, miR20000095, miR40000095, miR30000095). ATG7 plasmid was purchased from GeneChem Technologies, Shanghai, China (POSE142067150). GFP-LC3 plasmid was constructed by the Central Laboratory of Renji Hospital. Plasmids were validated by DNA sequencing in Beijing Genomics Institute. Transfection of nucleic acids was performed using Lipofectamine 2000 (11668, Life Technologies, CA, USA) according to the manufacturer’s instructions. When the effects of different doses of miRNA transfection were compared, the same dose of Lipofectamine 2000 was used according to the largest dose.
RNA Isolation, cDNA Synthesis and Quantitative Real-time PCR (qPCR)
Total RNA isolation, cDNA synthesis and qPCR from prostate cancer cell lines were performed as previously described [48]. The primers for qPCR were listed in Supplemental Information Table S1. Small RNAs were extracted by mirVanaTM miRNA Isolation Kit (AM1561, Life Technologies). Reverse transcription and qPCR were conducted with TaqMan MicroRNA RT kit (4366596, Life Technologies) and TaqMan Universal Mastermix (4440043, Life Technologies), respectively. miR-96 specific primers were purchased from Life Technologies (Assay no. 000186). U6 snRNA (Assay no. 001973) was used as the reference gene.
Western Blot
Protein from cell lines was isolated with M-PER Mammalian Protein Extraction Reagent (78501, Thermo Scientific, MA, USA). Protein from prostate cancer tissue was extracted with Complete Lysis-M (13354520, Roche, Mannheim, Germany). Protein concentration was determined by the BCA method (23225, Beyotime, Shanghai, China). Proteins were separated using 6-12% SDS-PAGE and transferred onto nitrocellulose membrane (10401396, GE healthcare, OH, USA). The membranes were blocked by blocking buffer (927-40000, Odyssey, MA, USA) for 1 hour and then incubated in the primary antibodies at 4℃ overnight. After washing with TBST, the membranes were incubated with secondary antibodies at room temperature for 1 hour. Protein bands were visualized by infrared imaging system (Odyssey) and quantified with Odyssey application software. Rabbit anti-LC3B, SQSTM1, ATG7, MTOR, p-P70S6k, and cleaved CASP3 antibodies were purchased from Cell Signaling Technology, MA, USA (2775, 5114, 8558, 2983, 9208, 9664). Anti-GAPDH antibody was purchased from Abcam, Cambridge, UK (9485).
Dual-luciferase Reporter Assay
A 1095-bp fragment of wild-type (WT) ATG7 3’UTR (Table S2) containing two conserved binding sites of miR-96 (Position 1287-1293 and 1984-1990) or a mutant ATG7 3’UTR sequence was cloned into the pmiR-RB-REPORT™ (RiboBio). For MTOR gene, the whole 3’UTR sequence (954-bp) containing one conserved binding site (Position 918-924) of miR-96 and a mutant sequence were cloned as for ATG7 (Table S2). Different reporter vectors (p-hRluc-3’UTR-WT or p- hRluc-3’UTR-Mut) were co-transfected with miRNA mimics or mimics negative control into 293T cells. Luciferase activity was determined by Dual-Luciferase Reporter Assay (E1910, Promega, WI, USA).
Cell Viability, Apoptosis and Cell-cycle Analysis
Cell viability was assessed with Cell Counting Kit-8 (CCK-8; CK04, Dojindo, Kumamoto, Japan) on a spectrophotometer (BioTek, VT, USA). Apoptosis was examined using the Annexin V-FITC Apoptosis Detection Kit (V13241, Life Technologies) and analyzed by FACSCalibur flow cytometer (BD Biosciences, CA, USA). CASP3 activity in intact adherent cells was detected with NucView 488 caspase-3 substrate (30029, Biotium, CA, USA). The stained cells were viewed with confocal microscopy. Apoptosis was also assessed by immunoblotting of cleaved CASP3. Cell cycle was analyzed with high-content screening by staining cells with DAPI. Cell cycle distribution was classified by integrated intensity.
Confocal Microscopy and High-content Screening
LC3B immunofluorescence was detected with confocal microscopy as previously described [49]. GFP-LC3 transfection was analyzed with MD ImageXpress® Micro XLS System (Molecular Devices, CA, USA).
Animal Experiments
All animal experiments were performed in accordance with the NIH Guide for the Care and Use of Laboratory Animals. We performed all animal surgery under ketamine anesthesia, and took every effort to minimize animal suffering. Athymic nude mice (J:NU, male; 6 weeks old; 20-30g) were provided by Shanghai SLAC laboratory Animal Co., Ltd. The mice were randomly divided into four groups (Agomir negative control group, n = 5; agomiR-96 group, n = 5; antagomir negative control group, n = 10; antagomiR-96 group, n = 10). LNCaP cells (5×10⁶) in PBS were inoculated subcutaneously into the flanks of nude mice. Tumor size was measured as described previously [45]. Four nmol agomiR-96 or antagomiR-96 in 50 µl PBS was directly injected into each tumor twice a week. The injection began when tumor volume reached 150-200mm3. Mice were sacrificed after 2 weeks.
Statistical Analysis
Data analyses were conducted with SPSS 16.0 (SPSS, IL, USA) and GraphPad-Prism5 (GraphPad, CA, USA). Data are presented as the mean ± standard deviation (SD) and analyzed by the Student’s t test or ANOVA. Pearson’s correlation was performed to determine the relationship between miR-96 and its target genes. Schematic diagram was plotted with Adobe Illustrator CS6 (Adobe, CA, USA). Heat map was generated using Microsoft Office Excel 2007 (Microsoft, WA, USA). All tests were 2-tailed, and p < 0.05 was considered statistically significant. Each experiment was performed in triplicate.
ACKNOWLEDGEMENTS
This work was supported by Shanghai Committee of Science and Technology (124119a1300; 12DZ2295005), and Shanghai JiaoTong University School of Medicine (12XJ10014; YBKL2013004). The funders had no role in study design, data collection and analysis, decision to publish, or preparation of the manuscript. The authors disclose no potential conflicts of interest.
REFERENCES
1. Jemal A, Center MM, DeSantis C and Ward EM. Global patterns of cancer incidence and mortality rates and trends. Cancer Epidemiol Biomarkers Prev. 2010; 19(8):1893-1907.
2. Kandoth C, McLellan MD, Vandin F, Ye K, Niu B, Lu C, Xie M, Zhang Q, McMichael JF, Wyczalkowski MA, Leiserson MD, Miller CA, Welch JS, Walter MJ, Wendl MC, Ley TJ, et al. Mutational landscape and significance across 12 major cancer types. Nature. 2013; 502(7471):333-339.
3. Hanahan D and Weinberg RA. Hallmarks of cancer: the next generation. Cell. 2011; 144(5):646-674.
4. Pires IM, Bencokova Z, Milani M, Folkes LK, Li JL, Stratford MR, Harris AL and Hammond EM. Effects of acute versus chronic hypoxia on DNA damage responses and genomic instability. Cancer Res. 2010; 70(3):925-935.
5. Taiakina D, Dal Pra A and Bristow RG. Intratumoral hypoxia as the genesis of genetic instability and clinical prognosis in prostate cancer. Adv Exp Med Biol. 2014; 772:189-204.
6. Vergis R, Corbishley CM, Norman AR, Bartlett J, Jhavar S, Borre M, Heeboll S, Horwich A, Huddart R, Khoo V, Eeles R, Cooper C, Sydes M, Dearnaley D and Parker C. Intrinsic markers of tumour hypoxia and angiogenesis in localised prostate cancer and outcome of radical treatment: a retrospective analysis of two randomised radiotherapy trials and one surgical cohort study. Lancet Oncol. 2008; 9(4):342-351.
7. Chhipa RR, Wu Y and Ip C. AMPK-mediated autophagy is a survival mechanism in androgen-dependent prostate cancer cells subjected to androgen deprivation and hypoxia. Cell Signal. 2011; 23(9):1466-1472.
8. Janku F, McConkey DJ, Hong DS and Kurzrock R. Autophagy as a target for anticancer therapy. Nat Rev Clin Oncol. 2011; 8(9):528-539.
9. Kimmelman AC. The dynamic nature of autophagy in cancer. Genes Dev. 2011; 25(19):1999-2010.
10. Degenhardt K, Mathew R, Beaudoin B, Bray K, Anderson D, Chen G, Mukherjee C, Shi Y, Gelinas C, Fan Y, Nelson DA, Jin S and White E. Autophagy promotes tumor cell survival and restricts necrosis, inflammation, and tumorigenesis. Cancer Cell. 2006; 10(1):51-64.
11. Mathew R, Karantza-Wadsworth V and White E. Role of autophagy in cancer. Nat Rev Cancer. 2007; 7(12):961-967.
12. Kaini RR, Sillerud LO, Zhaorigetu S and Hu CA. Autophagy regulates lipolysis and cell survival through lipid droplet degradation in androgen-sensitive prostate cancer cells. Prostate. 2012; 72(13):1412-1422.
13. Lamoureux F and Zoubeidi A. Dual inhibition of autophagy and the AKT pathway in prostate cancer. Autophagy. 2013; 9(7):1119-1120.
14. Lamoureux F, Thomas C, Crafter C, Kumano M, Zhang F, Davies BR, Gleave ME and Zoubeidi A. Blocked autophagy using lysosomotropic agents sensitizes resistant prostate tumor cells to the novel Akt inhibitor AZD5363. Clin Cancer Res. 2013; 19(4):833-844.
15. Kulshreshtha R, Ferracin M, Wojcik SE, Garzon R, Alder H, Agosto-Perez FJ, Davuluri R, Liu CG, Croce CM, Negrini M, Calin GA and Ivan M. A microRNA signature of hypoxia. Mol Cell Biol. 2007; 27(5):1859-1867.
16. Selbach M, Schwanhausser B, Thierfelder N, Fang Z, Khanin R and Rajewsky N. Widespread changes in protein synthesis induced by microRNAs. Nature. 2008; 455(7209):58-63.
17. Fullgrabe J, Klionsky DJ and Joseph B. The return of the nucleus: transcriptional and epigenetic control of autophagy. Nat Rev Mol Cell Biol. 2014; 15(1):65-74.
18. Frankel LB and Lund AH. MicroRNA regulation of autophagy. Carcinogenesis. 2012; 33(11):2018-2025.
19. Segura MF, Hanniford D, Menendez S, Reavie L, Zou X, Alvarez-Diaz S, Zakrzewski J, Blochin E, Rose A, Bogunovic D, Polsky D, Wei J, Lee P, Belitskaya-Levy I, Bhardwaj N, Osman I, et al. Aberrant miR-182 expression promotes melanoma metastasis by repressing FOXO3 and microphthalmia-associated transcription factor. Proc Natl Acad Sci U S A. 2009; 106(6):1814-1819.
20. Wang Y, Huang JW, Calses P, Kemp CJ and Taniguchi T. MiR-96 downregulates REV1 and RAD51 to promote cellular sensitivity to cisplatin and PARP inhibition. Cancer Res. 2012; 72(16):4037-4046.
21. Pineau P, Volinia S, McJunkin K, Marchio A, Battiston C, Terris B, Mazzaferro V, Lowe SW, Croce CM and Dejean A. miR-221 overexpression contributes to liver tumorigenesis. Proc Natl Acad Sci U S A. 2010; 107(1):264-269.
22. Ladeiro Y, Couchy G, Balabaud C, Bioulac-Sage P, Pelletier L, Rebouissou S and Zucman-Rossi J. MicroRNA profiling in hepatocellular tumors is associated with clinical features and oncogene/tumor suppressor gene mutations. Hepatology. 2008; 47(6):1955-1963.
23. Mihelich BL, Khramtsova EA, Arva N, Vaishnav A, Johnson DN, Giangreco AA, Martens-Uzunova E, Bagasra O, Kajdacsy-Balla A and Nonn L. miR-183-96-182 cluster is overexpressed in prostate tissue and regulates zinc homeostasis in prostate cells. J Biol Chem. 2011; 286(52):44503-44511.
24. Guttilla IK and White BA. Coordinate regulation of FOXO1 by miR-27a, miR-96, and miR-182 in breast cancer cells. J Biol Chem. 2009; 284(35):23204-23216.
25. Yoshino H, Seki N, Itesako T, Chiyomaru T, Nakagawa M and Enokida H. Aberrant expression of microRNAs in bladder cancer. Nat Rev Urol. 2013; 10(7):396-404.
26. Bandres E, Cubedo E, Agirre X, Malumbres R, Zarate R, Ramirez N, Abajo A, Navarro A, Moreno I, Monzo M and Garcia-Foncillas J. Identification by Real-time PCR of 13 mature microRNAs differentially expressed in colorectal cancer and non-tumoral tissues. Mol Cancer. 2006; 5:29.
27. Yu S, Lu Z, Liu C, Meng Y, Ma Y, Zhao W, Liu J, Yu J and Chen J. miRNA-96 suppresses KRAS and functions as a tumor suppressor gene in pancreatic cancer. Cancer Res. 2010; 70(14):6015-6025.
28. Poell JB, van Haastert RJ, de Gunst T, Schultz IJ, Gommans WM, Verheul M, Cerisoli F, van Noort PI, Prevost GP, Schaapveld RQ and Cuppen E. A functional screen identifies specific microRNAs capable of inhibiting human melanoma cell viability. PLoS One. 2012; 7(8):e43569.
29. Mazure NM and Pouyssegur J. Hypoxia-induced autophagy: cell death or cell survival? Curr Opin Cell Biol. 2010; 22(2):177-180.
30. Bennett HL, Fleming JT, O’Prey J, Ryan KM and Leung HY. Androgens modulate autophagy and cell death via regulation of the endoplasmic reticulum chaperone glucose-regulated protein 78/BiP in prostate cancer cells. Cell Death Dis. 2010; 1:e72.
31. Klionsky DJ, Abdalla FC, Abeliovich H, Abraham RT, Acevedo-Arozena A, Adeli K, Agholme L, Agnello M, Agostinis P, Aguirre-Ghiso JA, Ahn HJ, Ait-Mohamed O, Ait-Si-Ali S, Akematsu T, Akira S, Al-Younes HM, et al. Guidelines for the use and interpretation of assays for monitoring autophagy. Autophagy. 2012; 8(4):445-544.
32. Fingar DC, Richardson CJ, Tee AR, Cheatham L, Tsou C and Blenis J. mTOR controls cell cycle progression through its cell growth effectors S6K1 and 4E-BP1/eukaryotic translation initiation factor 4E. Mol Cell Biol. 2004; 24(1):200-216.
33. Zhai H, Song B, Xu X, Zhu W and Ju J. Inhibition of autophagy and tumor growth in colon cancer by miR-502. Oncogene. 2013; 32(12):1570-1579.
34. Koshiji M, Kageyama Y, Pete EA, Horikawa I, Barrett JC and Huang LE. HIF-1alpha induces cell cycle arrest by functionally counteracting Myc. EMBO J. 2004; 23(9):1949-1956.
35. Haflidadottir BS, Larne O, Martin M, Persson M, Edsjo A, Bjartell A and Ceder Y. Upregulation of miR-96 Enhances Cellular Proliferation of Prostate Cancer Cells through FOXO1. PLoS One. 2013; 8(8):e72400.
36. Vadysirisack DD and Ellisen LW. mTOR activity under hypoxia. Methods Mol Biol. 2012; 821:45-58.
37. Brugarolas J, Lei K, Hurley RL, Manning BD, Reiling JH, Hafen E, Witters LA, Ellisen LW and Kaelin WG, Jr. Regulation of mTOR function in response to hypoxia by REDD1 and the TSC1/TSC2 tumor suppressor complex. Genes Dev. 2004; 18(23):2893-2904.
38. Leontieva OV, Natarajan V, Demidenko ZN, Burdelya LG, Gudkov AV and Blagosklonny MV. Hypoxia suppresses conversion from proliferative arrest to cellular senescence. Proc Natl Acad Sci U S A. 2012; 109(33):13314-13318.
39. Schneider A, Younis RH and Gutkind JS. Hypoxia-induced energy stress inhibits the mTOR pathway by activating an AMPK/REDD1 signaling axis in head and neck squamous cell carcinoma. Neoplasia. 2008; 10(11):1295-1302.
40. Blagosklonny MV. Hypoxia, MTOR and autophagy: converging on senescence or quiescence. Autophagy. 2013; 9(2):260-262.
41. Schaefer A, Jung M, Mollenkopf HJ, Wagner I, Stephan C, Jentzmik F, Miller K, Lein M, Kristiansen G and Jung K. Diagnostic and prognostic implications of microRNA profiling in prostate carcinoma. Int J Cancer. 2010; 126(5):1166-1176.
42. Jackson AL and Linsley PS. Recognizing and avoiding siRNA off-target effects for target identification and therapeutic application. Nat Rev Drug Discov. 2010; 9(1):57-67.
43. Tsukamoto Y, Nakada C, Noguchi T, Tanigawa M, Nguyen LT, Uchida T, Hijiya N, Matsuura K, Fujioka T, Seto M and Moriyama M. MicroRNA-375 is downregulated in gastric carcinomas and regulates cell survival by targeting PDK1 and 14-3-3zeta. Cancer Res. 2010; 70(6):2339-2349.
44. Degtyarev M, De Maziere A, Orr C, Lin J, Lee BB, Tien JY, Prior WW, van Dijk S, Wu H, Gray DC, Davis DP, Stern HM, Murray LJ, Hoeflich KP, Klumperman J, Friedman LS, et al. Akt inhibition promotes autophagy and sensitizes PTEN-null tumors to lysosomotropic agents. J Cell Biol. 2008; 183(1):101-116.
45. Chang Y, Yan W, He X, Zhang L, Li C, Huang H, Nace G, Geller DA, Lin J and Tsung A. miR-375 inhibits autophagy and reduces viability of hepatocellular carcinoma cells under hypoxic conditions. Gastroenterology. 2012; 143(1):177-187 e178.
46. Klein KA, Reiter RE, Redula J, Moradi H, Zhu XL, Brothman AR, Lamb DJ, Marcelli M, Belldegrun A, Witte ON and Sawyers CL. Progression of metastatic human prostate cancer to androgen independence in immunodeficient SCID mice. Nat Med. 1997; 3(4):402-408.
47. Ma Y, Dai H, Wang L, Zhu L, Zou H and Kong X. Consent for use of clinical leftover biosample: a survey among Chinese patients and the general public. PLoS One. 2012; 7(4):e36050.
48. Ma Y, Dai H, Kong X and Wang L. Impact of thawing on reference gene expression stability in renal cell carcinoma samples. Diagn Mol Pathol. 2012; 21(3):157-163.
49. Gutierrez MG, Saka HA, Chinen I, Zoppino FC, Yoshimori T, Bocco JL and Colombo MI. Protective role of autophagy against Vibrio cholerae cytolysin, a pore-forming toxin from V. cholerae. Proc Natl Acad Sci U S A. 2007; 104(6):1829-1834.