
INTRODUCTION
Sunitinib, a small-molecule receptor tyrosine kinase inhibitor (TKI), has been approved as the first- or second-line treatment for patients with metastatic renal cell carcinoma (mRCC) [1–3]. The recommended dose and schedule for sunitinib is 50 mg each day given orally for 4 consecutive weeks followed by 2 weeks-off per treatment cycle (schedule 4/2). According to the pharmacokinetic studies, Sunitinib is converted to its active metabolite N-dehydro-sunitinib (SU12662). What’s more, SU12662 has a similar inhibitory profile to sunitinib [4, 5]. And the total active drug in plasma should be combined by sunitinib plus SU12662. Sunitinib has demonstrated favorable clinical benefits in comparison with interferon therapy [6, 7], such as better radiological response and survival.
Sunitinib’s treatment-emergent AEs were hematological toxicities, such as thrombocytopenia, neutropenia, and anemia, and non-hematological toxicities such as hand-foot syndrome (HFS), hypertension, diarrhea, fatigue, and oral mucositis [8–11]. Compared with non-Asians, Asians are more likely to develop sunitinib-induced AEs and they are also more likely to have more severe AEs [6, 12]. Thus, sunitinib treatment-emergent AEs is a serious problem that should not be ignored, especially in Asian patients.
There is emerging evidences showing that variability in sunitinib-induced toxicity between different ethnic groups may be associated with SNPs in genes related to the pharmacokinetic pathways of sunitinib in patients with RCC [13–17]. Exploratory analyses have reported the targeted candidate genes including vascular endothelial growth factor receptors (VEGFRs) 1, 2, and 3; platelet-derived growth factor receptor (PDGFR) α and β; Fms-like tyrosine kinase 3 receptor (FLT3); the receptor encoded by the ret proto-oncogene (RET); and the pharmacokinetic related genes including cytochrome P450 1A1 (CYP1A1), cytochrome P450 3A5 (CYP3A5), ATP binding cassette member G2 (ABCG2) and ATP binding cassette member B1 (ABCB1) [14, 17, 18]. However, these studies were mostly conducted in Caucasian populations in North America or Europe and very little Chinese data has been reported [19, 20].
Studying the polymorphisms in these genotypes can be helpful to maximize the clinical benefits of sunitinib and optimize the therapeutic management strategy for Chinese RCC patients. According to a pharmacodynamic and pharmacokinetic meta-analysis [21], higher sunitinib exposure is associated with longer time to progression, longer overall survival (OS), greater reduction in tumor size, and increased risk of adverse events such as fatigue, hypertension, and neutropenia. Moreover, a retrospective analysis of 521 patients with mRCC treated with sunitinib in phase II and III trials showed that those who had a dose reduction because of toxicity had a similar day 29 trough level for sunitinib and its metabolites compared with those without a dose reduction [22]. The objective of the present study was to analyze the correlation of selected SNPs present in cell-free DNA with AEs and pharmacokinetics (PK) in Chinese RCC patients by using multivariate analyses and a well estimated population PK model. The primary goal was to generate information that can be used to optimize the therapeutic management strategy for Chinese RCC patients.
RESULTS
Baseline characteristic of Chinese patients with RCC
We collected 127 blood samples from 53 RCC patients who started sunitinib-treated between March, 2014, and January, 2016. Of 53 sunitinib-treated patients with RCC, 40 (75%) were males and 13 (25%) were females (Table 1). The median age was 54 years (range: 19-71). In all, 40 sunitinib-treated patients underwent renal surgery, and 20 were observed dose reductions within 1-4 cycles.
Table 1: Characteristics of RCC patients treated with sunitinib
Characteristic |
Value (quartiles:25th and 75th percentile) |
% |
|---|---|---|
gender |
||
male |
40 |
75.47 |
female |
13 |
24.53 |
age at start sunitinib, yr |
51.65 (45, 61) |
|
BSA |
1.86 (1.74, 1.94) |
|
Prior nephrectomy |
||
yes |
40 |
75.47 |
no |
13 |
24.53 |
unknown |
||
ECOG performance status |
||
0 |
37 |
69.81 |
1 |
16 |
30.19 |
Ethnicity |
||
Chinese |
53 |
100.00 |
No. of metastatic sites |
||
1 |
24 |
45.28 |
2 |
8 |
15.09 |
≥ 3 |
11 |
20.75 |
metastatic sites |
||
lung |
19 |
35.85 |
liver |
1 |
1.89 |
bone |
4 |
7.55 |
lymph nodes |
11 |
20.75 |
brain |
1 |
1.89 |
kidney |
11 |
20.75 |
Sunitinib, daily dose, mg, in first 4 cycles |
||
50 mg |
34 |
64.15 |
37.5 mg |
8 |
15.09 |
25 mg |
11 |
20.75 |
dose reduction after cycle 1, 2 or 3 |
||
yes |
||
men |
14 |
26.42 |
women |
5 |
9.43 |
total |
19 |
35.85 |
no |
||
men |
26 |
49.01 |
women |
8 |
15.09 |
total |
34 |
64.15 |
Genetic polymorphisms analysis of Chinese patients with RCC
For each of these 8 polymorphisms, the respective genotypes and allele frequencies are given in Table 2. The SNPs were all in Hard-Weinberg equilibrium (p > 0.05). The allele frequencies of the genotyped polymorphisms were similar to those previously described elsewhere for Han Chinese in Beijing in a dbSNP database, except for SNPs rs2032582 and rs2231142. Their observed minor allele frequencies in the dbSNP database were slightly lower compared with our frequency of reportedfor rs2231142. In the case of rs2032582, there were only G and T alleles reported in the dbSNP database. However, in our study there were G, T and A alleles. The difference may because the patients that we collected were not all Han.
Table 2: Genotypes and allele frequencies of selected SNPs
Gene |
RS ID |
SNP |
No. of patients |
Genotype frequency |
Allelic frequency |
H-W equilibrium analysis |
|
|---|---|---|---|---|---|---|---|
χ2 |
p |
||||||
CYP3A4 |
rs35599367 |
N/A |
N/A |
||||
CC |
53 |
100% |
CC = 1 |
||||
CT |
|||||||
TT |
|||||||
CYP3A5 |
rs776746 |
0.78 |
0.38 |
||||
AA |
2 |
3.77% |
A = 0.25 |
||||
AG |
22 |
41.51% |
|||||
GG |
29 |
54.72% |
G = 0.75 |
||||
ABCB1 |
rs2032582 |
0.31 |
0.86 |
||||
GG |
10 |
18.87% |
G = 0.43 |
||||
GT/A |
26 |
49.06% |
T = 0.44 |
||||
AA/TT/TA |
17 |
32.08% |
A = 0.12 |
||||
ABCG2 |
rs2231142 |
0.24 |
0.62 |
||||
AA |
10 |
18.87% |
A = 0.42 |
||||
AC |
24 |
45.28% |
|||||
CC |
19 |
35.85% |
C = 0.58 |
||||
ABCB1 |
rs1128503 |
0.44 |
0.50 |
||||
CC |
3 |
5.66% |
C = 0.27 |
||||
CT |
23 |
43.40% |
|||||
TT |
27 |
50.94% |
T = 0.73 |
||||
ABCB1 |
rs1045642 |
0.44 |
0.51 |
||||
CC |
13 |
24.53% |
C = 0.47 |
||||
CT |
24 |
45.28% |
|||||
TT |
16 |
30.19% |
T = 0.53 |
||||
PDGFRA |
rs1800812 |
0.36 |
0.55 |
||||
GG |
34 |
64.15% |
G = 0.74 |
||||
TG |
16 |
30.19% |
|||||
TT |
3 |
5.66% |
T = 0.26 |
||||
FLT3 |
rs1933437 |
3.48 |
0.07 |
||||
CC |
7 |
13.21% |
C = 0.28 |
||||
CT |
16 |
30.19% |
|||||
TT |
30 |
56.60% |
T = 0.72 |
||||
Sunitinib treatment-emergent adverse events in RCC patients
Treatment-emergent adverse events (AEs) for patients who received sunitinib on schedule 4/2 were recorded. The when the analysis was limited to patients in first-line treatment only. The incidences of sunitinib treatment-emergent AEs by highest grade/severity are summarized in Table 3. These data show that 40 patients (75%) had grade 2 or grade 3 AEs, including HFS (42%), hypertension (34%), fatigue (32%), and thrombocytopenia (15%). Grade 1 or 2 AEs were a loss of appetite (35%), fatigue (32%), diarrhea (30%), hand-foot syndrome (HFS) (28%), thrombocytopenia (28%), leukopenia (24%) and hypertension (18%). No patients had grade 4 AEs. In total, 20 patients (38%) had a dose reduction due to toxicity during sunitinib treatment.
Table 3: Sunitinib treatment-emergent adverse events
Adverse events |
Toxicity grade |
No. of patients |
% of patients |
|---|---|---|---|
Thrombocytopenia |
None |
28 |
53 |
1 |
15 |
28 |
|
2 |
4 |
8 |
|
3 |
4 |
8 |
|
Leukopenia |
None |
36 |
68 |
1 |
13 |
25 |
|
2 |
0 |
0 |
|
3 |
2 |
4 |
|
Hypothyroidism |
None |
35 |
66 |
1 |
3 |
6 |
|
2 |
3 |
6 |
|
3 |
1 |
2 |
|
Diarrhea |
None |
27 |
51 |
1 |
16 |
30 |
|
2 |
7 |
13 |
|
3 |
1 |
2 |
|
Fatigue |
None |
17 |
32 |
1 |
17 |
32 |
|
2 |
16 |
30 |
|
3 |
1 |
2 |
|
A loss of appetite |
None |
31 |
58 |
1 |
19 |
36 |
|
2 |
1 |
2 |
|
3 |
0 |
0 |
|
Hand-foot syndrome |
None |
13 |
25 |
1 |
15 |
28 |
|
2 |
17 |
32 |
|
3 |
5 |
9 |
|
Hypertension |
None |
23 |
43 |
1 |
10 |
19 |
|
2 |
7 |
13 |
|
3 |
11 |
21 |
Dose reduction, total trough level (TTL) and AEs study of sunitinib in RCC patients
We enrolled and analyzed data from 40 sunitinib-treated patients with RCC who had reached a steady state concentration. A steady-state concentration is considered representative of the entire measurement period, measured after 14 days of sunitinib treatment was used in our study. Among the 40 sunitinib-treated patients, 18 (45%) had a dose reduction because of sunitinib treatment-emergent severity AEs, primarily hematological. Therefore, 22 patients were consistently administered sunitinib at a dose of 50 mg per day. The median TTL among these patients who had grade ≥ 3 AEs was 140.81 (51.80–206.30) compared with 109.24 (54.31–199.74) ng/mL of the patients who had AEs of grade < 3 (p = 0.01). In 10 sunitinib-treated patients who had severe toxicity, the sunitinib administration dose was reduced to 37.5 mg per day. In these patients, the median TTL among those with grade ≥ 3 AEs was 114.49 (84.23–123.29) vs 107.60 (73.67–254.55) ng/mL among the other patients (p = 0.03). Moreover, 8 patients had a dose reduction to 25 mg per day and among these the median TTL of the patients who had grade ≥ 3 AEs was 77.02 (53.60–82.62) vs 61.90 (57.17–62.82) ng/mL among the other patients (Figure 1 and Supplementary Table 1). t test results of the two independent samples of various doses are shown in Table 4. And a general classification of samples in terms of whether the sample had reached the steady state concentration are shown in Supplementary Table 4.
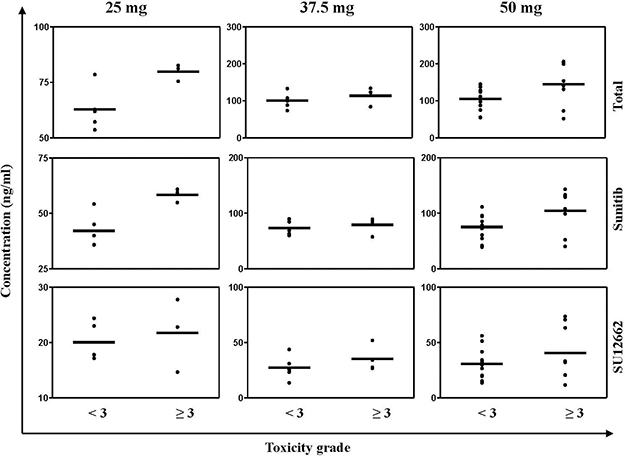
Figure 1: Steady state plasma concentration (Css) of sunitinib, SU12662 and (sunitinib + SU12662) of all patients who were treated by sunitinib. The black bars represent the median Css.
Table 4: T test result of the two independent samples of various doses
Con. (ng/mL) |
Toxicity grade |
25 mg |
37.5 mg |
50 mg |
|||
|---|---|---|---|---|---|---|---|
mean ± SD |
p |
mean ± SD |
p |
mean ± SD |
p |
||
TTL |
< 3 |
62.81 ± 9.56 |
0.45 |
100.76 ± 19.91 |
0.03* |
105.53 ± 30.80 |
0.06 |
≥ 3 |
80.11 ± 4.00 |
114.00 ± 21.39 |
145.10 ± 59.11 |
||||
Sunitinib |
< 3 |
42.20 ± 7.67 |
0.18 |
72.78 ± 11.70 |
0.09 |
75.22 ± 21.56 |
0.07 |
≥ 3 |
58.37 ± 3.13 |
78.91 ± 14.56 |
104.45 ± 38.77 |
||||
SU12662 |
< 3 |
20.02 ± 3.39 |
0.26 |
27.99 ± 10.05 |
0.08 |
30.70 ± 12.93 |
0.01** |
≥ 3 |
21.73 ± 6.62 |
35.09 ± 11.70 |
40.65 ± 24.71 |
*p < 0.05 means statistically difference, **p < 0.01 means statistically significant difference.
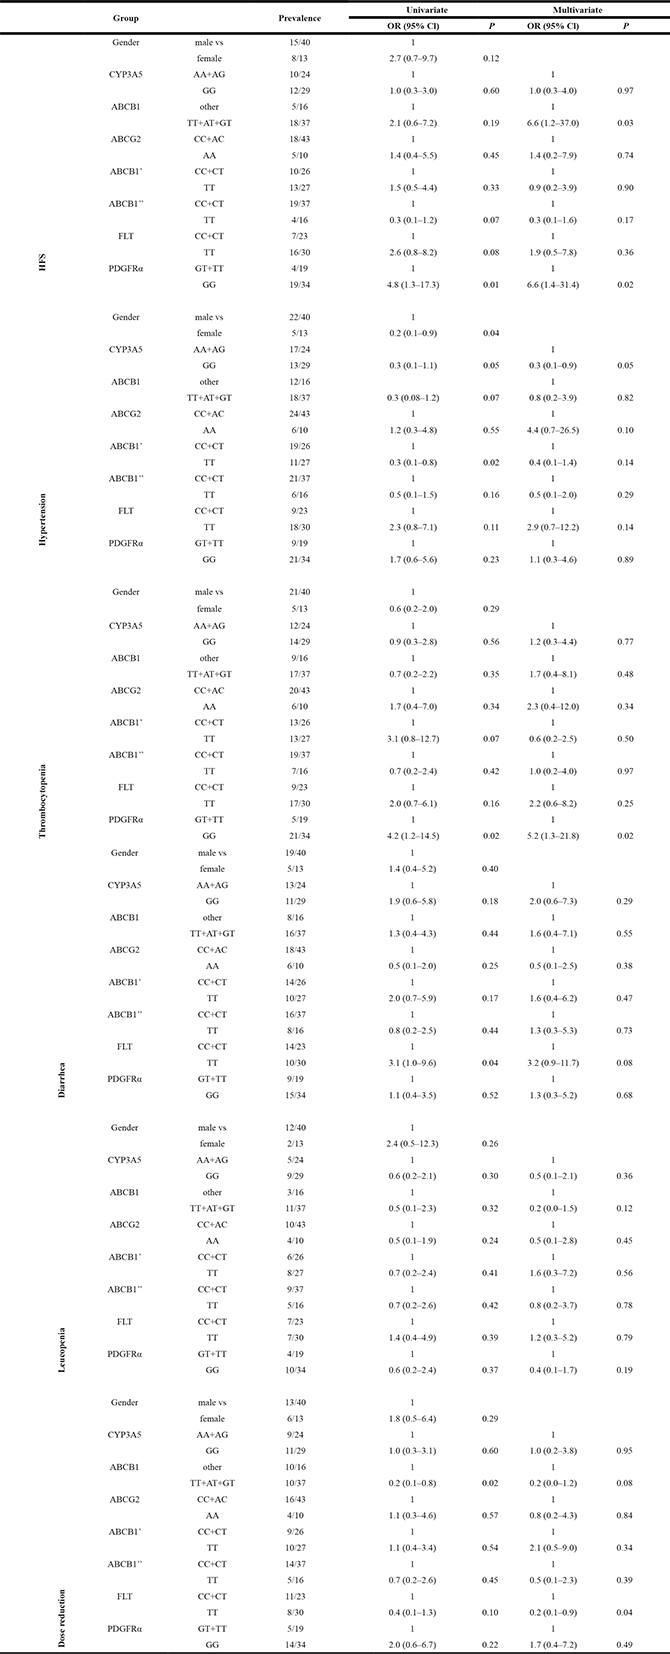
Association between SNPs and AEs
Next, we identified SNPs associated with sunitinib-related toxicity. The univariate and multivariate logistic regression analyses for correlations between each of the genotyped SNPs and toxicity are listed in Table 5. In the multivariate analysis, SNP rs2032582 in ABCB1 2677 TT, AT or GT genotypes and rs1800812 in PDGFRα GG genotype were significantly correlated with grade 2 and grade 3 HFS (odds ratio [OR] 6.6, 95% confidence interval [CI] 1.2–37, p = 0.03; OR 6.6, 95% CI 1.4–31.4, p = 0.02; respectively). SNP rs1800812 in PDGFRα GG carriers was significantly more frequent in patients with thrombocytopenia (OR 5.2, 95% CI 1.3–21.8, p = 0.02). SNP rs776746 in CYP3A5 GG were less likely to experience hypertension when compared with the AA or AG carriers (OR 0.3, 95% CI 0.1–0.9, p = 0.05). It is noteworthy that the FLT 738 TT carriers required fewer dose reductions (OR: 0.2; 95% CI, 0.1–0.9, p = 0.04).
Table 5: Univariate and multivariate analyses: association between SNPs and toxicity
The effect of SNPs present in cell-free DNA on the population PK of sunitinib in RCC patients
In order to maximize the clinical benefits of sunitinib, an effective therapeutic management strategy with dose optimization is essential. The objective of this analysis was to describe the PK of sunitinib by a population PK approach using the collected 127 PK samples and to quantitatively evaluate the effect of potential predictive factors, including ABCB1 genotype, on the PK of sunitinib. A one-compartment model for sunitinib was structured as schematically shown in Supplementary Figure 1. The base PK model was designed based on objective function values. The final model for the sunitinib molecule was a one-compartment model with first-order adsorption. CL/F and Vd/F were estimated to be 21719 mL/h and 112753 mL. −2LL was 982. No covariates (BW, age, sex and SNPs) had a relationship with Vd/F and CL/F parameters. Sunitinib and SU12662 were modeled simultaneously. BW and the ABCB1 rs2032582 (Z3) genotypes of SU12662 had a remarkable effect on apparent clearance of SU12662. Sex, age and other genotypes did not affect sunitinib pharmacokinetics. Values of the parameter estimates for the base model and final model of sunitinib are shown in Table 6. The final regression model is shown in the following equation (final equation):
Table 6: Values of parameter estimates of sunitinib
Parameter |
Estimate |
CV% |
Shrinkage |
|---|---|---|---|
Base model |
|||
tvKa (h-1) |
0.0119567 |
10.9 |
-- |
tvV/F (mL) |
112753 |
20.7 |
-- |
tvCl/F (mL/h) |
21719 |
4.75 |
-- |
tvCMultStdev |
0.324902 |
7.89 |
-- |
stdev0 |
7.40642 |
22.90 |
-- |
Final model |
|||
tvKa (h-1) |
0.0117 |
11.4 |
0.386 |
tvV (mL) |
99438 |
43.4 |
0.773 |
tvV2 (mL) |
916641 |
50.7 |
0.975 |
tvClp (mL/h) |
24576 |
6.21 |
0.317 |
tvClm (mL/h) |
53614 |
9.9 |
0.163 |
tvCMultStdev |
0.31 |
13 |
|
tvC2MultStdev |
0.242 |
14.5 |
|
dClmdBW |
0.538 |
63.7 |
|
dClmdZ31 |
0.314 |
60.5 |
|
dClmdZ32 |
0.269 |
68.4 |
|
dClmdZ33 |
0.308 |
62.1 |
|
dClmdZ34 |
0.0368 |
19.8 |
|
dClmdZ35 |
0.0456 |
7.58 |
|
stdev0 |
0.0751 |
12.9 |
|
stdev1 |
1.23 |
37.5 |
CLm/F = 53614 × (weight (kg)/68.3)0.538 × (1 – 0.314 × (Z3 = 1)) × (1 – 0.269 × (Z3 = 2) × (1 – 0.308 × (Z3 = 3)) × (1 – 0.0368 × (Z3 = 4)) × (1 – 0.0456 × (Z3 = 5))
When Z3 = 0 for AT, 1 for TG, 2 for GG, 3 for TT, 4 for AG, and 5 for GT
(final equation)
CLm/F was represent for the the apparent volume of the central compartment cleared of drug per unit time was estimated using the formula (and m represent for the metabolite SU12662). Z3 was represent for ABCB1 rs2032582.
To test the goodness-of-fit of the final model, plots were generated including CWRES versus PRED, DV versus PRED and DV versus IPRED (Figure 2). These plots show the goodness of fit of the final model. Bootstrap analysis results are shown in Table 7. And the VPC results are shown in Supplementary Figure 1 and Supplementary Figure 2. The population pharmacokinetic parameter estimates of the final models were similar in the median of the parameters estimated during the bootstrap process and the 95% confidence intervals largely overlapped for the pharmacokinetic parameters of the sunitinib models.
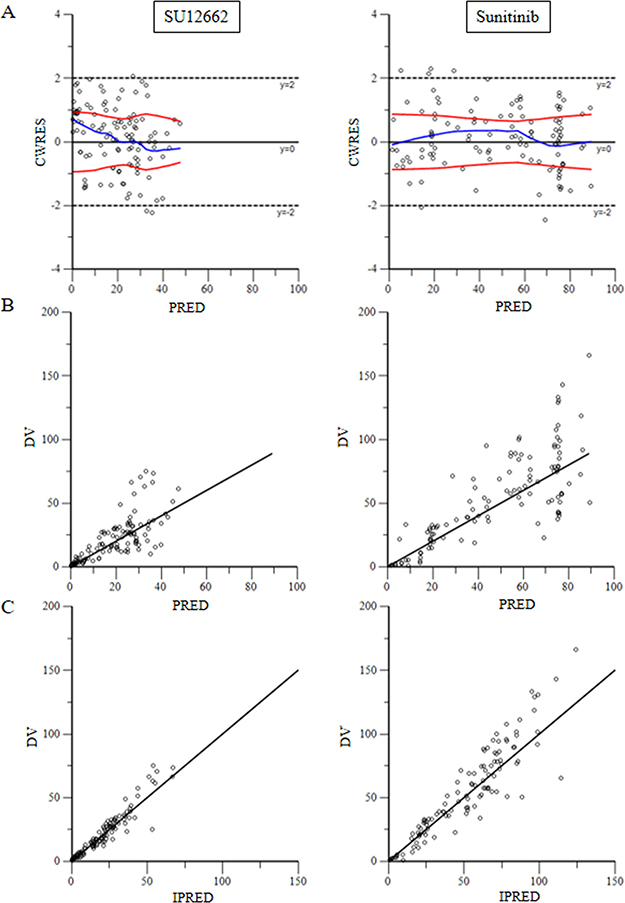
Figure 2: (A) for plots of predicted variable in the x-axis and CWRES (Conditional Weighted Residuals) in the y-axis. (B) for plots of dependent variable in the x-axis and predicted variable in the y-axis. (C) for scatter plot of the dependent variable (DV, concentrations for PK models) versus individual predicted values (IPRED, predicted concentrations).
Table 7: Bootstrap results
Parameter |
Estimate |
CV% |
BootStrap Median |
BootStrap 95% CI |
|---|---|---|---|---|
tvKa (h-1) |
0.0117 |
11.4 |
0.0117 |
[0.00892, 0.0140] |
tvV (mL) |
99438 |
43.4 |
101263 |
[4459, 191880] |
tvV2 (mL) |
916641 |
50.7 |
928793 |
[415037, 1569500] |
tvClp (mL/h) |
24576 |
6.21 |
24175 |
[21769, 27036] |
tvClm (mL/h) |
53614 |
9.9 |
53331 |
[39962, 64261] |
tvCMultStdev |
0.31 |
13 |
0.277 |
[0.169, 0.338] |
tvC2MultStdev |
0.242 |
14.5 |
0.24 |
[0.194, 0.315] |
dClmdBW |
0.538 |
63.7 |
0.658 |
[0.00691, 1.41] |
dClmdZ31 |
0.314 |
60.5 |
0.301 |
[0.00247, 0.929 |
dClmdZ32 |
0.269 |
68.4 |
0.233 |
[0.00200, 0.927] |
dClmdZ33 |
0.308 |
62.1 |
0.318 |
[0.000875, 0.891 |
dClmdZ34 |
0.0368 |
19.8 |
0.0537 |
[0.00581, 0.860] |
dClmdZ35 |
0.0456 |
7.58 |
0.0502 |
[0.0267, 0.320] |
stdev0 |
0.0751 |
12.9 |
0.127 |
[0.0000526, 6.33] |
stdev1 |
1.23 |
37.5 |
1.09 |
[0.00464, 1.61] |
DISCUSSION
We analyzed the association between sunitinib-induced AEs, SNPs, and PK in Chinese RCC patients treated with sunitinib. CYP3A4 and CYP3A5 are the main enzymes involved in the metabolism of sunitinib [9, 23], ABCB1 and ABCG2 are believed considered to participate in the absorption of sunitinib [24], and PDGFR and FLT are the two of the most important targets of sunitinib [23, 25]. Gene polymorphisms in these enzymes may have a significant impact on the efficacy and adverse reactions of sunitinib.
In our study, we found that 45% of Chinese RCC patients underwent dose reduction because of AEs of sunitinib. The percent of dose reduction was higer than the Caucasian population [26–29], and lower the Japanese and Koreans population [6, 24, 28]. When compared to a multicenter study research data [30, 31], the frequency of HFS, hypertension and hypothyroidism in Chinese RCC patients is clearly higher than in other countries. Our study also found that patients with grade 3 AEs had a higher plasma level of sunitinib or SU12662 than patients without grade 3 AEs. but these findings suggest an exposure-toxicity relationship of sunitinib. Interestingly, this finding was consistent with a prospective study that conducted among Australia patients [32].
Although the relationship between SNP and AE of sunitinib has been reported in other studies, there are few research about Chinese sunitinib-treated patients. In our study, we found that a higher severity of AEs were collected with SNP rs2032582 in ABCB1. ABCB1 genotype as a predictive covariate for apparent oral clearance of sunitinib. These results are consistent with previously reported data [13, 33–35]. However, we did not find the variant ABCG2 421C > A is suggestively associated with severe thrombocytopenia, this was different with Low SK finding [36]. More interestingly, we firstly demonstrated that necessary dose reductions of sunitinib were significantly correlated with SNP rs1933437 in FLT. Thrombocytopenia was collected with rs1800812 in PDGFRα. A higher severity of AEs (grade ≥ 2 hand-foot syndrome) was collected with rs1800812 in PDGFRα.
A population approach was used to assess the PK of sunitinib and its active metabolite SU12662, and to identify covariates that might explain variability in exposure following oral administration. The model was different with other literature [26]. This might because of the sparse time-point samples. Therefore, if possible, more plasma samples from each patients should be collected before and after oral administration, especially after administration. and more studies need to be conducted.
Many researchers have reported on the relationship between SNPs and AEs of sunitinib [3, 27, 37, 38], and many researchers have reported on the association between PK and AEs of sunitinib [39–42]. However, very few studies about the relationship between SNPs, PK and AEs have been reported for Chinese RCC patients treated with sunitinib.
The population pharmacokinetic model we established, was to quantitate the covariate influence on pharmacokinetic parameters. Due to the small sample size, the result could not service for clinical directly, but could provide a scientific basis for individualized treatment, and provide a methodology reference for the similar drugs.
CONCLUSIONS
Our study preliminarily confirmed the hypothesis that the PK of sunitinib is affected by enzyme polymorphisms in Chinese RCC patients treated with sunitinib, and this affects the different distribution and severity of AEs of sunitinib.
MATERIALS AND METHODS
Study population and clinical collection
We consecutively enrolled histologically confirmed RCC patients who were treated with sunitinib and were available for PK analysis and genetic analysis from March 2014 at Academy of Military Medical Sciences Affiliated Hospital, Beijing, China. Demographic and clinical data of patients were collected from the review of electronic medical records. Patient characteristics considered relevant for sunitinib toxicity were as follows age, sex, BSA, Eastern Cooperative Oncology Group (ECOG) performance status, histologic type, and organ function.
Study design
Sunitinib was administered orally as a single agent at a dosage of 50 mg daily for 4 weeks followed by a 2-week off period (schedule 4/2) until progression or intolerable toxicity occurred. Dose reductions of sunitinib were allowed depending on the type and severity of AEs. All adverse effects were graded by the attending doctors according to National Cancer Institute-Common Terminology Criteria for Adverse Events v. 3.0 (CTCAE 3.0).
On the basis of clinical relevance and grading objectiveness, we analyzed sunitinib treatment-emergent AEs, including HFS, hypertension, diarrhea, fatigue, a loss of appetite, leukopenia, and thrombocytopenia. Data on dose reductions were documented for the first four cycles of sunitinib treatment. We also recorded adverse toxic events leading to dose reductions and the date on which they occurred.
This study was conducted in accordance with Good Clinical Practice and under the ethical principles established by the Declaration of Helsinki. Each protocol was reviewed and approved by the Institutional Review Board of the Academy of Military Medical Sciences Affiliated Hospital, and all patients gave written informed consent.
Sunitinib pharmacokinetic analysis
Samples for PK analysis were collected at day 15 ± 1 after sunitinib treatment. Blood samples were drawn into 2 mL EDTA vacutainer tubes and, thereafter, directly sent to the laboratory, after centrifugation at 1500 xg for 5 minutes at 4°C, plasma was transferred to propylene tubes and stored at –70°C until assay of plasma. Sunitinib concentrations in plasma were determined using a validated method. Supplementary Table 2 summarizes the intra and inter-day precision and accuracy values for the QC samples. The intra- and inter-day precisions for sunitinib were < 1.64%, while accuracy was within ±5.69%. The intra- and inter-day precisions for SU12662 were < 12.4%, while accuracy was within ±12.74%.The accuracy and precision data indicate that method is reliable and reproducible.
DNA isolation and analysis of polymorphisms
Free-circulating DNA was isolated from 1 mL plasma using a QIAamp Circulating Nucleic Acid Kit (Qiagen, Hilden, Germany) according to the manufacturer’s protocol. Prior to analysis, DNA concentrations were measured using amicroplate reader (Biotek, Vermont, American). Genotyping was performed with an ABI 3730xl DNA Analyzer (Applied Biosystems) using a LifePro Thermal Cycler (Hangzhou Bioer Technology Co., Ltd.). The primer sequences information was shown in Supplementary Table 3.
Six polymorphisms in four genes involved in general pharmacokinetics and others involved in the pharmacodynamics of sunitinib were selected for analysis based on the functionality evidence and clinical relevance reported by previous studies [3, 25, 43]. We genotyped 8 SNPs in 6 candidate genes, CYP3A4 (rs35599367), CYP3A5 (rs776746), ABCB1 (rs1045642, rs1128503 and rs2032582), ABCG2 (rs2231142), PDGFRα (rs1800812), and FLT3 (rs1933437).
Population PK study
Model development
Population PK analysis was performed using Pheonix (version 1.4) with (nonlinear mixed effect modeling) NLME. First order conditional estimates (FOCE) were applied for all estimations. Interindividual variability was assessed using an exponential variability model for continuous covariates (body weight and age) (Equation 1) and a linear proportional model for categorical covariates (Equation 2).
Pi = Ppop × exp (ηi) (1)
Pi = Ppop × (1 + ηi) (2)
Where Pi represents the value of the PK parameter for the ith individual, Ppop is the population mean for P and η is an interindividual random effect with a mean of zero and variance of ω2. Residual unexplained variability was evaluated using a combined proportional and additive error model (Equation 3).
CObs = C + CEps + C*CEps*CMixRatio (3)
Where CEps represents the additive error and Ceps *CmixRatio is the proportional error. All compartment models were parameterized in terms of values of apparent oral clearance (CL/F), volume of distribution (Vd/F) and absorption rate constant (Ka). The models were assessed and selected based on goodness of fit and a variety of criteria including physiological plausibility and stability. Comparative evaluation among the covariate models was based on the −2*Log (likelihood) (−2LL). A decrease in −2LL of 3.84 (p < 0.05 assuming a X2 distribution) was considered to be significant for the forward addition and 6.63 (p < 0.01) for the backward elimination. The models were also compared using the Akaike information criterion (AIC = −2LL + (2 × nParm)) to discriminate between nonhierarchical models in the selection of a structural model.
Patient characteristics, including body weight, sex, age and genotype were evaluated as covariates. An exploratory analysis was used to assess the relationships between PK parameters and covariates by visually inspecting plots of the empirical Bayesian estimates. Body weight (BW) and age were evaluated as covariates by applying allometric scaling to CL/F and Vd/F as described in equation 4:
Pi = Pop × (BW or age/the average of BW or age)power (4)
Where the average BW was 68.3 kg and the average age was 52. Categorical covariates, such as sex and genotype were assessed with a linear proportional model. Covariates were added into the base model using a forward stepwise inclusion approach until there was no further decrease in -2LL. Covariates were then removed from the model using a backward stepwise approach.
Model evaluation
The following diagnostic plots were used to evaluate the models: dependent variable (observed value) (DV) versus population predicted value (PRED), DV versus individual predicted value, conditional weighted residuals (CWRES) versus PRED, and CWRES versus time after the dose, to identify bias corresponding to model miss-specification. η-shrinkage was evaluated by post hoc Bayesian estimates-based diagnostic method. The final model was evaluated using nonparametric bootstrap analysis and visual predictive check (VPC). A thousand bootstrap runs were generated by random resampling using the original data set. Standard errors of population parameter estimates and random effects error models were also evaluated.
Statistical analysis
Two independent samples t test was used to compare the steady state concentration of each dose group between the different severity of adverse reaction, when p < 0.05, indicating a significant difference. Genotype frequencies at each locus were tested for Hardy-Weinberg equilibrium using a χ2 test. For toxicity analysis, baseline corrected toxicity scores were calculated by subtracting baseline values from the maximum recorded score in four cycles of treatment, and the HFS toxicity end point was dichotomised as higher than grade 1 (yes or no). The other toxicity end point was dichotomised as happened versus unhappened. The end-point dose reduction was dichotomised as any dose reduction within cycle 1-4 or no dose reduction. Genotype associations with toxicity events were first analyzed using univariate and multivariate logistic regression. For multivariate analyses, associations with p ≤ 0.05 were considered significant. Statistical analyses were performed using SPSS19.0 software (IBM Corp., Armonk, NY, USA).
All the result of plasma concentrations of sunitinib and the active metabolite and the patient characteristic that corrected from this study were used in the population PK study, and weight, sex, age and genotypes were included as covariates. Population pharmacokinetics study was performed using Phoenix software (Version1.4, Pharsight, A Certara Company, USA).
Abbreviations
SNP, single-nucleotide polymorphisms; SU12662, N-desethyl sunitinib; mRCC, metastatic renal cell carcinoma; HFS, hand-foot syndrome; VEGFRs, vascular endothelial growth factor receptors; PDGFR, platelet-derived growth factor receptor; FLT3, Fms-like tyrosine kinase 3 receptor; RET, receptor encoded by the ret proto-oncogene; CYP1A1, pharmacokinetic related genes including cytochrome P450 1A1, CYP3A5, cytochrome P450 3A5; ABCG2, ATP binding cassette member G2; ABCB1, ATP binding cassette member B1; cfDNA, cell free DNA; AEs, adverse events.
Author contributions
HQ and YZ conceived and designed the experiments. YZ, HM and GG performed the experiments. YZ and HQ analyzed the data and wrote the final version of this paper. All authors approved the final manuscript.
ACKNOWLEDGMENTS AND FUNDING
This work was supported by a grant from the Application Research of Clinical Features in Capital City, China (Z151100004015010) We would like to acknowledge Mr. Changmai Chen for his constructive criticism and for his help with improving the quality of the manuscript.
CONFLICTS OF INTEREST
The authors declare no conflicts of interest.
REFERENCES
1. Montero AJ, Kwon D, Flores A, Kovacs K, Trent JC, Benedetto P, Rocha-Lima C, Merchan JR. A Phase I Clinical, Pharmacokinetic, and Pharmacodynamic Study of Weekly or Every Three Week Ixabepilone and Daily Sunitinib in Patients with Advanced Solid Tumors. Clin Cancer Res. 2016; 22:3209–3217.
2. Carlisle B, Demko N, Freeman G, Hakala A, MacKinnon N, Ramsay T, Hey S, London AJ, Kimmelman J. Benefit, Risk, and Outcomes in Drug Development: A Systematic Review of Sunitinib. J Natl Cancer Inst. 2016; 108.
3. Diekstra MH, Swen JJ, Boven E, Castellano D, Gelderblom H, Mathijssen RH, Rodriguez-Antona C, Garcia-Donas J, Rini BI, Guchelaar HJ. CYP3A5 and ABCB1 polymorphisms as predictors for sunitinib outcome in metastatic renal cell carcinoma. Eur Urol. 2015; 68:621–629.
4. Bello C, Bu HZ, Patyna S, Kang P, Peng G, Pool W, Smeraglia J, Sherman L, Garrett M, Klamerus K. A phase I mass-balance study to evaluate the metabolism and excretion of [14C]-sunitinib (SU11248) in healthy male subjects. Cancer Research. 2007; 67:LB-354.
5. Sakamoto KM. Su-11248 Sugen. Curr Opin Investig Drugs. 2004; 5:1329–1339.
6. Lee SH, Bang YJ, Mainwaring P, Ng C, Chang JW, Kwong P, Li RK, Sriuranpong V, Toh CK, Yuan J, Pitman Lowenthal S, Chung HC. Sunitinib in metastatic renal cell carcinoma: an ethnic Asian subpopulation analysis for safety and efficacy. Asia Pac J Clin Oncol. 2014; 10:237–245.
7. Thomas A, Rajan A, Berman A, Tomita Y, Brzezniak C, Lee MJ, Lee S, Ling A, Spittler AJ, Carter CA, Guha U, Wang Y, Szabo E, et al. Sunitinib in patients with chemotherapy-refractory thymoma and thymic carcinoma: an open-label phase 2 trial. Lancet Oncol. 2015; 16:177–186.
8. Kalantari HR. Predictive factors for severe toxicity of sunitinib in unselected patients with advanced renal cell cancer. Br J Cancer. 2009; 101:1222–1223; author reply 1224.
9. Faivre S, Delbaldo C, Vera K, Robert C, Lozahic S, Lassau N, Bello C, Deprimo S, Brega N, Massimini G, Armand JP, Scigalla P, Raymond E. Safety, pharmacokinetic, and antitumor activity of SU11248, a novel oral multitarget tyrosine kinase inhibitor, in patients with cancer. J Clin Oncol. 2006; 24:25–35.
10. Escudier B, Porta C, Bono P, Powles T, Eisen T, Sternberg CN, Gschwend JE, De Giorgi U, Parikh O, Hawkins R, Sevin E, Negrier S, Khan S, et al. Randomized, controlled, double-blind, cross-over trial assessing treatment preference for pazopanib versus sunitinib in patients with metastatic renal cell carcinoma: PISCES Study. J Clin Oncol. 2014; 32:1412–1418.
11. Atkins MB, Gravis G, Drosik K, Demkow T, Tomczak P, Wong SS, Michaelson MD, Choueiri TK, Wu B, Navale L, Warner D, Ravaud A. Trebananib (AMG 386) in Combination With Sunitinib in Patients With Metastatic Renal Cell Cancer: An Open-Label, Multicenter, Phase II Study. J Clin Oncol. 2015; 33:3431–3438.
12. Kim HS, Hong MH, Kim K, Shin SJ, Ahn JB, Jeung HC, Chung HC, Koh Y, Lee SH, Bang YJ, Rha SY. Sunitinib for Asian patients with advanced renal cell carcinoma: a comparable efficacy with different toxicity profiles. Oncology. 2011; 80:395–405.
13. Beuselinck B, Karadimou A, Lambrechts D, Claes B, Wolter P, Couchy G, Berkers J, Paridaens R, Schöffski P, Méjean A. Single-nucleotide polymorphisms associated with outcome in metastatic renal cell carcinoma treated with sunitinib. British Journal of Cancer. 2013; 108:887–900.
14. van Erp NP, Eechoute K, van der Veldt AA, Haanen JB, Reyners AK, Mathijssen RH, Boven E, van der Straaten T, Baak-Pablo RF, Wessels JA, Guchelaar HJ, Gelderblom H. Pharmacogenetic pathway analysis for determination of sunitinib-induced toxicity. J Clin Oncol. 2009; 27:4406–4412.
15. Junker K, Ficarra V, Kwon ED, Leibovich BC, Thompson RH, Oosterwijk E. Potential role of genetic markers in the management of kidney cancer. Eur Urol. 2013; 63:333–340.
16. Fiszer A, Krzyzosiak WJ. Oligonucleotide-based strategies to combat polyglutamine diseases. Nucleic Acids Res. 2014; 42:6787–6810.
17. Narjoz C, Cessot A, Thomas-Schoemann A, Golmard JL, Huillard O, Boudou-Rouquette P, Behouche A, Taieb F, Durand JP, Dauphin A, Coriat R, Vidal M, Tod M, et al. Role of the lean body mass and of pharmacogenetic variants on the pharmacokinetics and pharmacodynamics of sunitinib in cancer patients. Invest New Drugs. 2015; 33:257–268.
18. Zhu AX, Duda DG, Ancukiewicz M, di Tomaso E, Clark JW, Miksad R, Fuchs CS, Ryan DP, Jain RK. Exploratory analysis of early toxicity of sunitinib in advanced hepatocellular carcinoma patients: kinetics and potential biomarker value. Clin Cancer Res. 2011; 17:918–927.
19. Basch E, Loblaw DA, Oliver TK, Carducci M, Chen RC, Frame JN, Garrels K, Hotte S, Kattan MW, Raghavan D, Saad F, Taplin ME, Walker-Dilks C, et al. Systemic therapy in men with metastatic castration-resistant prostate cancer:American Society of Clinical Oncology and Cancer Care Ontario clinical practice guideline. J Clin Oncol. 2014; 32:3436–3448.
20. Lopez-Chavez A, Thomas A, Rajan A, Raffeld M, Morrow B, Kelly R, Carter CA, Guha U, Killian K, Lau CC, Abdullaev Z, Xi L, Pack S, et al. Molecular profiling and targeted therapy for advanced thoracic malignancies: a biomarker-derived, multiarm, multihistology phase II basket trial. J Clin Oncol. 2015; 33:1000–1007.
21. Houk BE, Bello CL, Poland B, Rosen LS, Demetri GD, Motzer RJ. Relationship between exposure to sunitinib and efficacy and tolerability endpoints in patients with cancer: results of a pharmacokinetic/pharmacodynamic meta-analysis. Cancer Chemother Pharmacol. 2010; 66:357–371.
22. Tannir NM, Plimack E, Ng C, Tamboli P, Bekele NB, Xiao L, Smith L, Lim Z, Pagliaro L, Araujo J, Aparicio A, Matin S, Wood CG, et al. A phase 2 trial of sunitinib in patients with advanced non-clear cell renal cell carcinoma. Eur Urol. 2012; 62:1013–1019.
23. Diekstra MH, Klumpen HJ, Lolkema MP, Yu H, Kloth JS, Gelderblom H, van Schaik RH, Gurney H, Swen JJ, Huitema AD, Steeghs N, Mathijssen RH. Association analysis of genetic polymorphisms in genes related to sunitinib pharmacokinetics, specifically clearance of sunitinib and SU12662. Clin Pharmacol Ther. 2014; 96:81–89.
24. Mizuno T, Fukudo M, Fukuda T, Terada T, Dong M, Kamba T, Yamasaki T, Ogawa O, Katsura T, Inui K. The effect of ABCG2 genotype on the population pharmacokinetics of sunitinib in patients with renal cell carcinoma. Therapeutic Drug Monitoring. 2014; 36:310.
25. Chu YH, Li H, Tan HS, Koh V, Lai J, Phyo WM, Choudhury Y, Kanesvaran R, Chau NM, Toh CK, Ng QS, Tan PH, Chowbay B, et al. Association of ABCB1 and FLT3 Polymorphisms with Toxicities and Survival in Asian Patients Receiving Sunitinib for Renal Cell Carcinoma. PLoS One. 2015; 10:e0134102.
26. Houk BE, Bello CL, Kang D, Amantea M. A population pharmacokinetic meta-analysis of sunitinib malate (SU11248) and its primary metabolite (SU12662) in healthy volunteers and oncology patients. Clin Cancer Res. 2009; 15:2497–2506.
27. Garcia-Donas J, Esteban E, Leandro-Garcia LJ, Castellano DE, del Alba AG, Climent MA, Arranz JA, Gallardo E, Puente J, Bellmunt J, Mellado B, Martinez E, Moreno F, et al. Single nucleotide polymorphism associations with response and toxic effects in patients with advanced renal-cell carcinoma treated with first-line sunitinib: a multicentre, observational, prospective study. Lancet Oncol. 2011; 12:1143–1150.
28. Motzer RJ, Hutson TE, Tomczak P, Michaelson MD, Bukowski RM, Oudard S, Negrier S, Szczylik C, Pili R, Bjarnason GA, Garcia-del-Muro X, Sosman JA, Solska E, et al. Overall survival and updated results for sunitinib compared with interferon alfa in patients with metastatic renal cell carcinoma. J Clin Oncol. 2009; 27:3584–3590.
29. Gao B, Yeap S, Clements A, Balakrishnar B, Wong M, Gurney H. Evidence for therapeutic drug monitoring of targeted anticancer therapies. J Clin Oncol. 2012; 30:4017–4025.
30. Haas NB, Manola J, Uzzo RG, Flaherty KT, Wood CG, Kane C, Jewett M, Dutcher JP, Atkins MB, Pins M, Wilding G, Cella D, Wagner L, et al. Adjuvant sunitinib or sorafenib for high-risk, non-metastatic renal-cell carcinoma (ECOG-ACRIN E2805): a double-blind, placebo-controlled, randomised, phase 3 trial. Lancet. 2016; 387:2008–2016.
31. Motzer RJ, Rini BI, Bukowski RM, Curti BD, George DJ, Hudes GR, Redman BG, Margolin KA, Merchan JR, Wilding G, Ginsberg MS, Bacik J, Kim ST, et al. Sunitinib in patients with metastatic renal cell carcinoma. Jama. 2006; 295:2516–2524.
32. Lankheet NA, Kloth JS, Gadellaa-van Hooijdonk CG, Cirkel GA, Mathijssen RH, Lolkema MP, Schellens JH, Voest EE, Sleijfer S, de Jonge MJ, Haanen JB, Beijnen JH, Huitema AD, et al. Pharmacokinetically guided sunitinib dosing: a feasibility study in patients with advanced solid tumours. Br J Cancer. 2014; 110:2441–2449.
33. Beuselinck B, Lambrechts D, Van BT, Wolter P, Cardinaels N, Joniau S, Lerut E, Karadimou A, Couchy G, Sebe P. Efflux pump ABCB1 single nucleotide polymorphisms and dose reductions in patients with metastatic renal cell carcinoma treated with sunitinib. Acta Oncologica. 2014; 53:1–10.
34. Chae JW, Teo YL, Ho HK, Lee J, Back HM, Yun HY, Karlsson MO, Kwon KI, Chan A. BSA and ABCB1 polymorphism affect the pharmacokinetics of sunitinib and its active metabolite in Asian mRCC patients receiving an attenuated sunitinib dosing regimen. Cancer Chemotherapy & Pharmacology. 2016; 78:1–10.
35. Numakura K, Tsuchiya N, Kagaya H, Takahashi M, Tsuruta H, Inoue T, Narita S, Huang M, Satoh S, Niioka T. Clinical effects of single nucleotide polymorphisms on drug-related genes in Japanese metastatic renal cell carcinoma patients treated with sunitinib. Anticancer drugs. 2017; 28:1.
36. Low SK, Fukunaga K, Takahashi A, Matsuda K, Hongo F, Nakanishi H, Kitamura H, Inoue T, Kato Y, Tomita Y. Association Study of a Functional Variant on ABCG2 Gene with Sunitinib-Induced Severe Adverse Drug Reaction. Plos One. 2016; 11:e0148177.
37. Motzer RJ, Hutson TE, Hudes GR, Figlin RA, Martini JF, English PA, Huang X, Valota O, Williams JA. Investigation of novel circulating proteins, germ line single-nucleotide polymorphisms, and molecular tumor markers as potential efficacy biomarkers of first-line sunitinib therapy for advanced renal cell carcinoma. Cancer Chemother Pharmacol. 2014; 74:739–750.
38. Miura Y, Imamura CK, Fukunaga K, Katsuyama Y, Suyama K, Okaneya T, Mushiroda T, Ando Y, Takano T, Tanigawara Y. Sunitinib-induced severe toxicities in a Japanese patient with the ABCG2 421 AA genotype. BMC Cancer. 2014; 14:964.
39. Gan HK, Seruga B, Knox JJ. Sunitinib in solid tumors. Expert Opin Investig Drugs. 2009; 18:821–834.
40. Noda S, Otsuji T, Baba M, Yoshida T, Kageyama S, Okamoto K, Okada Y, Kawauchi A, Onishi H, Hira D, Morita SY, Terada T. Assessment of Sunitinib-Induced Toxicities and Clinical Outcomes Based on Therapeutic Drug Monitoring of Sunitinib for Patients With Renal Cell Carcinoma. Clin Genitourin Cancer. 2015; 13:350–358.
41. Teo YL, Chue XP, Chau NM, Tan MH, Kanesvaran R, Wee HL, Ho HK, Chan A. Association of drug exposure with toxicity and clinical response in metastatic renal cell carcinoma patients receiving an attenuated dosing regimen of sunitinib. Target Oncol. 2015; 10:429–437.
42. Terada T, Noda S, Inui K. Management of dose variability and side effects for individualized cancer pharmacotherapy with tyrosine kinase inhibitors. Pharmacol Ther. 2015; 152:125–134.
43. Kim HR, Park HS, Kwon WS, Lee JH, Tanigawara Y, Lim SM, Kim HS, Shin SJ, Ahn JB, Rha SY. Pharmacogenetic determinants associated with sunitinib-induced toxicity and ethnic difference in Korean metastatic renal cell carcinoma patients. Cancer Chemother Pharmacol. 2013; 72:825–835.