
INTRODUCTION
Tumor suppressor p53 is a transcription factor, exerting its regulations on gene transcription through direct binding to p53 responsive elements and recruiting cofactors to facilitate assembly of transcription machinery [1, 2]. Extensive studies have revealed that p53 transcriptional activities are highly versatile, affecting a large number of genes and in a wide range of functions both in basal and stress conditions, including fertility, DNA damage, as well as oxidative and metabolic stress [3, 4]. The versatility of p53 is in part owing to its posttranslational modifications (PTMs) [5-7]. As one of the important modifications, acetylation has been shown to be critical for regulation of p53 transcriptional activities [8]. Specifically, our previous studies reveal that acetylation of lysines in the p53 DNA binding domain is indispensable for the transcriptional program to induce apoptosis, senescence, and cell cycle arrest. Combined mutations of p53 K117, K161, and K162 to arginine (3KR) in mouse result in loss of induction of apoptosis, senescence, and cell cycle arrest by the mutant p53 3KR protein [9]. Moreover, p533KR/3KR mice do not show early-onset tumor formation, suggesting that additional p53 dependent functions play important roles in tumor suppression [9].
Ubiquitination is another important posttranslational modification of p53, which is mainly controlled by p53 E3 ligase Mdm2, and Mdm2-related protein Mdmx [10-16]. Both mdm2 and mdmx knockout mice are embryonic lethal, due to activation of p53 and subsequent induction of apoptosis, senescence and growth arrest. Importantly, the lethality of mdm2 and mdmx knockout mice are rescued by concomitant deletion of p53, suggesting that Mdm2 and Mdmx exert their functions mainly through negative regulation of p53 [17-19]. However, the embryonic lethality of mdm2 and mdmx knockout mice limits our understanding of p53 functions beyond cell death and control of cell cycle. Interestingly, the embryonic lethality of mdm2 and mdmx knockout mice can be rescued by mutant p53 with reduced functions and by genetically modified p53 with restricted p53 expression, allowing studies of Mdm2 and Mdmx-dependent temporal and tissue specific phenotypes in those mice [20-22]. Furthermore, p53 is activated through dissociation with Mdmx mediated by phosphorylation of Mdmx under metabolic stress, highlighting the importance of mdmx in p53-dependent metabolic regulation [23].
In light of these studies, and particularly the absence of induction of apoptosis, senescence and cell cycle arrest in mutant p533KR/3KR mice, we reason that the combination of p53 3KR mutation and the absence of p53 negative regulator Mdmx may provide unique opportunities to uncover novel p53-regulated functions, particularly in metabolic regulations, which would be otherwise masked by cell death and cell growth arrest in wild-type p53 mice.
Notably, our previous study showed that the embryonic lethality caused by the deficiency of mdm2 was only partially rescued in the background of p533KR/3KR. We also observed high levels of p53 protein and activation of p53-mediated ferroptosis associated with loss of Mdm2 in p533KR/3KR/mdm2-/- mice. In this study, we report that the p53 3KR mutation fully rescued the embryonic lethality of mdmx knockout mice and that p53 protein levels were only slightly increased in p533KR/3KR/mdmx-/- mice. Interestingly, p533KR/3KR/mdmx-/- mice displayed significant reduction of body fat and increase of energy expenditure, compared to p533KR/3KR littermates. In addition, p533KR/3KR/Mdmx-/- mice were protected from obesity and insulin resistance upon high fat diet treatment. We further demonstrated that the metabolic benefits were achieved through brown remodeling of white adipose tissues. To explore the mechanism leading to the anti-obesity phenotype, we identified ELOVL3 as a bona fide p53 target gene and a key mediator of the browning effects in p533KR/3KR/mdmx-/- mice. Taken together, by abolishing p53-dependent apoptosis, senescence, and cell cycle arrest through p53 3KR mutations, we uncovered a catabolic function of p53 in adipose biology.
RESULTS
The embryonic lethality of mdmx knockout mice is fully rescued by p533KR/3KR
It is established that the lethality of mdmx knockout mice is caused by p53-mediated growth arrest [19]; in addition, the lethality of mdmx knockout mice is rescued by a mutant p53 with reduced transcriptional signaling in cell cycle arrest and apoptotic responses [20]. To determine if the p53 3KR mutant, an acetylation-defective mutant which is unable to induce senescence and cell-cycle arrest [9], can rescue the embryonic lethality of mdmx mutant mice, p533KR/3KR mice were crossed with mdmx heterozygote knockout mice. We first generated mice homozygous for the p53 3KR mutant allele and heterozygous for the mdmx knockout allele (p533KR/3KR/mdmx+/- mice). Intercrosses of p533KR/3KR/mdmx+/- mice is expected to yield 25% of offspring to be p533KR/3KR/mdmx-/- mice if embryonic lethality of mdmx knockout mice can be rescued by p53 3KR mutant. From nearly 200 live mice generated from the cross, about a quarter of them were genotyped to be p533KR/3KR/mdmx-/- mice, close to Medelian ratio (Figure 1B). Moreover, p533KR/3KR/mdmx-/- mice were apparently normal without developmental defects (Figure 1A). These data demonstrated that the embryonic lethality of mdmx knockout mice was fully rescued by the p53 3KR mutation, providing direct evidence that the lethality of mdmx knockout mice is caused by p53-dependent cell growth suppression [19].
Increased stability of p53 3KR protein in the absence of Mdmx
Despite its high sequence homology with Mdm2 and the presence of a RING domain, Mdmx does not have intrinsic E3-ligase activity for p53 [24]. Although several studies indicate that the Mdm2/Mdmx complex is critical for p53 degradation [25, 26], it remains unclear whether Mdmx is absolutely required for this event in vivo. To address this question, we set out to investigate whether the abundance of p53 3KR protein was affected in the absence of Mdmx. Briefly, wild-type mice, p533KR/3KR, and p533KR/3KR/mdmx-/- mice were given ionizing radiation to induce DNA damage in vivo, after which tissues were collected and analyzed by western blot and immunohistochemistry. Briefly, whole cell extracts were prepared from thymi of wild-type, p533KR/3KR, and p533KR/3KR/mdmx-/- mice with or without ionizing radiation and the protein levels of p53 were determined by Western blot. There was no obvious difference in p53 levels in p533KR/3KR mice compared to wild-type p53 mice without radiation (Figure 1C lane 3 vs. 1), whereas in p533KR/3KR/mdmx-/- mice, the levels of p53 3KR protein was slightly higher than that of wild-type and p533KR/3KR mice in the absence of DNA damage (Figure 1C lane 5 vs. 1 and 3). Notably, in respond to ionizing radiation, the levels of p53 were increased in mice of all genotypes (Figure 1C lanes 2, 4, and 6, vs. 1, 3, 5, respectively), indicating a normal response to DNA damage in p533KR/3KR/mdmx-/- mice, compared to wild type and p533KR/3KR mice.
To further demonstrate the effect of mdmx deletion on p53 stability at the cellular level, the p53 abundance was visualized by immunostaining using anti-p53 antibody. In the thymus from p533KR/3KR mice, there was no obvious increase of p53 levels in the absence of radiation, compared to the thymus from wild-type mice, shown by the immunohistochemical staining of p53 (Figure 1D iii vs i). In contrast, there were modestly increases of p53 protein levels in thymus from p533KR/3KR/mdmx-/- mice compared to the ones from p53 wild-type and p533KR/3KR mice (Figure 1D v vs i and iii). However, after ionizing radiation, p53 was further induced in mice of all genotypes in response to DNA damage (Figure 1D ii, iv, and vi vs. i, iii, and v, respectively).
Similar results were also obtained in testis which showed restricted p53 staining mostly in primary spermatogonia. There were more primary spermatogonia with p53 staining in testis from p533KR/3KR/mdmx-/- mice, compared to wild type and p533KR/3KR mice (Figure 1E iii vs. i and ii). The number of p53 positive cells was further increased after ionizing radiation (Figure 1E ii, iv, and vi vs. i, iii, and v, respectively). Increase of p53 abundance was also observed in other tissues including spleen, pancreas, small intestine, cerebral cortex, hippocampus in p533KR/3KR/mdmx-/- mice, compared to wild type and p533KR/3KR mice (Supplementary Figure 1 7 vs. 1 and 4; 8 vs. 2 and 5; 9 vs 3 and 6; 16 vs. 10 and 13; 17 vs 11 and 14). Consistent with the previous study [27], the protein levels of p53 remained low in liver in p533KR/3KR/mdmx-/- mice, similar to that in wild-type and p533KR/3KR mice (Supplementary Figure 1 18 vs. 12 and 15), even after ionizing radiation (data not shown), suggesting that the role of Mdmx in p53 degradation is potentially tissue-specific. Notably, as expected, DNA damage induced activation of caspase3, occurred only in wild-type mice after ionizing radiation, but not in p533KR/3KR or p533KR/3KR/mdmx-/- mice, demonstrating the inability to induce apoptotic response by p53 3KR mutant in the absence of Mdmx (Supplementary Figure 2A ii vs. iv and vi; S2B ii vs. iv and vi). Taken together, these results provide compelling evidences suggesting that Mdmx is only partially required for p53 degradation in vivo. Moreover, Mdmx-mediated effects on p53 degradation are apparently modest and tissue-specific.
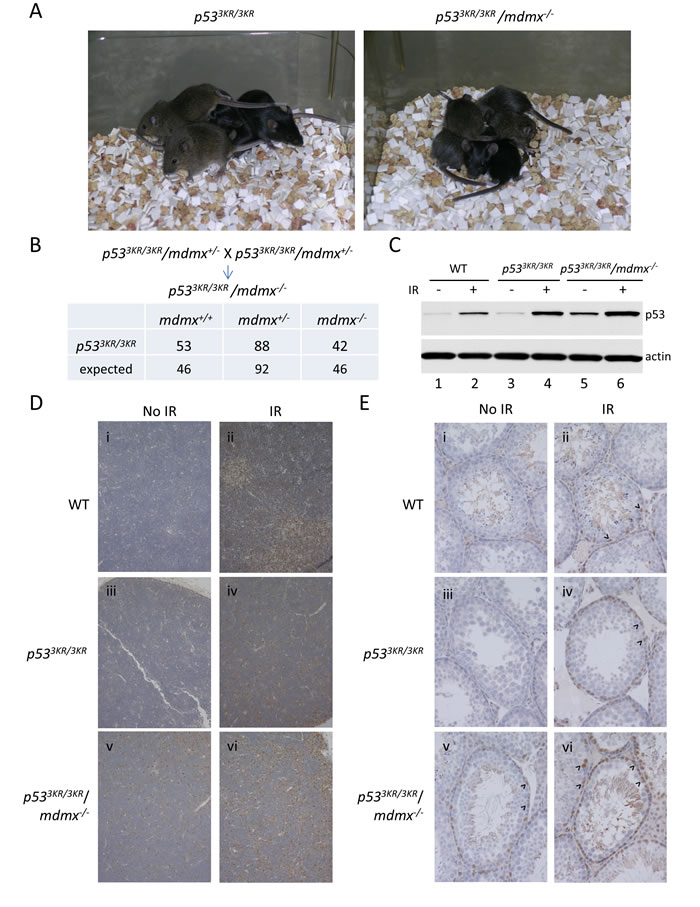
Figure 1: The embryonic lethality of mdmx knockout is rescued by p53 3KR mutation, and p53 3KR protein has increased stability in the absence of Mdmx. A. The representative pictures of p533KR/3KR and p533KR/3KR/mdmx-/- mice at weaning. B. Intercross of p533KR/3KR/mdmx+/- mice. The numbers of the resulting progeny are listed in the table. The expected numbers of progeny of different genotypes are based on the total number of progeny from the cross. C. Western Blotting of the protein extracts of thymi from wild-type, p533KR/3KR, and p533KR/3KR/mdmx-/- mice treated without (lanes 1, 3, and 5) or with (lanes 2, 4, and 6) ionizing radiation. D. Immunohistochemical staining of p53 in thymus from i and ii, wild-type; iii and iv, p533KR/3KR; v and vi, p533KR/3KR/mdmx-/- mice treated without (i, ii, iii) or with (ii, iv, vi) radiation. E. Immunohistochemical staining of p53 in testis from 2-month-old i and ii, wild-type; iii and iv, p533KR/3KR; v and vi, p533KR/3KR/mdmx-/- mice treated without (i, ii, iii) or with (ii, iv, vi) ionizing radiation.
Improved metabolism in p533KR/3KR/mdmx-/- mice
p533KR/3KR/mdmx-/- mice had normal life span similar to that of p533KR/3KR mice, and they also did not show early onset of spontaneous tumor. However, adult p533KR/3KR/mdmx-/- mice appeared to be skinnier than p533KR/3KR control mice at 4 months of age (Figure 2Ai). Since our previous study showed that there were no significant body weight differences between wild type and p533KR/3KR mice (Supplementary Figure 3A) [28], and there were no differences in metabolic activities such as glucose tolerance test between wild type and p533KR/3KR mice (Supplementary Figure 3B), the skinny phenotypes observed in p533KR/3KR/mdmx-/- mice were most likely caused by loss of Mdmx. Anatomical analysis revealed a gross reduction of fat mass, most noticeably epididymal fat, in p533KR/3KR/mdmx-/- mice (Figure 2Aii and iii). The body weight of p533KR/3KR/mdmx-/- mice measured at 7-week and 10-week old were about 20% lower than their littermate controls (Figure 2B). To reveal the cause for the differences in body weight, Magnetic Resonance Imaging (MRI) was performed on these mice. Consistent to the skinny phenotype, the MRI results showed that there was a significant reduction of the fat content in p533KR/3KR/mdmx-/- mice compared to p533KR/3KR mice (Figure 2C). In contrast, there was a similar lean body mass between these mice (Figure 2D).
The lean body phenotype in p533KR/3KR/mdmx-/- mice implied potentially different metabolic activities compared to the control mice. Since body weight is solely determined by the balance between food intake and energy expenditure, calorimetric analysis was performed to monitor food intake, locomotor activities, O2 consumption and CO2 production to reveal the underlying metabolic changes in these mice [29]. Age matched p533KR/3KR/mdmx-/- and p533KR/3KR mice were housed individually in enclosed metabolic cages with continues recording. Despite the differences in body weight, the results showed that normalized food intake based on their body weight was comparable between p533KR/3KR/mdmx-/- and the control mice (Figure 2E), suggesting that their lean phenotype was not caused by reduced energy intake but by increases of energy usage. Consistently, the biometric analysis showed that p533KR/3KR/mdmx-/- mice had significantly higher energy expenditure (Figure 2F and 2G), which was also supported by increased locomotor activity compared to p533KR/3KR controls (Figure 2H and 2I). Moreover, the biometric analysis also measures release of CO2 and consumption of O2 from each mouse to determine the respiratory exchange ratio (RER, CO2 released over O2 consumed). Since more oxygen is required to fully oxidize fatty acids than carbohydrates (RER value for 100% utilization of carbohydrates is 1, whereas 100% utilization of fatty acids is 0.75, which means the lower the RER is, the more fatty acid is utilized), differences in RER reflect the preferential usage of fatty acids or carbohydrates in metabolic activities. Significantly, the RER was lower for p533KR/3KR/mdmx-/- mice than the control mice (Figure 2J), indicating a preference of utilizing fatty acids over carbohydrates in p533KR/3KR/mdmx-/- mice compared to p533KR/3KR mice, which subsequently provides more energy to support their activities in p533KR/3KR/mdmx-/- mice. Taken together, these data suggest that the lean phenotype in p533KR/3KR/mdmx-/- mice was caused by increased energy expenditure through preferential usage of fatty acids as fuel, which generates more energy than carbohydrates and other nutrients.
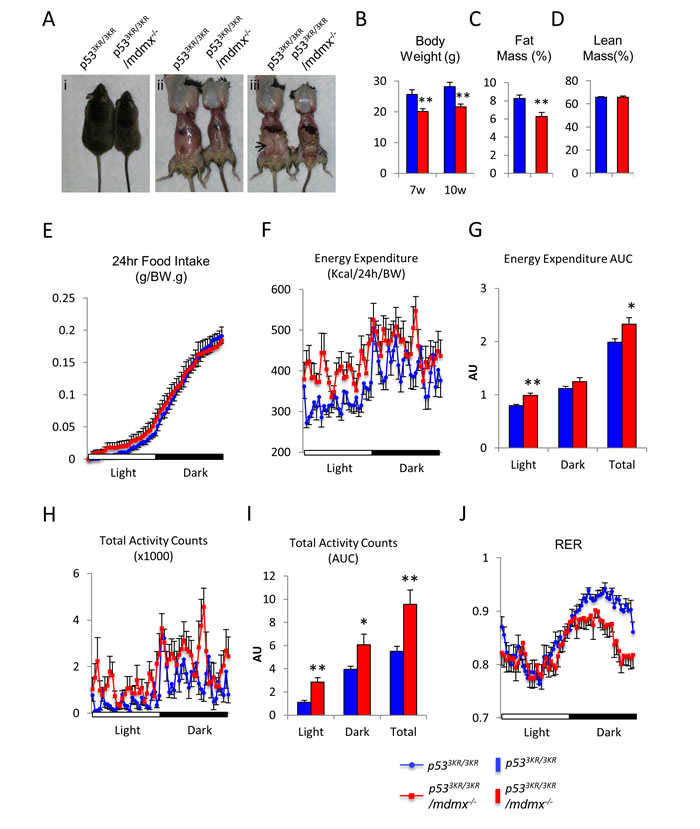
Figure 2: p533KR/3KR/mdmx-/- mice have reduced body fat. A. Gross appearances of 4-month-old p533KR/3KR and p533KR/3KR/mdmx-/- mice and dissection to reveal body fat. Arrow in iii indicates the prominent epididymal fat in p533KR/3KR mice. B. Comparisons of body weight. C. Measurements of fat mass content and D. Measurements of lean mass content in male mice at 10 weeks of age (n = 7, 5). E.-J. Calorimetric analyses of p533KR/3KR/mdmx-/- mice (n = 8) and p533KR/3KR mice (n = 8). E. Normalized food intake during a period of 24 hours. F. Recording of the energy expenditure during a period of 24 hours. G. Area under curve (AUC) of energy expenditure. H. Recording of total activity counts during a period of 24 hours. I. Area under curve (AUC) of total activity counts. J. Recording of respiratory exchange ratio (RER) during a period of 24 hours. * represents p < 0.05, ** represents p < 0.01. Data are represented as mean ± SEM.
p533KR/3KR/mdmx-/- mice are protected against obesity and the comorbidities
Given their lean phenotypes, we asked whether p533KR/3KR/mdmx-/- mice have metabolic benefits, particularly in protection against obesity. To address this question, p533KR/3KR/mdmx-/- and the control p533KR/3KR mice were fed with high fat diet (HFD, 60% fat calorie composition) to induce obesity [30]. Consistent to their lean phenotypes on regular chow diet, p533KR/3KR/mdmx-/- mice gained much less weight during HFD feeding compared to p533KR/3KR mice on high fat diet, resulting in a significant protection from obesity (Figure 3A). p533KR/3KR/mdmx-/- mice showed a nearly 40% less of body fat content, 21% fat content in p533KR/3KR/mdmx-/- mice compared to 38% fat content in p533KR/3KR mice, while the percentage of the lean mass was increased in p533KR/3KR/mdmx-/- mice as determined by MRI (Figure 3B). To exclude the effects of initial weight differences between p533KR/3KR/mdmx-/- and p533KR/3KR mice on the outcome of diet-induced obesity, bodyweight-matched p533KR/3KR/mdmx-/- and p533KR/3KR mice were treated with HFD. Again, protection against obesity in p533KR/3KR/mdmx-/- mice was recapitulated (Figure 3C).
Obesity often leads to a series of co-morbidities, primarily insulin resistance and type 2 diabetes [31, 32]. Insulin resistance and type 2 diabetes can be assessed by glucose tolerance test to determine the capability of mice to maintain glucose homeostasis in response to blood glucose shock. In short, a bolus of glucose was injected intraperitoneally into the mice and the levels of blood glucose were determined. Compared to p533KR/3KR control mice, p533KR/3KR/mdmx-/- mice showed lower glucose levels after 1-hour post glucose injection (Figure 3D), indicating a more efficient glucose clearance. This improved glucose homeostasis in p533KR/3KR/mdmx-/- mice were further supported by their lower ad libitum blood glucose levels than those of p533KR/3KR mice (Figure 3E).
Obesity also causes nonalcoholic fatty liver diseases (NAFLD), a risk factor for cirrhosis and hepatocellular carcinoma [33-35]. After high fat diet treatment, there was apparent accumulation of lipid droplets in the liver (hepatic steatosis) from p533KR/3KR mice from the histopathological analysis, in contrast, the hepatic steatosis in p533KR/3KR/mdmx-/- mice was largely prevented indicated by significantly reduced lipid droplets (Figure 3F ii vs. i). Interestingly, there were no significant differences in the expression of genes regulating lipogenesis, gluconeogenesis, lipid oxidation or ketogenesis in the liver (Supplementary Figure 4A). Moreover, the circulating triglycerides, cholesterol, and free fatty acids (FFA) levels were unchanged (Figure 3E), suggesting that the anti-obesity effects in p533KR/3KR/mdmx-/- mice, were not originated in liver.
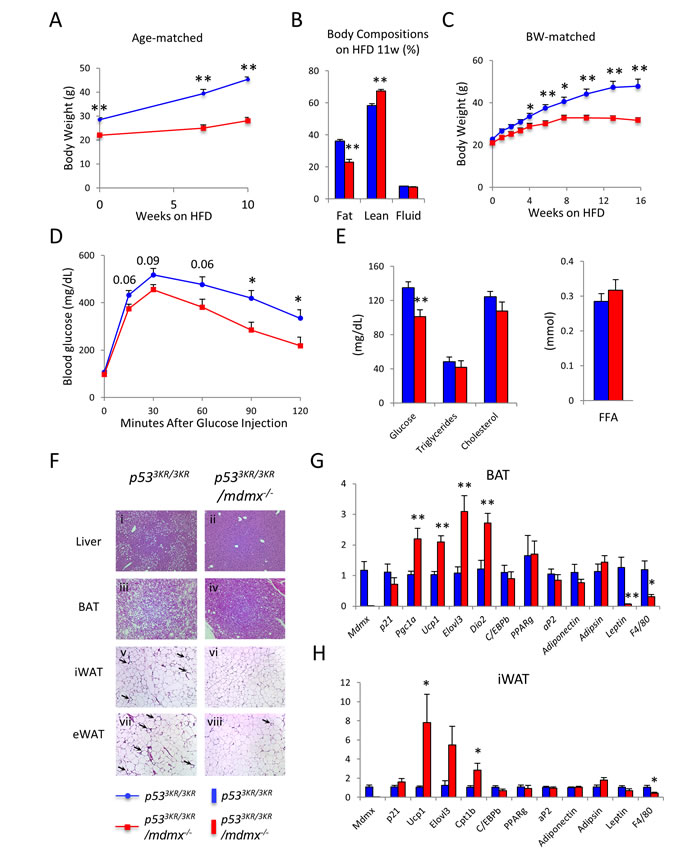
Figure 3: p533KR/3KR/mdmx-/- mice resist diet-induced obesity. A. Body weight curve of age-matched p533KR/3KR (n = 11) and p533KR/3KR/mdmx-/- mice (n = 8) on high fat diet. B. Body composition of mice used in (A) after 10 weeks on HFD. C. Average body weight curve of weight-matched p533KR/3KR and p533KR/3KR/mdmx-/- mice on HFD (n = 5, 5). D. Glucose tolerance test on mice after 10 weeks on HFD. E. Plasma levels of glucose, triglycerides, cholesterol, and free fatty acids in mice after 12 weeks HFD feeding. Mice were sacrificed after overnight fasting (n = 6, 6). F. Histopathological analysis of p533KR/3KR and p533KR/3KR/mdmx-/- mice on HFD. p533KR/3KR (i, iii, v, and vii) and p533KR/3KR/mdmx-/- (ii, iv, vi, and viii) mice. i and ii, liver; iii and iv, brown adipose tissue (BAT); v and vi, subcutaneous inguinal white adipose tissue (iWAT); vii and viii, visceral epididymal white adipose tissue (eWAT). Arrows indicate the “crown” like structures associated with macrophage infiltration. G. Relative expression levels of genes of interest in BAT (n = 6, 6). H. Relative expression levels of genes of interest in iWAT (n = 6, 6). *p < 0.05, **p < 0.01. Data are represented as mean ± SEM.
Improved adipose catabolism in p533KR/3KR/mdmx-/- mice
Since the lean phenotype in p533KR/3KR/mdmx-/- mice is not caused by reduced food intake (Figure 2A), it is unlikely that the metabolic improvements in p533KR/3KR/mdmx-/- mice were stemmed from the central nervous system. Furthermore there were minimal changes in liver metabolism (Supplementary Figure 4A), suggesting other peripheral metabolic tissues played significant roles in the skewed metabolic activities in p533KR/3KR/mdmx-/- mice.
Given that dramatic reduction of body fat composition and increased energy expenditure accompanied by preference of lipid utilization in p533KR/3KR/mdmx-/- mice, we reasoned that the anti-obesity effect in these mice potentially arose from either reduced lipid production or increased lipid catabolism in adipose tissues. To test these hypotheses, major fat tissues from HFD treated mice were collected and subjected to histopathological and gene expression analyses.
There are two types of adipose tissues in mice, brown adipose tissue (BAT) and white adipose tissue (WAT). BAT has characteristic high levels of expression of UCP1 due to its function to produce heat. WAT, which stores excess energy, can be further divided into subcutaneous WAT (under the skin WAT, including subcutaneous inguinal WAT (iWAT)) and visceral WAT (abdominal WAT, including epididymal WAT (eWAT)). We first looked at the BAT since it plays a major role in consuming lipids to generate heat. The results of histology showed that there was reduced lipid accumulation in brown adipose tissue (BAT) in p533KR/3KR/mdmx-/- mice (Figure 3F iv vs. iii). Furthermore, the expression of genes Ucp1, ELOVL3, Dio2 and Pgc-1α were up-regulated. There genes are normally associated with lipid oxidation, indicating an increased usage of lipid in the BAT of p533KR/3KR/mdmx-/- mice, compared to the control mice (Figure 3G). In contrast, the white adipocyte-specific gene Leptin was significantly down-regulated, whereas the pan-adipocyte genes, including Pparγ, aP2, Adiponectin, Adipsin and C/ebpβ, were not affected in the BAT of p533KR/3KR/mdmx-/- mice, suggesting similar adipocyte development between theses mice (Figure 3G).
In white adipose tissues (WAT), the size of the adipocytes were also smaller in p533KR/3KR/mdmx-/- mice than in p533KR/3KR control mice (Figure 3F iv vs. v, iWAT: subcutaneous inguinal white adipose tissue; viii vs. vii, eWAT: visceral epididymal white adipose tissue), indicating reduced storage of lipid in WAT in p533KR/3KR/mdmx-/- mice on HFD. Strikingly, there was a similar up-regulation of brown adipocyte-related genes, Ucp1, ELOVL3 and Cpt-1b while the pan-adipocyte gene expression remained unchanged in the iWAT from p533KR/3KR/mdmx-/- mice (Figure 3H), indicating a selective expression of brown adipocyte-related genes in p533KR/3KR/mdmx-/- mice. The higher transcriptional activities of Ucp1, ELOVL3 and Cpt-1b in iWAT, which are typically associated with “browning” in WAT, a process to increase output of heat in response to cold environment, were reminiscent of the similar changes in BAT in p533KR/3KR/mdmx-/- mice compared to the control mice, further indicating an increase of lipid usage. In addition, visceral epididymal WAT (eWAT) is normally dormant in metabolic activities and its accumulation leads to higher risks of metabolic diseases [36, 37]. The expressions of BAT associated genes in the eWAT were much lower compared to that in the iWAT and BAT, and they were not affected by the ablation of mdmx (Supplementary Figure 4B). Interestingly, the key lipid oxidative genes Cpt-1a and Acox1 were up-regulated, buttressing their smaller adipocyte size in p533KR/3KR/mdmx-/- mice.
Obesity causes macrophage infiltration in fat and chronic inflammation, which in turn contributes to insulin resistance [38-41]. In addition, previous study also demonstrated the role of p53 in macrophage functions [42], prompted us to determine macrophage related phenotypes. Less “crown” structures were observed, the sign of macrophage infiltration, in iWAT eWAT (Figure 3F vi vs. v; viii vs. vii), which was further supported by lower levels of macrophage marker F4/80 in BAT, both in iWAT and eWAT in p533KR/3KR/mdmx-/- mice than in p533KR/3KR mice (Figure 3G, 3H, and Supplementary Figure 4B), indicating a better adipose health with lower inflammation in p533KR/3KR/mdmx-/- mice than in p533KR/3KR mice. Taken together, these data suggest BAT associated genes including lipid oxidative genes were selectively activated in fat tissues in p533KR/3KR/mdmx-/- mice, resulting in increased energy production and fat dissipation, leading to protection against diet-induced obesity and prevention of insulin resistance in p533KR/3KR/mdmx-/- mice.
Brown remodeling of WAT in p533KR/3KR/mdmx-/- mice
To further demonstrate the anti-obesity effects through up-regulation of BAT associated genes particularly in WAT, p533KR/3KR/mdmx-/- and control mice were exposed to cold environment, an established method to activate browning (non-shivering thermogenesis) in white adipose tissues. After 4 days in the cold, the subcutaneous inguinal WAT (iWAT) and visceral epididymal WAT (eWAT) from p533KR/3KR/mdmx-/- mice showed marked morphological differences, compared to those from p533KR/3KR mice. Typically, adipocytes in WAT are unilocular cells fulfilled with a large lipid droplet (Figure 4Ai). After cold exposure, multilocular brown-like adipocytes emerge in iWAT (Figure 4Aiii), a process variously referred to as “browning”, “beiging”, or “brown remodeling”. The prevalence of the multilocular adipocytes in the browning-prone iWAT was much higher in p533KR/3KR/Mdmx-/- than in the control mice (Figure 4A iv vs. iii). In contrast to iWAT, eWAT are normally resistant to browning, even after cold challenge, indicated by the maintaining of the unilocular cell morphology (Figure 4Ai). Surprisingly, a significant number of multilocular adipocytes appeared in eWAT in p533KR/3KR/mdmx-/- mice (Figure 4Aii), indicating an expansion of browning in p533KR/3KR/mdmx-/- mice compared to p533KR/3KR mice. Consistent to the presence of browning in eWAT, the expression of the representative brown adipocyte markers Ucp1, ELOVL3 and Dio2 were increased significantly in eWAT in p533KR/3KR/mdmx-/- mice (Figure 4B). In iWAT, higher expression of Ucp1, ELOVL3 and Dio2 was observed in p533KR/3KR/mdmx-/- mice compared to p533KR/3KR mice, however, the increases were not statistically significant probably due to increased expression of these same genes in iWAT from p533KR/3KR mice and the large variations among the samples (Figure 4C). Nonetheless, the expression of Glut4, an insulin-dependent glucose transporter, increased over two-fold in p533KR/3KR/mdmx-/- mice, so did the major adipocyte lipase Atgl, suggesting that increase of glucose uptake and lipolysis to provide fuels to sustain the elevated metabolic activities. Consistent with the phenotypes of mice treated with HFD, inflammation in adipose tissues in p533KR/3KR/mdmx-/- mice remained low, supported by the consistently low levels of the macrophage marker F4/80 (Figure 4C). In BAT, the thermogenic program was maximally activated in both p533KR/3KR/mdmx-/- mice and p533KR/3KR mice during cold challenge, and differences were minimal between these mice (Figure 4A vi vs. v, and Figure 4D). Taken together, these results further supported that there was an increase of browning of WAT in p533KR/3KR/mdmx-/- mice, consistent with the increase of lipid usage and the anti-obesity effect during HFD feeding in these mice.
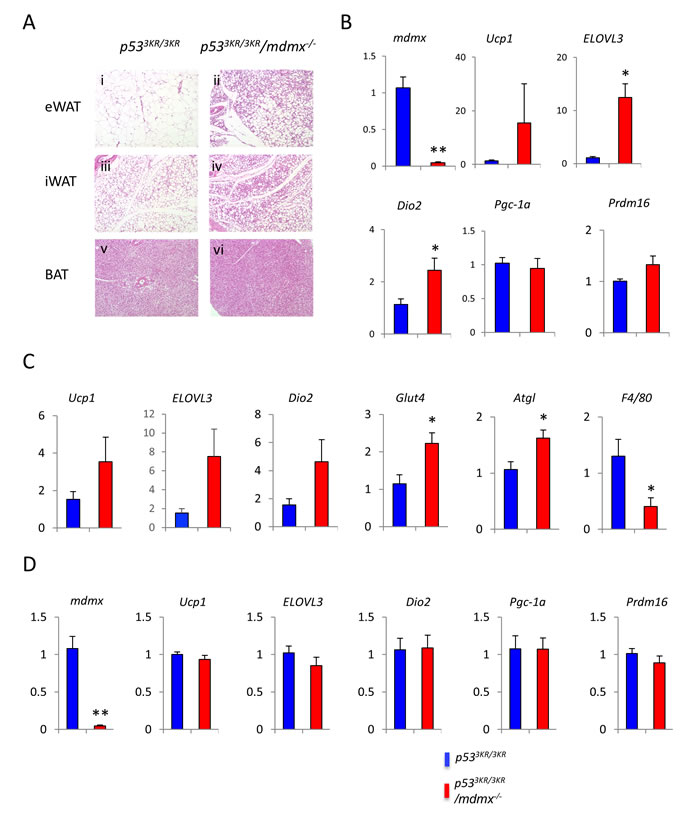
Figure 4: Increased thermogenic response in p533KR/3KR/mdmx-/- mice. 4-month old male mice were exposed to 4 °C for 4 days. A. Histology of adipose tissues from p533KR/3KR (i, iii, and v) and p533KR/3KR/mdmx-/- (ii, iv, and vi) mice on high fat diet. B. Relative expression levels of genes of interest in eWAT. C. Relative expression levels of genes of interest in iWAT. D. Relative expression levels of genes of interest in BAT. *p < 0.05, **p < 0.01 (n = 7, 5). Data are represented as mean ± SEM.
ELOVL3 is a novel target of p53
Since the levels of p53 3KR protein were increased in p533KR/3KR/mdmx-/- mice compared to p533KR/3KR mice, we reasoned that there would be an increase of transcription to support the browning in p533KR/3KR/mdmx-/- mice. It has been demonstrated that the expression of ELOVL3 is closely associated with BAT and its metabolic activities [43-45]. Because the increased expression of ELOVL3 was consistently observed in p533KR/3KR/mdmx-/- mice compared to p533KR/3KR mice, we sought to investigate whether ELOVL3 is a bona fide transcriptional target of p53, which serves as a potential mediator for the increased brown remodeling in p533KR/3KR/mdmx-/- mice. ELOVL family members are fatty acid elongases that catalyze fatty acid elongation [46, 47]. Among the seven known ELOVL family members, only ELOVL3 expression levels was increased after p53 induction, as determined by qPCR (Figure 5A). Furthermore, ELOVL3 protein levels also increased following expression of p53 in H1299 cells. As expected, the levels of p53 target genes p21 and mdm2 were also increased under the same condition, suggesting activation of p53 dependent transcription (Figure 5B). The induction of ELOVL3 is dependent on the integrity of DNA binding domain of p53, since p53 DNA binding deficient mutant, p53-R175H failed to increase ELOVL3 expression levels, whereas wild-type p53 did (Figure 5C). To identify the p53 binding sites in the ELOVL3 promoter, regions of ELOVL3 promoter were tested in quantitive chromatin immumoprecipitation (qChIP) assay. Only region 4 as depicted in the diagram displayed significant recruitment of p53 protein (Figure 5D). Upon further analysis, there are two putative p53 binding sites within region 4 of ELOVL3 promoter, which prompted us to narrow down the p53 binding site. As shown in the competition gel-shift assay, the binding between p53 and 32P-labelled wild type ELOVL3 promoter DNA probe was reduced by unlabeled ELOVL3 promoter DNA containing deletion of binding site 2 (BS2), but not by ELOVL3 promoter DNA containing deletion of binding site 1 (BS1), indicating BS1 is the binding site for p53 on ELOLV3 promoter (Figure 5E). To validate the transcriptional regulation of ELOVL3 by p53, luciferase expression plasmid containing wild type ELOVL3 promoter (pLucB), or containing ELOVL3 promoter with large deletion (pLucA), or containing ELOVL3 promoter with deletion of the p53 binding site 1 (pLucBΔ) was constructed. As shown in luciferase assay, cotransfection of pLucB, but not pLucA, with p53 expression vector resulted in p53-dose dependent induction of luciferase activities. In contrast, there was no significant increase of luciferase activity after cotransfection with empty vector (EV) or vector expressing p53-R175H (Figure 5F). Furthermore, only the cells transfected with pLucB, but not pLucBΔ showed significant increases of luciferase activity in a p53 dependent manner (Figure 5G). In summary, these data suggest that p53 exerts direct transcriptional regulation of ELOVL3 through DNA binding between p53 and p53 binding site 1 in ELOVL3 promoter. In addition, the alignment between human and mouse ELOVL3 promoter sequences showed a high degree of identity of the p53 responsive element (Supplementary Figure 5A), and ELOVL3 is moderately activated upon expression of mouse p53-3KR protein using a luciferase assay (Supplementary Figure 5B, column 2 vs. column 1). Importantly, the activation of ELOVL3 promoter was greatly increased upon mdmx knockdown by mdmx siRNA (Supplementary Figure 5B, column 4 vs. column 3), further validating p53-mediated regulation of ELOVL3.
Finally, to test the regulation of ELOVL3 by p53 in a physiologically relevant context, H460 cells were treated with doxorubicin to induce DNA damage dependent p53 activation. The expression levels of ELOVL3 were increased as the time of doxorubicin treatment increased, in a similar way to the increase of p53 target gene p21 (Figure 5H). To demonstrate this regulation was p53 dependent, the control and p53 knockdown H460 cells were prepared through transfection of the control si-RNA (si-ctr) or p53-specific si-RNA (si-p53). These cells were further treated with doxorubicin. The increases of ELOVL3 levels were reduced in p53 knockdown cells after doxorubicin treatment, compared to the increases of levels of ELOVL3 in control knockdown cells. As expected, the induction of p53 target gene p21 was reduced in p53 knockdown cells after doxorubicin treatment, compared to that of the control knockdown cells (Figure 5I). Taken together, these results demonstrated that ELOVL3, a key brown adipocyte gene, is a direct target of p53 transcriptional regulation mediated by p53 responsive sequence in its promoter.
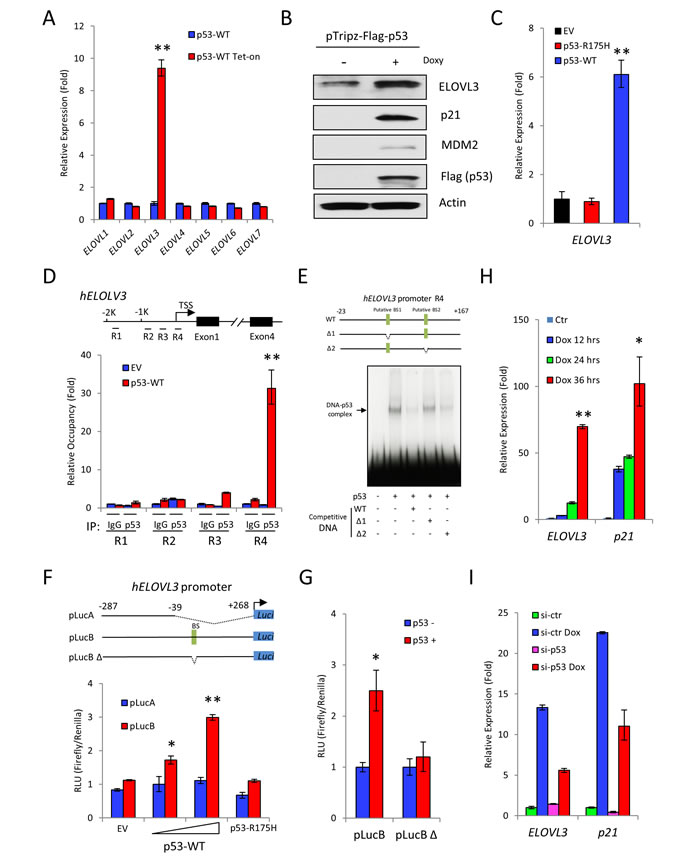
Figure 5: ELOVL3 is a transcriptional target of p53. A. The p53 dependent expression of ELOVL family genes was measured by qPCR. The expression of p53 was induced by doxycycline in inducible H1299 p53 stable cell line. B. Western blot to determine the levels of ELOVL3 and p53 target genes p21 and MDM2 expression before and after induced p53 expression by doxycycline in inducible H1299 p53 stable cell line. C. Relative expression levels of ELOVL3 were determined by qPCR after transient expression of wild-type p53 or mutant p53 R175H. Transfection with empty vector was used as control. D. Regions of ELOVL3 promoter were tested for p53 binding by qChIP using control IgG and anti-p53 antibody. E. Electro mobility shift assay was performed by using probes containing full length or partially deleted ELOVL3 promoter. F. Luciferase assay using full length ELOVL3 promoter (pLucB) or partially deleted ELOVL3 promoter (pLucA) after transfection of increasing levels of p53, or mutant p53-R175H for 24 hours. G. Luciferase assay using luciferase expression vector with full length (pLucB) or partially deleted (pLucB Δ) ELOVL3 promoter in the absence or presence of p53 expression. H. Relative levels of ELOVL3 upon DNA damage determined by qPCR after H460 cells were treated with 1 uM doxorubicin for 12, 24 or 36 hrs. I. Control or p53 knockdown H460 cells were treated with or without 1 uM doxorubicin for 24 hrs. The expression of ELOVL3 and p53 target gene p21 was determined by qPCR. * represents p < 0.05;** represents p < 0.01.
DISCUSSION
Mdmx is involved in p53 degradation but not essential
Because of the critical roles of mdm2 and mdmx in negatively regulating p53, the ability to rescue the embryonic lethality of mdm2 and mdmx knockout mice becomes imperative to gauge the extent of loss of functions for p53, particularly for p53 mutants with partial loss of functions [20, 22]. In this study, we were able to rescue mdmx knockout mice with p53 3KR mutant, a mutant that retains the DNA binding capacity but loses induction of apoptosis, senescence, and cell cycle arrest, highlighting the importance of these p53 dependent functions during embryonic development.
It is well accepted that mdmx represses p53 transcriptional activity through direct binding. However, the role of Mdmx in p53 degradation remains somewhat controversial. On one hand, several studies showed that the Mdm2/Mdmx heterodimer complex is critical for p53 degradation, suggesting that Mdmx is essential for p53 degradation [48-50]. On the other hand, the levels of p53 remain largely unchanged upon Mdmx knockdown in human cancer cells and in the mutant mice expressing an Mdmx mutant lacking its C-terminal ring domain [25, 51]. Our results showed that the protein levels of p53 are modestly increased in the thymus, spleen and testis of p533KR/3KR/mdmx-/- mice, consistent to the role that Mdmx participates in p53 degradation. However, the elevated levels of p53 in p533KR/3KR/mdmx-/- mice are modest and also tissue-specific (e.g. no effect observed in livers). More importantly, p53 can be further stabilized in response to DNA damage to similar levels in p533KR/3KR/mdmx-/- mice, as to wild-type or p533KR/3KR mice under the same conditions. Thus, it is likely that Mdmx modestly contributes to p53 degradation by forming the Mdmx2/Mdmx heterodimer but p53 can still be effectively degraded by Mdm2 alone in the absence of Mdmx in vivo.
P53 in switching energy sources and remodeling of adipose tissues
As an important player in cancer biology, p53 not only controls apoptosis, senescence, cell cycle arrest, but also plays important roles in regulating cellular metabolism [52]. It has been suggested that p53 promote cell survival under transient metabolic stress, and p53 is known to lower glucose utilization and promotes mitochondrial respiration and fatty acid oxidation [3, 53]. A complete loss of p53 results in decreased exercise capacity due to repressed mitochondrial activities in mice [54]. Nevertheless, the studies of p53 metabolic functions using p53 knockout mice and the studies using p53 gain-of-function mutant mice were hampered by the rapid tumor formation due to loss of tumor suppression functions of p53. By studying the p53 3KR mutant in mdmx knockout background, we were able to enhance the metabolic functions of p53 in the absence of tumor formation and in the absence of cell death and growth arrest that normally dominate the phenotypes after p53 activation. Moreover, p53-/-/mdmx-/- mice failed to show similar skinny phenotypes as observed in p533KR/3KR/mdmx-/- mice (Supplementary Figure 6), suggesting the phenotypes associated with p533KR/3KR/mdmx-/- are p53 dependent. Consistent with the potential p53 dependent metabolic regulation, we observed increased energy expenditure accompanied with enhanced fatty acid utilization in BAT, and brown remodeling of WAT in p533KR/3KR/mdmx-/- mice. Notably, brown remodeling is a process that can be induced due to environmental changes, such as cold challenge, or due to aberrant gene expression. To further support with these observations, we found that UCP1 and ELOVL3, which are often associated with BAT activation and brown remodeling, were upregulated in p533KR/3KR/mdmx-/- mice likely due to enhanced p53 3KR activities. This specific effect became more prominent in protection against HFD induced fat accumulation and obesity associated changes. Therefore, p53 is not only critical for metabolic reprogramming in stressed cells, but also for regulating metabolic homeostasis in normal tissues.
Another interesting finding was the decreased macrophage infiltration in p533KR/3KR/mdmx-/- mouse adipose tissues, supported by the lacking of crown-like structures (Figure 3F vi and viii) and significant reduction of macrophage marker F4/80 expression (Figure 3G and 3H). Since the recruitment of macrophages into adipose tissue indicates chronic inflammation accompanied with obesity and insulin resistance, decreases in macrophage infiltration further supports the lean phenotype and preserved insulin sensitivity in p533KR/3KR/mdmx-/- mice. In addition, apoptotic adipocytes are usually surrounded by macrophages and create crown like structures in adipose tissue. The lack of crown-like structures in eWAT of HFD-fed p533KR/3KR/mdmx-/- mice (Figure 3F viii) is consistent to the inability of p53 3KR to induce apoptosis and subsequently lack of apoptosis in adipocytes. Given that increase in lipid oxidation causes increase in reactive oxygen species (ROS) and damage to adipocytes, we propose that p53 has an essential role in regulating adipocyte metabolism: under metabolic stress, such as excess calorie intake (HFD), or increased energy expenditure (during cold exposure), p53 is induced in adipocytes to promote lipid catabolism and potentially also to cause apoptosis; consequently, adipose tissues are replenished with new adipocytes to maintaining adipose tissue homeostasis. In p533KR/3KR/mdmx-/- mice, p53 3KR protein is stabilized in the absence metabolic stress, which will promote lipid catabolism in adipocytes, without causing apoptosis in adipose tissue due to the inability of p53 3KR mutant to induce apoptosis. This leads to increased energy expenditure and reduced calorie storage, which is potentially beneficial in preventing obesity. Thus, by using p533KR/3KR/mdmx-/- model, we uncovered a unique metabolic control by p53 in adipose tissues, potentially through browning of WAT mediated by a novel p53 target gene, ELOVL3. In summary, our study reveals a potential strategy to combat obesity and the associated increase of cancer risks by targeting Mdmx to modulate p53 functions under physiological conditions [55, 56].
EXPERIMENTAL PROCEDURES
Animals
p53 3KR mice were described previously [9]. mdm4 (mdmx) knockout mice were provided by Dr. G. Lozano as described [57]. The mdmx conditional knockout mice were crossed with ROSA26-cre mice to generate mdmx knockout heterozygote mice, which were then crossed with p53 3KR mice to generate p533KR/3KR/mdmx+/- mice. Subsequently, p533KR/3KR/mdmx-/- mice were obtained by intercrosses between p533KR/3KR/mdmx+/- mice. All mice were maintained on a mixed C57bl6/j and 129Sv/Ev background and housed in a pathogen free facility on a 12-hour light-dark cycle. For the calorimetric analysis, three-month old male mice housed individually for one week in the cages from which food intake, motor activities, O2 input and CO2 output were determined. For the diet-induced obesity experiment, three-month old mice were fed a regular chow diet ad lib or a high fat diet (60% kcal fat; Research Diets D12492) for a period of 10 weeks. For the cold challenge experiment, mice were exposed to 4 °C for four constitutive days. All experiments were approved by the Institutional Animal Care and Use Committee (IACUC) of Columbia University.
Immunohistochemistry
For histological analysis, tissues were fixed in 4% formaldehyde in PBS, embedded in paraffin. The sections (5-µm) were collected and stained with antibody against p53 (CM5, Novocastra, UK) and Cleaved Caspase-3(Asp175) (#9661, Cell Signaling, Danvers, MA, USA), followed by counter staining with hematoxylin.
Western blot analysis
Whole cell extracts were prepared from tissues by homogenizing in RIPA buffer as described previously [58]. Lysates were separated by SDS-PAGE before being transferred onto nitrocellulose membrane. The membrane was probed with indicated antibody and the recognized proteins were visualized by ECL.
Quantitation of metabolic phenotypes using biometric cage
Mice were housed individually in metabolic cages to measure the calorimetry, activity, and drinking/feeding intake for a period of one week. Representative data of a period of one day are shown.
Glucose tolerance test (GTT) assay
The cohorts of mice were fasted overnight. After peritoneal injection of 2g glucose/kg body weight, the blood sugar levels were determined by glucometer (OneTouch UltraMini glucometer from LifeScan, Johnson & Johnson) using blood drop from tail vein, at time points of 15, 30, 60, 90, and 120 minutes.
Gene expression
To determine the expression levels of gene of interest, total RNA was extracted from cells using TRIzol according to manufacturer’s protocol, which was then used to prepare first strand cDNA by reverse transcriptase. Relative expression levels were determined by quantitive PCR (qPCR) using first strand cDNA and gene specific primers (Supplementary Table 1) accordingprotocol suggested by manufacturer (applied biosystems).
Cell culture, plasmid generation, transfection and reagent treatment
H1299 and H460 cell lines were cultured in DMEM medium with supplementing 10% (vol/vol) FBS. All the cell lines were obtained from ATCC and are free of mycoplasma contamination. Expressing constructs were made using pTRIPZ vector and stable expression cell lines were established in H1299, subsequently the expression of the integrated genes can be induced by doxycycline. Activation of p53 target genes such as p21, mdm2 was determined by western blot.
Chromatin immunoprecipitation (ChIP) assay
H1299 cells were transfected with empty vector or expressing construct p53-WT for 24 hrs. The relative occupancy of p53 on potential p53-binding sites of ELOVL3 promoter was evaluated by qChIP assay. Cells were fixed by 1% formaldehyde for 10 minutes at RT and lysed with ChIP Lysis Buffer (50 mM Tris-HCl pH 8.0, 5 mM EDTA, 1% SDS, 1× protease inhibitor) for 10 minutes at 4 °C. After sonication, the lysates were centrifuged, and the supernatants were collected and pre-cleaned in Dilution Buffer (20 mM Tris-HCl pH 8.0, 2 mM EDTA, 150 mM NaCl, 1% Triton X-100, 1× protease inhibitor) by salmon sperm DNA saturated protein A agarose (Millipore, 16-157) for 1 hour at 4 °C. The pre-cleaned lysates were aliquot equally and incubated with indicated anti p53 antibody or control IgG overnight at 4 °C. Saturated Protein A agarose was added into each sample and incubated for 2 h at 4 °C. The agarose was washed with TSE I (20 mM Tris-HCl pH 8.0, 2 mM EDTA, 150 mM NaCl, 0.1% SDS, 1% Triton X-100), TSE II (20 mM Tris-HCl pH 8.0, 2 mM EDTA, 500 mM NaCl, 0.1% SDS, 1% Triton X-100), Buffer III (10 mM Tris-HCl pH 8.0, 1 mM EDTA, 0.25 M LiCl, 1% DOC, 1% NP40), and Buffer TE (10 mM Tris-HCl pH 8.0, 1 mM EDTA), sequentially. The binding components were eluted (1% SDS, 0.1 M NaHCO3) and performed reverse cross-link at 65 °C for at least 6 hours. DNA was extracted by PCR purification Kit (Qiagen, 28106). Real-time PCR was performed to detect relative enrichment of p53 on ELOVL3 gene.
Electrophoretic mobility shift assay (EMSA)
Highly purified p53 was incubated with a 32p-labelled probe (190 base pairs) containing p53-binding element of ELOVL3 promoter or mutant ELOVL3 promoter in 1× binding buffer (10 mM Hepes, pH 7.6, 40 mM NaCl, 50 µM EDTA, 6.25% Glycerol, 1 mM MgCl2, 1 mM Spermidine, 1 mM DTT, 50 ng/µl BSA, 5 ng/µl sheared single strand salmon DNA) for 20 minutes at room temperature (RT). The complex was analyzed by 4% TBE-PAGE and visualized by autoradiography. The probe was obtained by PCR, labelled by T4 kinase (NEB, M0201S) and purified by Bio-Spin column (Bio-Rad, 732-6223).
Luciferase assay
ELOVL3 promoter regions (pLucA: control vector containing ELOVL3 promoter with large deletion; pLucB: containing intact ELOVL3 promoter and putative p53-binding site; pLucB Δ: containing ELOVL3 promoter with deletion of the putative p53-binding site) were cloned into pGL3-luciferase construct. The ELOVL3 luciferase construct was co-transfected with a control renilla construct and a p53-WT or -R175H expressing vector into H1299 cells for 24 hrs. Luciferase activity was measured according to dual luciferase protocol.
p53 dependent activation of ELOVL3
H460 cells were treated with 1 µM doxorubicin for 12, 24 or 36 hrs. The expression levels of ELOVL3 and p53 target gene p21 were determined by qPCR. To test p53 dependent transcriptional regulation, cells were transfected with p53-specific siRNA oligos for 48 hrs to knockdown p53, before the cells were treated with or without 1 µM doxorubicin for 24 hrs to induce p53 expression.
Statistical analysis
Results were shown as the means ± SEM. Difference was determined by using a two-tailed, unpaired Student t test.
ACKNOWLEDGMENTS AND FUNDING
We thank Dr. G. Lozano for providing mdm4 (mdmx) mutant mice. This work was supported by the National Cancer Institute of the National Institutes of Health under Award 5RO1CA190477, 5RO1CA224227, 5RO1CA216884 and 5RO1CA085533 to W.G., and R00DK97455 to L. Q. The content is solely the responsibility of the authors and does not necessarily represent the official views of the National Institutes of Health.
Conflicts of Interest
The authors declare no competing financial interests.
REFERENCES
1. Kruse JP, Gu W. Modes of p53 regulation. Cell. 2009; 137: 609-22. doi: S0092-8674(09)00511-X.
2. Vousden KH, Prives C. Blinded by the Light: The Growing Complexity of p53. Cell. 2009; 137: 413-31. doi: 10.1016/j.cell.2009.04.037.
3. Kruiswijk F, Labuschagne CF, Vousden KH. p53 in survival, death and metabolic health: a lifeguard with a licence to kill. Nat Rev Mol Cell Biol. 2015; 16: 393-405. doi: 10.1038/nrm4007.
4. Eischen CM. Role of Mdm2 and Mdmx in DNA repair. J Mol Cell Biol. 2017; 9: 69-73. doi: 10.1093/jmcb/mjw052.
5. Brooks CL, Gu W. New insights into p53 activation. Cell Res. 2010; 20: 614-21. doi: 10.1038/cr.2010.53.
6. Brooks CL, Gu W. The impact of acetylation and deacetylation on the p53 pathway. Protein Cell. 2011; 2: 456-62. doi: 10.1007/s13238-011-1063-9.
7. Dai C, Gu W. p53 post-translational modification: deregulated in tumorigenesis. Trends Mol Med. 2010; 16: 528-36. doi: S1471-4914(10)00130-9.
8. Tang Y, Zhao W, Chen Y, Zhao Y, Gu W. Acetylation is indispensable for p53 activation. Cell. 2008; 133: 612-26. doi: S0092-8674(08)00441-8.
9. Li T, Kon N, Jiang L, Tan M, Ludwig T, Zhao Y, Baer R, Gu W. Tumor suppression in the absence of p53-mediated cell-cycle arrest, apoptosis, and senescence. Cell. 2012; 149: 1269-83. doi: 10.1016/j.cell.2012.04.026.
10. Gilkes DM, Chen J. Distinct roles of MDMX in the regulation of p53 response to ribosomal stress. Cell Cycle. 2007; 6: 151-5. doi: 10.4161/cc.6.2.3719.
11. Chen J. The Roles of MDM2 and MDMX Phosphorylation in Stress Signaling to p53. Genes Cancer. 2012; 3: 274-82. doi: 10.1177/1947601912454733.
12. Gu J, Kawai H, Nie L, Kitao H, Wiederschain D, Jochemsen AG, Parant J, Lozano G, Yuan ZM. Mutual dependence of MDM2 and MDMX in their functional inactivation of p53. J Biol Chem. 2002; 277: 19251-4. doi: 10.1074/jbc.C200150200.
13. Liu G, Chen X. Regulation of the p53 transcriptional activity. J Cell Biochem. 2006; 97: 448-58. doi: 10.1002/jcb.20700.
14. Shadfan M, Lopez-Pajares V, Yuan ZM. MDM2 and MDMX: Alone and together in regulation of p53. Transl Cancer Res. 2012; 1: 88-9.
15. Tollini LA, Jin A, Park J, Zhang Y. Regulation of p53 by Mdm2 E3 ligase function is dispensable in embryogenesis and development, but essential in response to DNA damage. Cancer Cell. 2014; 26: 235-47. doi: 10.1016/j.ccr.2014.06.006.
16. Wei X, Wu S, Song T, Chen L, Gao M, Borcherds W, Daughdrill GW, Chen J. Secondary interaction between MDMX and p53 core domain inhibits p53 DNA binding. Proc Natl Acad Sci U S A. 2016; 113: E2558-63. doi: 10.1073/pnas.1603838113.
17. Montes de Oca Luna R, Wagner DS, Lozano G. Rescue of early embryonic lethality in mdm2-deficient mice by deletion of p53. Nature. 1995; 378: 203-6. doi: 10.1038/378203a0.
18. Jones SN, Roe AE, Donehower LA, Bradley A. Rescue of embryonic lethality in Mdm2-deficient mice by absence of p53. Nature. 1995; 378: 206-8. doi: 10.1038/378206a0.
19. Parant J, Chavez-Reyes A, Little NA, Yan W, Reinke V, Jochemsen AG, Lozano G. Rescue of embryonic lethality in Mdm4-null mice by loss of Trp53 suggests a nonoverlapping pathway with MDM2 to regulate p53. Nat Genet. 2001; 29: 92-5. doi: 10.1038/ng714.
20. Toledo F, Krummel KA, Lee CJ, Liu CW, Rodewald LW, Tang M, Wahl GM. A mouse p53 mutant lacking the proline-rich domain rescues Mdm4 deficiency and provides insight into the Mdm2-Mdm4-p53 regulatory network. Cancer Cell. 2006; 9: 273-85. doi: 10.1016/j.ccr.2006.03.014.
21. Garcia D, Warr MR, Martins CP, Brown Swigart L, Passegue E, Evan GI. Validation of MdmX as a therapeutic target for reactivating p53 in tumors. Genes Dev. 2011; 25: 1746-57. doi: 10.1101/gad.16722111.
22. Abbas HA, Maccio DR, Coskun S, Jackson JG, Hazen AL, Sills TM, You MJ, Hirschi KK, Lozano G. Mdm2 is required for survival of hematopoietic stem cells/progenitors via dampening of ROS-induced p53 activity. Cell Stem Cell. 2010; 7: 606-17. doi: 10.1016/j.stem.2010.09.013.
23. He G, Zhang YW, Lee JH, Zeng SX, Wang YV, Luo Z, Dong XC, Viollet B, Wahl GM, Lu H. AMP-activated protein kinase induces p53 by phosphorylating MDMX and inhibiting its activity. Mol Cell Biol. 2014; 34: 148-57. doi: 10.1128/MCB.00670-13.
24. Shvarts A, Steegenga WT, Riteco N, van Laar T, Dekker P, Bazuine M, van Ham RC, van der Houven van Oordt W, Hateboer G, van der Eb AJ, Jochemsen AG. MDMX: a novel p53-binding protein with some functional properties of MDM2. EMBO J. 1996; 15: 5349-57.
25. Pant V, Xiong S, Iwakuma T, Quintas-Cardama A, Lozano G. Heterodimerization of Mdm2 and Mdm4 is critical for regulating p53 activity during embryogenesis but dispensable for p53 and Mdm2 stability. Proc Natl Acad Sci U S A. 2011; 108: 11995-2000. doi: 10.1073/pnas.1102241108.
26. Francoz S, Froment P, Bogaerts S, De Clercq S, Maetens M, Doumont G, Bellefroid E, Marine JC. Mdm4 and Mdm2 cooperate to inhibit p53 activity in proliferating and quiescent cells in vivo. Proc Natl Acad Sci U S A. 2006; 103: 3232-7. doi: 10.1073/pnas.0508476103.
27. Meng X, Franklin DA, Dong J, Zhang Y. MDM2-p53 pathway in hepatocellular carcinoma. Cancer Res. 2014; 74: 7161-7. doi: 10.1158/0008-5472.CAN-14-1446.
28. Li T, Liu X, Jiang L, Manfredi J, Zha S, Gu W. Loss of p53-mediated cell-cycle arrest, senescence and apoptosis promotes genomic instability and premature aging. Oncotarget. 2016; 7: 11838-49. doi: 10.18632/oncotarget.7864.
29. Qiang L, Kon N, Zhao W, Jiang L, Knight CM, Welch C, Pajvani U, Gu W, Accili D. Hepatic SirT1-Dependent Gain of Function of Stearoyl-CoA Desaturase-1 Conveys Dysmetabolic and Tumor Progression Functions. Cell Rep. 2015; 11: 1797-808. doi: 10.1016/j.celrep.2015.05.025.
30. Liu S, Kim TH, Franklin DA, Zhang Y. Protection against High-Fat-Diet-Induced Obesity in MDM2C305F Mice Due to Reduced p53 Activity and Enhanced Energy Expenditure. Cell Rep. 2017; 18: 1005-18. doi: 10.1016/j.celrep.2016.12.086.
31. Gallagher EJ, LeRoith D. Insulin, insulin resistance, obesity, and cancer. Curr Diab Rep. 2010; 10: 93-100. doi: 10.1007/s11892-010-0101-y.
32. Guh DP, Zhang W, Bansback N, Amarsi Z, Birmingham CL, Anis AH. The incidence of co-morbidities related to obesity and overweight: a systematic review and meta-analysis. BMC Public Health. 2009; 9: 88. doi: 10.1186/1471-2458-9-88.
33. Caldwell SH, Crespo DM, Kang HS, Al-Osaimi AM. Obesity and hepatocellular carcinoma. Gastroenterology. 2004; 127: S97-103.
34. Marrero JA, Fontana RJ, Su GL, Conjeevaram HS, Emick DM, Lok AS. NAFLD may be a common underlying liver disease in patients with hepatocellular carcinoma in the United States. Hepatology. 2002; 36: 1349-54. doi: 10.1053/jhep.2002.36939.
35. Michelotti GA, Machado MV, Diehl AM. NAFLD, NASH and liver cancer. Nat Rev Gastroenterol Hepatol. 2013; 10: 656-65. doi: 10.1038/nrgastro.2013.183.
36. Gabriely I, Ma XH, Yang XM, Atzmon G, Rajala MW, Berg AH, Scherer P, Rossetti L, Barzilai N. Removal of visceral fat prevents insulin resistance and glucose intolerance of aging: an adipokine-mediated process? Diabetes. 2002; 51: 2951-8.
37. Ibrahim MM. Subcutaneous and visceral adipose tissue: structural and functional differences. Obes Rev. 2010; 11: 11-8. doi: 10.1111/j.1467-789X.2009.00623.x.
38. Weisberg SP, McCann D, Desai M, Rosenbaum M, Leibel RL, Ferrante AW Jr. Obesity is associated with macrophage accumulation in adipose tissue. J Clin Invest. 2003; 112: 1796-808. doi: 10.1172/JCI19246.
39. Odegaard JI, Ricardo-Gonzalez RR, Goforth MH, Morel CR, Subramanian V, Mukundan L, Red Eagle A, Vats D, Brombacher F, Ferrante AW, Chawla A. Macrophage-specific PPARgamma controls alternative activation and improves insulin resistance. Nature. 2007; 447: 1116-20. doi: 10.1038/nature05894.
40. Ricardo-Gonzalez RR, Red Eagle A, Odegaard JI, Jouihan H, Morel CR, Heredia JE, Mukundan L, Wu D, Locksley RM, Chawla A. IL-4/STAT6 immune axis regulates peripheral nutrient metabolism and insulin sensitivity. Proc Natl Acad Sci U S A. 2010; 107: 22617-22. doi: 10.1073/pnas.1009152108.
41. Sun S, Ji Y, Kersten S, Qi L. Mechanisms of inflammatory responses in obese adipose tissue. Annu Rev Nutr. 2012; 32: 261-86. doi: 10.1146/annurev-nutr-071811-150623.
42. Yoon KW, Byun S, Kwon E, Hwang SY, Chu K, Hiraki M, Jo SH, Weins A, Hakroush S, Cebulla A, Sykes DB, Greka A, Mundel P, et al. Control of signaling-mediated clearance of apoptotic cells by the tumor suppressor p53. Science. 2015; 349: 1261669. doi: 10.1126/science.1261669.
43. Jakobsson A, Jorgensen JA, Jacobsson A. Differential regulation of fatty acid elongation enzymes in brown adipocytes implies a unique role for Elovl3 during increased fatty acid oxidation. Am J Physiol Endocrinol Metab. 2005; 289: E517-26. doi: 10.1152/ajpendo.00045.2005.
44. Westerberg R, Mansson JE, Golozoubova V, Shabalina IG, Backlund EC, Tvrdik P, Retterstol K, Capecchi MR, Jacobsson A. ELOVL3 is an important component for early onset of lipid recruitment in brown adipose tissue. J Biol Chem. 2006; 281: 4958-68. doi: 10.1074/jbc.M511588200.
45. Jorgensen JA, Zadravec D, Jacobsson A. Norepinephrine and rosiglitazone synergistically induce Elovl3 expression in brown adipocytes. Am J Physiol Endocrinol Metab. 2007; 293: E1159-68. doi: 10.1152/ajpendo.00213.2007.
46. Jakobsson A, Westerberg R, Jacobsson A. Fatty acid elongases in mammals: their regulation and roles in metabolism. Prog Lipid Res. 2006; 45: 237-49. doi: 10.1016/j.plipres.2006.01.004.
47. Sassa T, Kihara A. Metabolism of very long-chain Fatty acids: genes and pathophysiology. Biomol Ther (Seoul). 2014; 22: 83-92. doi: 10.4062/biomolther.2014.017.
48. Poyurovsky MV, Priest C, Kentsis A, Borden KL, Pan ZQ, Pavletich N, Prives C. The Mdm2 RING domain C-terminus is required for supramolecular assembly and ubiquitin ligase activity. EMBO J. 2007; 26: 90-101. doi: 10.1038/sj.emboj.7601465.
49. Uldrijan S, Pannekoek WJ, Vousden KH. An essential function of the extreme C-terminus of MDM2 can be provided by MDMX. EMBO J. 2007; 26: 102-12. doi: 10.1038/sj.emboj.7601469.
50. Wang X, Jiang X. Mdm2 and MdmX partner to regulate p53. FEBS Lett. 2012; 586: 1390-6. doi: 10.1016/j.febslet.2012.02.049.
51. Li M, Gu W. A critical role for noncoding 5S rRNA in regulating Mdmx stability. Mol Cell. 2011; 43: 1023-32. doi: 10.1016/j.molcel.2011.08.020.
52. Marine JC, Lozano G. Mdm2-mediated ubiquitylation: p53 and beyond. Cell Death Differ. 2010; 17: 93-102. doi: 10.1038/cdd.2009.68.
53. Puzio-Kuter AM. The Role of p53 in Metabolic Regulation. Genes Cancer. 2011; 2: 385-91. doi: 10.1177/1947601911409738.
54. Matoba S, Kang JG, Patino WD, Wragg A, Boehm M, Gavrilova O, Hurley PJ, Bunz F, Hwang PM. p53 regulates mitochondrial respiration. Science. 2006; 312: 1650-3. doi: 10.1126/science.1126863.
55. Zhang Q, Lu H. Identification of small molecules affecting p53-MDM2/MDMX interaction by fluorescence polarization. Methods Mol Biol. 2013; 962: 95-111. doi: 10.1007/978-1-62703-236-0_8.
56. Zhang Q, Zeng SX, Lu H. Targeting p53-MDM2-MDMX loop for cancer therapy. Subcell Biochem. 2014; 85: 281-319. doi: 10.1007/978-94-017-9211-0_16.
57. Grier JD, Xiong S, Elizondo-Fraire AC, Parant JM, Lozano G. Tissue-specific differences of p53 inhibition by Mdm2 and Mdm4. Mol Cell Biol. 2006; 26: 192-8. doi: 10.1128/MCB.26.1.192-198.2006.
58. Kon N, Kobayashi Y, Li M, Brooks CL, Ludwig T, Gu W. Inactivation of HAUSP in vivo modulates p53 function. Oncogene. 2010; 29: 1270-9. doi: 10.1038/onc.2009.427.