
INTRODUCTION
Chronic kidney disease (CKD), characterized by reduced glomerular filtration rate (GFR) or abnormal urinary albumin excretion [1, 2], is regarded as a part of a subclinical and generalized atherothrombosis [3]. It is seemed as a silent killer due to very mild symptoms and going unnoticed for a long time. Epidemiological investigation showed that the prevalence of CKD is approximately from 8% to 16% in various regions [4–8]. Now CKD is increasingly common in both developed and developing countries and rapidly becoming a global public health concern.
CKD is deemed to share many traditional atherosclerosis risk factors including diabetes, hypertension, and smoking with cardiovascular diseases [9–11]. However, these traditional risk factors cannot fully account for this high prevalence of CKD. Other non-traditional risk factors such as endothelial dysfunction, hemodynamic, and chronic inflammation have increasingly been studied [3, 12, 13].
It is known that the endothelium is highly distributed among all organ systems [14]. Due to the specialized and variable nature of the endothelium, the kidney tends to be a target organ in systemic disease [15]. It has been shown that renal function is closely related to endothelial dysfunction in an elderly general population with mildly impaired renal function [16].
Wall shear stress (WSS), also called endothelial shear stress, is one of the most important hemodynamic forces that are exerted by circulating blood on the endothelial cell layer of the inner vessel wall [17, 18]. It represents the tangential force per unit area exerted by flowing blood on the endothelial surface of the vascular wall and plays an important role in vascular remodeling and atherogenesis [19, 20]. Different WSSs are thought to have different effects on vascular activities [20, 21]. Generally, low or oscillatory WSS is regarded as a reliable indicator for vascular endothelial dysfunction [17–21].
Some studies [22, 23] have investigated the correlation renal function with either carotid artery WSS or brachial artery WSS in recent decades. However, the findings were inconsistencies. The possible relationship between local WSS and renal function has not been fully explored and illuminated although there are some studies made lots of efforts [22–25].
As a well established “observation window” for systemic structure and arterial function in humans and supplies a very precise regulation of blood flow [26], the common carotid artery (CCA) WSS may also represent the overall hemodynamic condition of the renal vessels [22, 25]. We hypothesized that carotid WSS is independently correlated with renal function in the elderly. And, in some extent, carotid WSS may be an important predictive factor of mildly impaired renal function. The main goal of the present study was to investigate and illuminate this relationship.
RESULTS
Demographic and clinical characteristics
The demographic and clinical characteristics of all subjects are summarized in Table 1. The interquartile of mean WSS was <0.85, 0.85-1.06, 1.07-1.26, and >1.26 Pa, and peak WSS was <1.49, 1.49-1.82, 1.83-2.15, and >2.15 Pa.
Table 1: Clinical and biochemical characteristics of total participants
Clinical parameters |
Value |
|---|---|
Age, years |
70.70±6.15 |
Sex, Female:Male |
380:381 |
Systolic blood pressure, mm Hg |
141.33±13.72 |
Diastolic blood pressure, mm Hg |
69.73±7.05 |
Body mass index, kg/m2 |
24.31±2.86 |
Biochemical parameters |
|
Total cholesterol, mmol/L |
4.57±0.66 |
Triglycerides, mmol/L |
1.45±0.34 |
High-density lipoprotein cholesterol, mmol/L |
1.14±0.18 |
Low- density lipoprotein cholesterol, mmol/L |
2.77±0.63 |
Fasting plasma glucose, mmol/L |
5.303±0.91 |
Creatinine, mg/dl |
0.78 (0.66, 0.91) |
Cystatin C, mg/L |
093±0.21 |
Urinary albumin, mg/L |
1.26 (0.81, 1.92) |
Covariates |
|
Smoking, n (%) |
178 (23.39) |
Alcohol intake, n (%) |
311 (40.87) |
Hypertension, n (%) |
489 (64.26) |
Antihypertensive medication, n (%) |
445 (91.00) |
Diabetes, n (%) |
93 (12.22) |
Lowering glucose medication, n (%) |
87 (93.55) |
Dyslipidemia, n (%) |
220 (28.91) |
Anti-dyslipidemia medication, n (%) |
108 (19.09) |
Carotid plaque, n (%) |
262 (34.43) |
Carotid wall shear stress |
|
Carotid mean wall shear stress, Pa |
1.06±0.28 |
Carotid peak wall shear stress, Pa |
1.84±0.45 |
Endothelial function and inflammatory parameters |
|
Brachial artery flow-mediated dilation, % |
11.84±3.03 |
Nitric oxide, μmol/L |
63.08±14.50 |
Endothelin-1, pg/ml |
42.28±9.09 |
Intercellular adhesion molecule-1, ng/ml |
140.39±35.30 |
Vascular cell adhesion molecule-1, ng/ml |
613.58 (544.56, 699.06) |
Renal function parameters |
|
eGFRCr, ml·min-1·1.73m-2 |
82.52±17.48 |
eGFRCysC, ml·min-1·1.73m-2 |
81.48±20.77 |
eGFRCr-CysC, ml·min-1·1.73m-2 |
83.17±18.96 |
Albumin/creatinine ratio, mg/g |
17.59±7.25 |
Continuous data are expressed as mean ± standard deviation or as median with interquartile range depending on the normality of the data. Categorical data are expressed as numbers (percentages). eGFRCr indicates estimated glomerular filtration rate base on creatinine; eGFRCysC, estimated glomerular filtration rate base on cystatin C; eGFRCr-CysC, estimated glomerular filtration rate base on creatinine and cystatin C.
Table 2 shows the demographic and clinical characteristics of subjects grouped by interquartile of mean WSS. The brachial artery flow-mediated dilation (FMD) and serum nitric oxide (NO) significantly increased, and the serum endothelin-1 (ET-1) and intercellular adhesion molecule-1 (ICAM-1) decreased from Q1 to Q4 according to the respective group. The differences were significant between any two groups (all P <0.05). The vascular cell adhesion molecule-1 (VCAM-1) was markedly lower in Q4 than in Q1, Q2, and Q3, and lower in Q2 and Q3 than in Q1 (all P <0.05).
Table 2: Clinical and biochemical characteristics of participants grouped by the interquartile of carotid mean wall shear stress
|
Q1 |
Q2 |
Q3 |
Q4 |
P value |
|---|---|---|---|---|---|
Clinical parameters |
|||||
Age, years |
72.33±6.29 |
71.91±6.07 |
70.15±6.10*,† |
68.41±5.33*,† |
<0.001 |
Sex, Male:Female |
95:97 |
99:90 |
93:97 |
94:96 |
0.907 |
BMI, kg/m2 |
24.73±2.80 |
24.41±2.90 |
24.23±3.01 |
23.89±2.68* |
0.037 |
SBP, mm Hg |
146.28±13.49 |
142.67±12.74* |
140.86±13.39* |
135.47±13.07*,†,‡ |
<0.001 |
DBP, mm Hg |
69.82±7.29 |
70.65±6.75 |
68.97±7.12 |
69.48±6.97 |
0.129 |
Biochemical parameters |
|||||
TCHO, mmol/L |
4.61±0.68 |
4.60±0.65 |
4.57±0.64 |
4.51±0.66 |
0.509 |
TG, mmol/L |
1.46±0.38 |
1.43±0.33 |
1.46±0.33 |
1.45±0.34 |
0.852 |
HDL-c, mmol/L |
1.12±0.17 |
1.11±0.18 |
1.14±0.18 |
1.16±0.19 |
0.246 |
LDL-c, mmol/L |
2.82±0.67 |
2.81±0.63 |
2.76±0.61 |
2.70±0.62 |
0.208 |
FPG, mmol/L |
5.38±0.95 |
5.44±1.02 |
5.30±0.92 |
5.18±0.74* |
0.033 |
Cr, mg/dl |
0.85 (0.71, 1.06) |
0.82 (0.70, 0.96)* |
0.78 (0.64, 0.89)*,† |
0.8 (0.60, 0.79)*,†,‡ |
<0.001 |
Cys C, mg/L |
1.03±0.17 |
0.98±0.21* |
0.93±0.19* |
0.78±0.18*,†,‡ |
<0.001 |
UA, mg/L |
1.92 (1.38, 2.82) |
1.42 (0.96, 2.07)* |
1.13 (0.80, 1.72)*,† |
0.78 (0.54, 1.05)*,†,‡ |
<0.001 |
Covariates |
|||||
Current smoker, n (%) |
36 (18.75) |
50 (26.46) |
46 (24.21) |
46 (24.21) |
0.329 |
Alcohol consumption, n (%) |
54 (28.13) |
83 (43.92)* |
83 (43.68)* |
89 (46.84)* |
0.001 |
Hypertension, n (%) |
146 (76.04) |
133 (70.37) |
117 (61.58)* |
93 (48.95)*,†,‡ |
<0.001 |
Antihypertension, n (%) |
133 (91.10) |
121 (90.98) |
106 (90.60) |
84 (90.32) |
0.997 |
Diabetes, n (%) |
21 (10.94) |
25 (13.23) |
26 (13.68) |
21 (11.05) |
0.855 |
Antidiabetes, n (%) |
20 (95.24) |
22 (88.00) |
25 (96.15) |
20 (95.24) |
0.622 |
Dyslipidemia, n (%) |
58 (30.21) |
49 (25.93) |
53 (27.89) |
60 (31.58) |
0.630 |
Anti-dyslipidemia, n (%) |
31 (53.45) |
26 (53.06) |
24 (45.28) |
27 (45.00) |
0.692 |
Carotid plaque, n (%) |
112 (58.33) |
68 (35.98) * |
63 (33.16) * |
19 (10.00) *,†,‡ |
<0.001 |
Endothelial function parameters |
|||||
Brachial artery FMD, % |
9.56±2.44 |
11.01±2.47* |
12.44±2.57*,† |
14.39±2.30*,†,‡ |
<0.001 |
NO, μmol/L |
51.39±11.93 |
60.17±10.70* |
65.14±11.84*,† |
75.71±11.63*,†,‡ |
<0.001 |
ET-1, pg/ml |
49.06±8.24 |
44.13±8.20* |
40.58±7.24*,† |
35.27±6.46*,†,‡ |
<0.001 |
ICAM-1, ng/ml |
164.00±37.21 |
143.59±33.03* |
132.31±29.49*,† |
121.45±25.58*,†,‡ |
<0.001 |
VCAM-1, ng/ml |
674.94 (605.92, 766.98) |
636.59 (582.91, 708.31)* |
613.58 (550.73, 699.30)* |
544.56 (480.19, 613.58)*,†,‡ |
<0.001 |
Data are mean±standard deviation or number (percentage). Q1 indicates the first interquartile; Q2, the second interquartile; Q3, the third interquartile; Q4, the forth interquartile; BMI, body mass index; SBP, systolic blood pressure; DBP, diastolic blood pressure; TCHO, total cholesterol; TG, triglycerides; HDL-c, high-density lipoprotein cholesterol; LDL-c, low-density lipoprotein cholesterol; Cr, creatinine; Cys C, cystatin C; UA, Urinary albumin; FMD, flow-mediated dilation; NO, nitric oxide; ET-1, endothelin-1; ICAM-1, intercellular adhesion molecule-1; VCAM-1, vascular cell adhesion molecule-1. *P <0.05, as compared to Q1; †P <0.05, as compared to Q2; ‡P <0.05, as compared to Q3.
Supplementary Table 1 shows the demographic and clinical characteristics of subjects grouped by interquartile of peak WSS. The FMD significantly increased from Q1 to Q4 according to the respective group, and differences were significant between any two groups (all P <0.05). There was an increasing trend in NO, and decreasing trends in ET-1, ICAM-1, and VCAM-1 from Q1 to Q4. Compared with Q1, Q2, and Q3, the NO was significantly higher, and the ET-1, ICAM-1, and VCAM-1 were lower in Q4 (all P <0.05).
Effect of mean WSS on renal function
Table 3 depicts the details of the estimated glomerular filtration rate base on creatinine (eGFRCr), estimated glomerular filtration rate base on cystatin C (eGFRCysC), estimated glomerular filtration rate base on creatinine and cystatin C (eGFRCr-CysC), and albumin/creatinine ratio (ACR) in the four groups classified by the interquartile of the mean WSS. The eGFRCr, eGFRCysC, and eGFRCr-CysC significantly increased, and ACR decreased from Q1 to Q4, and difference were significant between any two groups (all P <0.05).
Table 3: Estimated glomerular filtration rates and albumin/creatinine ratio of participants grouped by the interquartile of carotid mean wall shear stress
|
Q1 |
Q2 |
Q3 |
Q4 |
P value |
|---|---|---|---|---|---|
eGFRCr, ml·min-1·1.73m-2 |
72.37±18.40 |
79.67±15.88* |
84.74±15.67*,† |
93.39±12.37*,†,‡ |
<0.001 |
eGFRCysC, ml·min-1·1.73m-2 |
70.04±16.39 |
76.74±19.42* |
82.31±19.21* |
96.91±18.00*,†,‡ |
<0.001 |
eGFRCr-CysC, ml·min-1·1.73m-2 |
71.38±16.66 |
78.87±16.04* |
84.67±16.77*,† |
97.87±14.96*,†,‡ |
<0.001 |
ACR, mg/g |
23.04±6.93 |
18.69±6.56* |
16.36±6.11*,† |
12.22±4.54*,†,‡ |
<0.001 |
Data are mean±standard deviation. Q1 indicates the first interquartile; Q2, the second interquartile; Q3, the third interquartile; Q4, the forth interquartile; eGFRCr, estimated glomerular filtration rate base on creatinine; eGFRCysC, estimated glomerular filtration rate base on cystatin C; eGFRCr-CysC, estimated glomerular filtration rate base on creatinine and cystatin C; ACR, albumin/creatinine ratio. *P <0.05, as compared to Q1; †P <0.05, as compared to Q2; ‡P <0.05, as compared to Q3.
The Pearson correlation analysis indicates that mean WSS was positively correlated with the eGFRCr, eGFRCysC, and eGFRCr-CysC, and inversely correlated with ACR (all P <0.001, Figure 1).
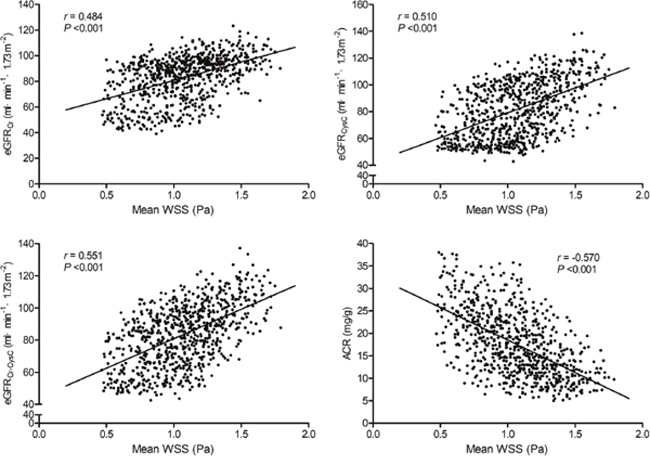
Figure 1: Correlations of carotid mean wall shear stress with the eGFRCr, eGFRCysC, eGFRCr-CysC, and ACR. WSS indicates wall shear stress; eGFRCr, estimated glomerular filtration rate base on creatinine; eGFRCysC, estimated glomerular filtration rate base on cystatin C; eGFRCr-CysC, estimated glomerular filtration rate base on creatinine and cystatin C; ACR, albumin/creatinine ratio.
Effect of peak WSS on renal function
We also assessed the effect of peak WSS on the renal function. Supplementary Table 2 depicts the details of the eGFRCr, eGFRCysC, eGFRCr-CysC, and ACR in the four groups classified by the interquartile of the peak WSS. The eGFRCr, eGFRCysC, and eGFRCr-CysC were markedly higher, and the ACR was lower in Q4 than in Q1, Q2, and Q3 (all P <0.05). The eGFRCr and eGFRCr-CysC were markedly higher, the ACR was lower in Q2 and Q3 than in Q1 (all P <0.05). The eGFRCysC was higher in Q3 than in Q1 (P <0.05).
Consistent with the mean WSS, the peak WSS was positively correlated with the eGFRCr, eGFRCysC, and eGFRCr-CysC, and inversely correlated with ACR (all P <0.001, Supplementary Figure 1)
Carotid WSS independently associated with renal function
To explore the association of mean WSS with renal function, we first adjusted for age and sex in model 1. We found that the mean WSS independently and positively associated with eGFRCr, eGFRCysC, and eGFRCr-CysC, and negatively related to ACR (all P <0.001). For further identify these associations, we then adjusted for smoking and alcohol intake in model 2, and for body mass index, hypertension, antihypertensive medication, diabetes, lower glucose medication, dyslipidemia, anti-dyslipidemia medication, blood pressure, fasting blood glucose, blood lipids, and carotid artery plaque in model 3. The results showed that the independent associations were still remained (Table 4).
Table 4: Regression coefficients (95%) of carotid mean wall shear stress with renal function parameters
|
eGFRCr |
eGFRCysC |
eGFRCr-CysC |
ACR |
||||
|---|---|---|---|---|---|---|---|---|
Beta coefficient |
P value |
Beta coefficient |
P value |
Beta coefficient |
P value |
Beta coefficient |
P value |
|
Model 1a |
18.696 (15.449, 21.943) |
<0.001 |
30.194 (26.149, 34.239) |
<0.001 |
28.960 (25.288, 32.631) |
<0.001 |
-14.338 (-15.929, -12.748) |
<0.001 |
Model 2b |
18.972 (15.720, 22.224) |
<0.001 |
30.347 (26.293, 34.402) |
<0.001 |
29.244 (25.568, 32.919) |
<0.001 |
-14.321 (-15.919, -12.724) |
<0.001 |
Model 3c |
17.840 (14.334, 21.346) |
<0.001 |
23.394 (18.908, 27.880) |
<0.001 |
23.382 (19.677, 27.088) |
<0.001 |
-11.064 (-12.659, -9.469) |
<0.001 |
eGFRCr indicates estimated glomerular filtration rate base on creatinine; eGFRCysC, estimated glomerular filtration rate base on cystatin C; eGFRCr-CysC, estimated glomerular filtration rate base on creatinine and cystatin C; ACR, albumin/creatinine ratio.
aModel 1: adjusted for age, sex.
bModel 2: model 1 + smoking and alcohol intake.
cModel 3: model 2 + body mass index, hypertension, diabetes, dyslipidemia, blood pressure, fasting blood glucose, blood lipids, and carotid artery plaque.
Similar to the mean WSS, the peak WSS was independently and positively associated with eGFRCr, eGFRCysC, and eGFRCr-CysC, and negatively related to ACR after adjustment for same confounders included in the models of the mean WSS (Supplementary Table 3).
Correlations between carotid WSS and biomarkers of endothelial function
We also assessed the correlations of the mean WSS and peak WSS with the FMD, NO, ET-1, ICAM-1, and VCAM-1. We found that mean WSS (Table 5) and peak WSS (Supplementary Table 4) were strong and positively related to FMD and NO, and negatively related to ET-1, ICAM-1, and VCAM-1 after adjustment for confounders in Table 1, including age, sex, smoking, alcohol intake, body mass index, hypertension, antihypertensive medication, diabetes, lower glucose medication, dyslipidemia, anti-dyslipidemia medication, blood pressure, fasting blood glucose, blood lipids, and carotid artery plaque.
Table 5: Correlations between carotid mean wall shear stress and biomarkers of endothelial function and inflammation
|
Pearson correlation analysis |
Partial correlations analysisa |
||
|---|---|---|---|---|
Correlation coefficient |
P value |
Correlation coefficient |
P value |
|
Brachial artery flow-mediated dilation, % |
0.637 |
<0.001 |
0.557 |
<0.001 |
Nitric oxide, μmol/L |
0.643 |
<0.001 |
0.551 |
<0.001 |
Endothelin-1, pg/ml |
-0.589 |
<0.001 |
-0.489 |
<0.001 |
Intercellular adhesion molecule-1, ng/ml |
-0.465 |
<0.001 |
-0.350 |
<0.001 |
Vascular cell adhesion molecule-1, ng/ml |
-0.428 |
<0.001 |
-0.304 |
<0.001 |
a adjusted for age, sex, smoking, alcohol intake, body mass index, hypertension, diabetes, dyslipidemia, blood pressure, fasting blood glucose, blood lipids, and carotid artery plaque.
Correlations between renal function and biomarkers of endothelial function
We also assessed the correlations of the FMD, NO, ET-1, ICAM-1, and VCAM-1 with the eGFRCr, eGFRCysC, eGFRCr-CysC, and ACR. We found that FMD and NO were positively related to eGFRCr, eGFRCysC, and eGFRCr-CysC, and negatively related to ACR, but ET-1, ICAM-1, and VCAM-1 were negatively related to eGFRCr, eGFRCysC, and eGFRCr-CysC, and positively related to ACR even after adjustment for age, sex, smoking, alcohol intake, body mass index, hypertension, antihypertensive medication, diabetes, lower glucose medication, dyslipidemia, anti-dyslipidemia medication, blood pressure, fasting blood glucose, blood lipids, and carotid artery plaque (Table 6).
Table 6: Correlations between renal function and biomarkers of endothelial function and inflammation
|
eGFRCr |
eGFRCysC |
eGFRCr-CysC |
ACR |
||||
|---|---|---|---|---|---|---|---|---|
Correlation coefficient |
P value |
Correlation coefficient |
P value |
Correlation coefficient |
P value |
Correlation coefficient |
P value |
|
A. Pearson correlation analysis |
||||||||
Brachial artery flow-mediated dilation, % |
0.536 |
<0.001 |
0.497 |
<0.001 |
0.575 |
<0.001 |
-0.504 |
<0.001 |
Nitric oxide, μmol/L |
0.513 |
<0.001 |
0.529 |
<0.001 |
0.584 |
<0.001 |
-0.503 |
<0.001 |
Endothelin-1, pg/ml |
-0.515 |
<0.001 |
-0.486 |
<0.001 |
-0.554 |
<0.001 |
0.476 |
<0.001 |
Intercellular adhesion molecule-1, ng/ml |
-0.552 |
<0.001 |
-0.417 |
<0.001 |
-0.527 |
<0.001 |
0.440 |
<0.001 |
Vascular cell adhesion molecule-1, ng/ml |
-0.400 |
<0.001 |
-0.480 |
<0.001 |
-0.495 |
<0.001 |
0.409 |
<0.001 |
B. Partial correlations analysisa |
||||||||
Brachial artery flow-mediated dilation, % |
0.380 |
<0.001 |
0.344 |
<0.001 |
0.429 |
<0.001 |
-0.366 |
<0.001 |
Nitric oxide, μmol/L |
0.350 |
<0.001 |
0.374 |
<0.001 |
0.432 |
<0.001 |
-0.355 |
<0.001 |
Endothelin-1, pg/ml |
-0.360 |
<0.001 |
-0.329 |
<0.001 |
-0.400 |
<0.001 |
0.326 |
<0.001 |
Intercellular adhesion molecule-1, ng/ml |
-0.432 |
<0.001 |
-0.226 |
<0.001 |
-0.363 |
<0.001 |
0.264 |
<0.001 |
Vascular cell adhesion molecule-1, ng/ml |
-0.268 |
<0.001 |
-0.339 |
<0.001 |
-0.363 |
<0.001 |
0.264 |
<0.001 |
a adjusted for age, sex, smoking, alcohol intake, body mass index, hypertension, diabetes, dyslipidemia, blood pressure, fasting blood glucose, blood lipids, and carotid artery plaque. eGFRCr indicates estimated glomerular filtration rate base on creatinine; eGFRCysC, estimated glomerular filtration rate base on cystatin C; eGFRCr-CysC, estimated glomerular filtration rate base on creatinine and cystatin C; ACR, albumin/creatinine ratio.
DISCUSSION
The primary objective of our study was to investigate the correlation of the carotid WSS with renal function in the elderly. The most important findings were those (1) the mean and peak carotid WSS were independently associated with eGFR derived from serum concentrations of creatinine and/or cystatin C using three CKD-EPI (the Chronic Kidney Disease Epidemiology Collaboration) equations and ACR after adjustment for confounders; (2) the carotid WSS was strongly related to endothelial function; and (3) the endothelial function was closely related to renal function. It indicates that rheologic forces may contribute to the crucial effects on renal dysfunction in the elderly. The effects may be mediated by regulation of endothelial function.
In the past decade, as regarding as an important factor of CKD, the hemodynamic has been increasingly emphasized. Verbeke and colleagues [23] reported that brachial artery WSS is significantly lower in patients with end-stage renal disease than in healthy subjects although their brachial artery blood flow is similar. In patients with CKD, the mean and maximum brachial artery wall shear rates were significantly lower than in healthy subjects [25]. Samijo and coworkers [24] assessed WSS in the CCA in end-stage renal failure patients. They found that mean WSS in end-stage renal failure patients who were prior to hemodialysis is significantly lower compared with presumed healthy age- and sex-matched control subjects. However, the studies did not clearly illuminate the relationship between WSS and renal function, and not deeply explore the mechanism of WSS on the renal function.
In the present study, we assessed the mean and peak carotid WSS in 761 community-dwelling elderly using a high-resolution ultrasound. We found that the minimum mean WSS of the right or left CCA was independently and positively correlated with eGFRs that estimated by creatinine and/or cystatin C, and negatively correlated with ACR even after adjustment for confounders. The similar findings were found between peak WSS and eGFRs and ACR. It demonstrates that carotid WSS may play an important role in renal function in the elderly.
It has been well characterized that the endothelial cells response to fluid shear stress [18]. WSS emerges as a major regulator of a large number of endothelial mediators. Under sustained high shear stress, vascular endothelial cells exhibit upregulation of vasodilator NO and down-regulation of vasoconstrictor ET-1, inflammatory adhesion molecules such as ICAM-1 and VCAM-1 [18]. Base on these mechanisms, brachial artery FMD is widely used as a simple and noninvasive clinical indicator of endothelial function [23].
To investigate the mechanism of WSS on the renal function, we investigated the correlations of carotid WSS with endothelial function. We found that the brachial artery FMD and serum NO were significantly higher, and the serum ET-1, ICAM-1, and VCAM-1 were lower in the highest WSS interquartile group than in the lowest WSS interquartile group. After adjusting for confounders, the carotid artery mean WSS and peak WSS were strongly correlated with these endothelial function biomarkers.
In addition, we also investigated the correlations between renal function and endothelial function in the present study. We found that renal function, assessed using eGFR and ACR, was closely related to endothelial function. Therefore, our findings suggested that the effect of carotid WSS on renal function may be mediated by regulation of endothelial function.
In the present study, ACR was used to assess the renal endothelial function as well as renal function. As is known that albuminuria, always represented by ACR, is a marker of renal endothelial dysfunction [27]. Albuminuria appears to link renal and cardiovascular organ damage. Meanwhile, albuminuria has been demonstrated to be strongly associated with systemic endothelial dysfunction in diabetic patients as well as in nondiabetic individuals [28, 29].
NO was used as one of biomarkers of endothelial function in the present study. There is argument about the relationship between NO and renal function. Bahadoran and coworkers [30] have reported that serum NO is independently associated with the risk of CKD in women. Higher level of serum NO metabolites, higher risk of CKD. However, most studies [31–33] demonstrated that NO deficiency contributes to progression of CKD. Similar findings were reported by Wever and colleagues who measured the 15N2-labeled arginine-to-citrulline conversion using the more direct approach [34]. We found that serum NO level was positively related to eGFRCr, eGFRCysC, and eGFRCr-CysC, and negatively related to ACR.
A strength of our study is that the eGFR was assessed using two new CKD-EPI equations to correct the imprecision of the common serum creatinine-based CKD-EPI equation. One is serum cystatin C-base eGFR equation and the other is cystatin C combined with creatinine-based equation. The precision of the two equations has been validated [35, 36]. In the present study, the eGFRs derived from the three equations were all closely related to carotid WSS. Another strength is that the minimum mean and peak WSS in both sides of CCA were used for analysis. Studies have demonstrated the lower WSS, the more likely to cause various vascular pathologic including impaired endothelial function [37–39].
Several limitations to this study should be considered. First, the study subjects were predominantly made up of Han recruited from the area of Shandong, China. There were essentially geographical limitations and no racial or ethnic minorities. Our findings need to validate in other ethnic groups and in different regions. Second, only CKD-EPI equations were applied to estimate the GFR. It may induce a certain bias. However, the accuracy of CKD-EPI equations has been validated in Chinese population [36]. Third, we did not address the causal relationship between carotid WSS and renal function owing to the cross-sectional nature of the study. Forth, the genetic background was not considered in the present study. Studies reported that genetic variants are significantly related to eGFR [40, 41]. Finally, the renal WSS was not assessed in the present study. There may be differences between the renal WSS and carotid artery WSS.
MATERIALS AND METHODS
Study population
From May 2009 to October 2012, a total of 761 older subjects aged 60 years and over [mean and standard deviation (SD): 70.70±6.15 years] were eligible and enrolled from community-dwelling in the Shandong area, China. Among them, 380 were women, and 381 were men. Subjects were excluded if they met any of the following exclusion criteria: end stage of renal disease, hemodialysis, cardio-cerebrovascular events including myocardial infarction and stroke in the previous 3 months, heart failure, secondary hypertension, active malignancy, abnormal liver enzymes (alanine aminotransferase and aspartate aminotransferase >3 times than upper normal range), drug and alcohol abuse, and difficulty with providing informed consent.
This study was conducted in compliance with the “Declaration of Helsinki”. The Research Ethics Committee of the Institute of Basic Medicine, Shandong Academy of Medical Sciences approved this study. Written informed consent was obtained from each subject.
Ultrasonography of CCA and calculation of WSS
The CCA ultrasound examinations were performed during morning hours in a quiet and temperature-controlled room (20-25 degrees Celsius). The subjects were demanded to discontinue tea, alcohol, caffeine, smoking, anti-histamine, nitrates, and calcium antagonists for 24 h and to fast for 12 h before the examination. After at least a 10-min acclimatization period, the examination was performed using a high-resolution ultrasound with a 7.5-MHz linear array transducer (Vivid i, GE Medical Systems Ultrasound Israel Ltd, Tirat Carmel, Israel) and electrocardiogram (ECG) triggering by an experienced ultrasonographer who was blinded to the subjects’ clinical details.
CCA intima-media thickness was measured as the distance form the leading edge of the lumen-initima interface to the collagen-containing upper layer of the adventitia. Carotid artery plaque was defined as a intima-media thickness >1.5 mm.
Accordance with previously described [20], the internal diameters of the CCA at the R (IDR) and peak T (IDT) waves on the ECG were measured using two-dimensionally guided continuous M-mode tracings. IDR represents the minimum carotid diameter and IDT indicates maximum carotid diameter. Mean velocity (VM) and peak systolic velocity (VPS), 1-2 cm below the bifurcation, were detected as the mean of three cardiac cycles.
Mean and peak WSS were calculated with the formula [20, 42]:
Mean WSS (Pa) = 8 × η × VM/IDR
Peak WSS (Pa) = 8 × η × VPS/IDT
where η is blood viscosity (Pa·s); V is the velocity (m/s); and ID is the lumen diameter (m). Viscosity is equal to 0.0035 Pa·s, as the carotid artery wall is always assumed to be rigid with blood as a Newtonian fluid [43]. Minimum mean and peak WSS in the right or left CCA were used for further analysis.
Brachial flow-mediated dilation measurement
Brachial artery FMD and CCA ultrasound examinations were performed on the same day. The details of the brachial artery FMD examination have been described in previous studies [44–46]. Briefly, the left brachial artery diameter was measured using a high-resolution ultrasound with a 7.5-MHz linear array transducer (Vivid i, GE Medical Systems Ultrasound Israel Ltd, Tirat Carmel, Israel) at rest and during reactive hyperemia. The reactive hyperemia was induced by inflation of a pneumatic tourniquet placed around the forearm to a pressure of 250 mm Hg for 5 min, followed by a release. Arterial diameter was assessed during the end-diastolic phase at a fixed distance from an anatomic marker at baseline and 60, 90, and 120 s after cuff deflation. The maximum diameter from the 3 assessments was used to calculate FMD. The calculation formula is as follows: FMD (%) = [(maximum diameter - baseline diameter)/baseline diameter] × 100 %.
Serum biomarkers of endothelial function and inflammation measurement
Fasting blood samples were obtained from all subjects and processed within 2 hours. Serum was collected and stored at -80 degrees Celsius until analysis. Serum NO was assessed by the quantification of nitrite using Griess assay [47]. The reagents were purchased from Sigma (St. Louis, MO, USA). Serum ET-1, VCAM-1, and ICAM-1 were measured using enzyme-linked immunosorbent assay (ELISA) kits following the manufacturer’s instructions (Bender MedSystems, Vienna, Austria). All samples were tested in duplicate and the mean value was used for further analyze.
Evaluation of estimated glomerular filtration rate
Renal function was evaluated by an eGFR which calculated from serum creatinine and/or Cystatin C level. Serum creatinine level was detected by the enzymic method (Shanghai Kehua Dongling Diagnostic Products Co., Ltd., China) and cystatin C was measured by the particle-enhanced immunoturbidimetry assay (Beijing Leadman Biomedical Co., Ltd., China) using a Hitachi 7600 automated biochemical analyzer. Three CKD-EPI equations for eGFR [35] were used in the present study:
The equation 1: eGFRCr (ml·min-1·1.73m-2) = 141 × min (Scr/κ, 1)α × max (Scr/κ, 1)-1.209 × 0.993Age [× 1.018 if female] [× 1.159 if black], where Scr is serum creatinine, κ is 0.7 for females and 0.9 for males, α is -0.329 for females and -0.411 for males, min is the minimum of Scr/κ or 1, and max is the maximum of Scr/κ or 1.
The equation 2: eGFRCysC (ml·min-1·1.73m-2) = 133 × min (Scys/0.8, 1)-0.499 × max (Scys/0.8, 1)-1.328 × 0.996Age [× 0.932 if female], where Scys is serum cystatin C, min indicates the minimum of Scys/κ or 1, and max indicates the maximum of Scys/κ or 1.
The equation 3: eGFRCr-CysC (ml·min-1·1.73m-2) = 135 × min(Scr/κ, 1) α × max(Scr/κ, 1)-0.601 × min(Scys/0.8, 1)-0.375 × max(Scys/0.8, 1)-0.711 × 0.995Age [× 0.969 if female] [× 1.08 if black], where Scr is serum creatinine, Scys is serum cystatin C, κ is 0.7 for females and 0.9 for males, α is -0.248 for females and -0.207 for males, min indicates the minimum of Scr/κ or 1, and max indicates the maximum of Scr/κ or 1.
Evaluation of urinary albumin excretion
Urinary albumin excretion was evaluated on the basis of the urinary ACR. Urinary albumin was tested by morning first void sterile urinary spot samples using immunonephelometry.
Statistical analysis
All statistical analyses were carried out using the SPSS for Windows software package, version 22.0 (SPSS Inc., Chicago, IL, USA). Continuous data were expressed as mean ±SD or as median with interquartile range (IQR, 25th and 75th percentiles) depending on the normality of the data. The normality was determined using the Kolmogorov–Smirnov test. Categorical data were expressed as numbers (percentages). Subjects were grouped by the interquartiles of either the mean WSS or peak WSS. The differences in continuous variables among the groups were assessed using one-way analysis of variance (ANOVA) with the Bonferroni procedure or the Kruskal–Wallis test with Wilcoxon rank-sum test. The differences in categorical variables among the groups were assessed using the chi-square test. Pearson correlation coefficients were used to assess the relationships of the mean WSS and peak WSS to eGFRCr, eGFRCysC, eGFRCr-CysC, and ACR. Partial correlations analysis was used to determined the relationships of the mean WSS and peak WSS to FMD, NO, ET-1, ICAM1, and VCAM1, and the relationships of the FMD, NO, ET-1, ICAM1, and VCAM1 to eGFRCr, eGFRCysC, eGFRCr-CysC, and ACR. A multiple linear regression analysis was performed to determine if any factors were independently associated with renal function. Mean WSS and peak WSS were included as an independent factor, respectively, in the regression models. Model 1 was adjusted for age, sex. Model 2 was further adjusted for smoking and alcohol intake, and model 3 was further adjusted for body mass index, hypertension, antihypertensive medication, diabetes, lower glucose medication, dyslipidemia, anti-dyslipidemia medication, blood pressure, fasting blood glucose, and blood lipids. A P-value of <0.05 was considered to be significant.
CONCLUSIONS
In conclusion, there is an independent correlation of carotid WSS with renal function in the elderly. The rheologic forces may play an important role in renal function changing. The correlation may be mediated by regulation of endothelial function. The multi-racial, multi-ethnic, multi-geographic, and longitudinal studies are needed to clarify the role of carotid WSS in CKD.
Abbreviations
CKD: chronic kidney disease; CCA: common carotid artery; WSS: wall shear stress; eGFR: estimated glomerular filtration rate; ACR: albumin/creatinine ratio; Cr: creatinine; Cys C: cystatin C; UA: urinary albumin; FMD: flow-mediated dilation; NO: nitric oxide; ET-1: endothelin-1; ICAM-1: intercellular adhesion molecule-1; VCAM-1: vascular cell adhesion molecule-1; CKD-EPI: the Chronic Kidney Disease Epidemiology Collaboration.
Author contributions
YG and ZL designed the study, collected data, analyzed data, and wrote the manuscript. FW, JW, YZ, and SS collected data and reviewed the manuscript. HZ, analyzed and interpreted data and reviewed the manuscript.
CONFLICTS OF INTEREST
The authors declare no conflicts of interest.
FUNDING
This work was supported by the National Natural Science Foundation of China (NOs. 81670432; 81500232; 81202778), Natural Science Foundation of Shandong Province, China (NOs. ZR2014HM098; ZR2016HM82), and The Innovation Project of Shandong Academy of Medical Sciences.
REFERENCES
1. Wang J, Wang F, Liu S, Zhou M, Zhang L, Zhao M. Reduced kidney function, albuminuria, and risks for all-cause and cardiovascular mortality in China: a population-based cohort study. BMC Nephrol. 2017; 18:188. https://doi.org/10.1186/s12882-017-0603-9.
2. Sung KC, Ryu S, Lee JY, Lee SH, Cheong E, Hyun YY, Lee KB, Kim H, Byrne CD. Urine albumin/creatinine ratio below 30 mg/g is a predictor of incident hypertension and cardiovascular mortality. J Am Heart Assoc. 2016; 5:e003245. https://doi.org/10.1161/JAHA.116.003245.
3. Malyszko J. Mechanism of endothelial dysfunction in chronic kidney disease. Clin Chim Acta. 2010; 411:1412-1420. https://doi.org/10.1016/j.cca.2010.06.019.
4. Chadban SJ, Briganti EM, Kerr PG, Dunstan DW, Welborn TA, Zimmet PZ, Atkins RC. Prevalence of kidney damage in Australian adults: the AusDiab kidney study. J Am Soc Nephrol. 2003; 14:S131-S138.
5. Hallan SI, Coresh J, Astor BC, Asberg A, Powe NR, Romundstad S, Hallan HA, Lydersen S, Holmen J. International comparison of the relationship of chronic kidney disease prevalence and ESRD risk. J Am Soc Nephrol. 2006; 17:2278-2284. https://doi.org/10.1681/ASN.2005121273.
6. Coresh J, Selvin E, Stevens LA, Manzi J, Kusek JW, Eggers P, Van Lente F, Levey AS. Prevalence of chronic kidney disease in the United States. JAMA. 2007; 298:2038-2047. https://doi.org/10.1001/jama.298.17.2038.
7. Zhang L, Wang F, Wang L, Wang W, Liu B, Liu J, Chen M, He Q, Liao Y, Yu X, Chen N, Zhang JE, Hu Z, et al. Prevalence of chronic kidney disease in China: a cross-sectional survey. Lancet. 2012; 379:815-822. https://doi.org/10.1016/S0140-6736(12)60033-6.
8. Zhang W, Shi W, Liu Z, Gu Y, Chen Q, Yuan W, Zhang Y, Gong L, Zhou R, Li M, Cheng H, Liu J, Cen J, et al. A nationwide cross-sectional survey on prevalence, management and pharmacoepidemiology patterns on hypertension in Chinese patients with chronic kidney disease. Sci Rep. 2016; 6:38768. https://doi.org/10.1038/srep38768.
9. Zhang J, Jiang H, Chen J. Combined effect of body mass index and metabolic status on the risk of prevalent and incident chronic kidney disease: a systematic review and meta-analysis. Oncotarget. 2017; 8:35619-35629. https://doi.org/10.18632/oncotarget.10915.
10. Muntner P, He J, Astor B, Folsom A, Coresh J. Traditional and nontraditional risk factors predict coronary heart disease in chronic kidney disease: results from the atherosclerosis risk in communities study. J Am Soc Nephrol. 2005; 16:529-538. https://doi.org/10.1681/ASN.2004080656.
11. Foley RN, Wang C, Collins AJ. Cardiovascular risk factor profiles and kidney function stage in the U.S. general population: the NHANES III study. Mayo Clin Proc. 2005; 80:1270-1277. https://doi.org/10.4065/80.10.1270.
12. Fang F, Jia J, Li J, Huo Y, Zhang Y. White blood cell count predicts the odds of kidney function decline in a Chinese community-based population. BMC Nephrol. 2017; 18:190. https://doi.org/10.1186/s12882-017-0608-4.
13. Mehta T, buzkova P, Kizer JR, Djousse L, Chonchol M, Mukamal KJ, Shlipak M, Ix JH, Jalal D. Higher plasma transforming growth factor (TGF)-β is associated with kidney disease in older community dwelling adults. BMC Nephrol. 2017; 18:98. https://doi.org/10.1186/s12882-017-0509-6.
14. Zbroch E, Małyszko J, Małyszko J, Koc-Żórawska E, Myśliwiec M. Renalase, kidney function, and markers of endothelial dysfunction in renal transplant recipients. Pol Arch Med Wewn. 2012; 122:40-44.
15. Rabelink TJ, de Boer HC, van Zonneveld AJ. Endothelial activation and circulating markers of endothelial activation in kidney disease. Nat Rev Nephrol. 2010; 6:404-414. https://doi.org/10.1038/nrneph.2010.65.
16. Stam F, van Guldener C, Becker A, Dekker JM, Heine RJ, Bouter LM, Stehouwer CD. Endothelial dysfunction contributes to renal function-associated cardiovascular mortality in a population with mild renal insufficiency: the Hoorn Study. J Am Soc Nephrol. 2006; 17:537-545. https://doi.org/10.1681/ASN.2005080834.
17. Carallo C, Tripolino C, De Franceschi MS, Irace C, Xu XY, Gnasso A. Carotid endothelial shear stress reduction with aging is associated with plaque development in twelve years. Atherosclerosis. 2016; 251:63-69. https://doi.org/10.1016/j.atherosclerosis.2016.05.048.
18. Collins C, Tzima E. Hemodynamic forces in endothelial dysfunction and vascular aging. Exp Gerontol. 2011; 46:185-188. https://doi.org/10.1016/j.exger.2010.09.010.
19. Lee MY, Wu CM, Yu KH, Chu CS, Lee KT, Sheu SH, Lai WT. Association between wall shear stress and carotid atherosclerosis in patients with never treated essential hypertension. Am J Hypertens. 2009; 22:705-710. https://doi.org/10.1038/ajh.2009.77.
20. Liu Z, Zhao Y, Wang X, Zhang H, Cui Y, Diao Y, Xiu J, Sun X, Jiang G. Low carotid artery wall shear stress is independently associated with brain white-matter hyperintensities and cognitive impairment in older patients. Atherosclerosis. 2016; 247:78-86. https://doi.org/10.1016/j.atherosclerosis.2016.02.003.
21. Thomann S, Baek S, Ryschich E. Impact of wall shear stress and ligand avidity on binding of anti-CD146-coated nanoparticles to murine tumor endothelium under flow. Oncotarget. 2015; 6:39960-39968. https://doi.org/10.18632/oncotarget.5662.
22. Malík J, Kudlička J, Tuka V, Chytilová E, Adamec J, Ročínová K, Tesař V. Common carotid wall shear stress and carotid atherosclerosis in end-stage renal disease patients. Physiol Res. 2012; 61:355-361.
23. Verbeke FH, Agharazii M, Boutouyrie P, Pannier B, Guérin AP, London GM. Local shear stress and brachial artery functions in end-stage renal disease. J Am Soc Nephrol. 2007; 18:621-628. https://doi.org/10.1681/ASN.2006040400.
24. Samijo SK, Barkhuysen R, Willigers JM, Leunissen KM, Ledoux LA, Kitslaar PJ, Hoeks AP. Wall shear stress assessment in the common carotid artery of end-stage renal failure patients. Nephron. 2002; 92:557-563. https://doi.org/64085.
25. Park DW, Kruger GH, Rubin JM, Hamilton J, Gottschalk P, Dodde RE, Shih AJ, Weitzel WF. In-vivo vascular wall shear rate and circumferential strain of renal disease patients. Ultrasound Med Biol. 2013; 39:241-252. https://doi.org/10.1016/j.ultrasmedbio.2012.08.027.
26. Wu SP, Ringgaard S, Oyre S, Hansen MS, Rasmus S, Pedersen EM. Wall shear rates differ between the normal carotid, femoral, and brachial arteries: an in vivo MRI study. J Magn Reson Imaging. 2004; 19:188-193. https://doi.org/10.1002/jmri.10441.
27. Katz DH, Burns JA, Aguilar FG, Beussink L, Shah S. Albuminuria is independently associated with cardiac remodeling, abnormal right and left ventricular function, and worse outcomes in heart failure with preserve ejection fraction. JACC Heart Fail. 2014; 2:586-596. https://doi.org/10.1016/j.jchf.2014.05.016.
28. Stehouwer CD, Gall MA, Twisk JW, Knudsen E, Emeis JJ, Parving HH. Increased urinary albumin excretion, endothelial dysfunction, and chronic low-grade inflammation in type 2 diabetes: progressive, interrelated, and independently associated with risk of death. Diabetes. 2002; 51:1157-1165.
29. Ataga KI, Derebail VK, Caughey M, Elsherif L, Shen JH, Jones SK, Maitra P, Pollock DM, Cai J, Archer DR, Hinderliter AL. Albuminuria is associated with endothelial dysfunction and elevated plasma endothelin-1 in sickle cell anemia. PLoS One. 2016; 11:e0162652. https://doi.org/10.1371/journal.pone.0162652.
30. Bahadoran Z, Mirmiran P, Tahmasebi Nejad Z, Ghasemi A, Azizi F. Serum nitric oxide is associated with the risk of chronic kidney disease in women: tehran lipid and glucose study. Scand J Clin Lab Invest. 2016; 76:304-308. https://doi.org/10.3109/00365513.2016.1149880.
31. Baylis C. Nitric oxide deficiency in chronic kidney disease. Am J Physiol Renal Physiol. 2008; 294:F1-F9. https://doi.org/10.1152/ajprenal.00424.2007.
32. Aiello S, Noris M, Todeschini M, Zappella S, Foglieni C, Benigni A, Corna D, Zoja C, Cavallotti D, Remuzzi G. Renal and systemic nitric oxide synthesis in rats with renal mass reduction. Kidney Int. 1997; 52:171-181.
33. Mels CM, Huisman HW, Smith W, Schutte R, Schwedhelm E, Atzler D, Böger RH, Ware LJ, Schutte AE. The relationship of nitric oxide synthesis capacity, oxidative stress, and albumin-to-creatinine ratio in black and white men: the SABPA study. Age (Dordr). 2016; 38:9. https://doi.org/10.1007/s11357-016-9873-6.
34. Wever R, Boer P, Hijmering M, Stroes E, Verhaar M, Kastelein J, Versluis K, Lagerwerf F, van Rijn H, Koomans H, Rabelink T. Nitric oxide productin is reduced in patients with chronic renal failure. Arterioscler Thromb Vasc Biol. 1999; 19:1168-1172.
35. Inker LA, Schmid CH, Tighiouart H, Eckfeldt JH, Feldman HI, Greene T, Kusek JW, Manzi J, Van Lente F, Zhang YL, Coresh J, Levey AS; CKD-EPI Investigators. Estmating glomerular filtration rate from serum creatinine and cystatin C. N Engl J Med. 2012; 367:20-29. https://doi.org/10.1056/NEJMoa1114248.
36. Ye X, Liu X, Song D, Zhang X, Zhu B, Wei L, Pei X, Wu J, Lou T, Zhao W. Estimating glomerular filtration rate by serum creatinine or/and cystatin C euations: an analysis of multi-centre Chinese subjects. Nephrology (Carlton). 2016; 21:372-378. https://doi.org/10.1111/nep.12636.
37. Moore Jr JE, Xu C, Glagov S, Zarins CK, Ku DN. Fluid wall shear stress measurements in a model of the human abdominal aorta: oscillatory behavior and relationship to atherosclerosis. Atherosclerosis. 1994; 110:225-240.
38. Maria Z, Yin W, Rubenstein DA. Combined effects of physiologicall relevant disturbed wall shear stress and glycated albumin on endothelial cell functions assoicated with inflammation, thrombosis and cytoskeletal dynamics. J Diabetes Investig. 2014; 5:372-381. https://doi.org/10.1111/jdi.12162.
39. Kim H, Yang KH, Cho H, Gwak G, Park SC, Kim JI, Yun SS, Moon IS. Different effects of orbital shear stress on vascular endothelial cells: comparison with the results of in vivo study with rats. Vasc Specialist Int. 2015; 31:33-40. https://doi.org/10.5758/vsi.2015.31.2.33.
40. Yamada Y, Sakuma J, Takeuchi I, Yasukochi Y, Kato K, Oquri M, Fujimaki T, Horibe H, Muramatsu M, Sawabe M, Fujiwara Y, Taniguchi Y, Obuchi S, et al. Identification of C21off59 and ATG2A as novel determinants of renal function-related traits in Japanese by exome-wide association studies. Oncotarget. 2017; 8:45259-45273. https://doi.org/10.18632/oncotarget.16696.
41. Pattaro C, Teumer A, Gorski M, Chu AY, Li M, Mijatovic V, Garnaas M, Tin A, Sorice R, Li Y, Taliun D, Olden M, Foster M, et al. Genetic associations at 53 loci highlight cell types and biological pathways relevant for kidney function. Nat Commun. 2016; 7:10023. https://doi.org/10.1038/ncomms10023.
42. Irace C, Carallo C, De Franceschi MS, Scicchitano F, Milano M, Tripolino C, Scavelli F, Gnasso A. Human common carotid wall shear stress as a function of age and gender: a 12-year follow-up study. Age (Dordr). 2012; 34:1553-1562. https://doi.org/10.1007/s11357-011-9318-1.
43. Mynard JP, Wasserman BA, Steinman DA. Errors in the estimation of wall shear stress by maximum Doppler velocity. Atherosclerosis. 2013; 227:259-266. https://doi.org/10.1016/j.atherosclerosis.2013.01.026.
44. Wei F, Sun X, Zhao Y, Zhang H, Diao Y, Liu Z. Excessive visit-to-visit glycemic variability independently deteriorates the progression of endothelial and renal dysfunction in patients with type 2 diabetes mellitus. BMC Nephrol. 2016; 17:67. https://doi.org/10.1186/s12882-016-0300-0.
45. Liu Z, Zhao Y, Lu F, Zhang H, Diao Y. Day-by day variability in self-measured blood pressure at home: effects on carotid artery atherosclerosis, brachial flow-mediated dilation, and endothelin-1 in normotensive and mild-moderate hypertensive individuals. Blood Press Monit. 2013; 18:316-325. https://doi.org/10.1097/MBP.0000000000000001.
46. Song H, Liu Z, Zhao Y, Ye L, Lu F, Zhang H, Diao Y, Xu J. Reducing visit-to-visit variability in systolic blood pressure for improving the progression of carotid atherosclerosis and endothelial dysfunction in patients with hypertension management. Iran J Public Health. 2014; 43:722-735.
47. Green LC, Wagner DA, Glogowski J, Skipper PL, Wishnok JS, Tannenbaum SR. Analysis of nitrate, nitrite and [15N] nitrate in biological fluids. Anal Biochem. 1982; 126:131-138.