
INTRODUCTION
Intrahepatic cholangiocarcinoma (ICC), an aggressive epithelial malignancy of the bile ducts [1], is the second most common primary liver cancer worldwide, with a rising incidence [2]. The overall prognosis of ICC remains poor with the five-year survival rate less than 30% [3]. Due to the common risk factor of Hepatitis-B virus (HBV) infection with hepatocellular carcinoma (HCC), ICC can also be presented with cirrhosis [4, 5]. Differentiation of ICC and HCC in the setting of liver cirrhosis is of great importance, because the treatment and prognosis of these entities can be quite different [6, 7]. Ultrasonography (US) is helpful to investigate the cause of the bile duct obstruction and to locate the lesions [8, 9], computed tomography (CT) is usually used to evaluate the full extension of tumor and determine surgical resectability [10, 11], routine unenhanced T1- and T2-weighted imaging enable the ability to evaluate the surrounding tissues, magnetic resonance cholangiopancreatography (MRCP) is useful for assessing the biliary system [12–14]. However, accurate preoperative diagnosis of ICC in patients with cirrhosis has been quite difficult by using these usual imaging because of similar imaging features compared with HCC especially in the cirrhotic liver [15].
Diffusion weighted imaging (DWI) is a noninvasive approach to probe molecular diffusion of water without contrast administration, and the diffusion of water can be quantitatively described by apparent diffusion coefficient (ADC) [16, 17]. However, the ADC value derived from DWI is calculated by using the mono-exponential model, which ignored the effect of perfusion fraction in tissue and could be influenced by the microcirculation of blood in capillaries [18, 19]. Intravoxel incoherent motion (IVIM) diffusion-weighted MR imaging could determine the true molecular diffusion and perfusion from the blood microcirculation in the capillary networks by using multi b values, and thus has the potential to better characterize tissue than DWI [20, 21]. To our knowledge, there is no report that have compared IVIM-DWI derived from the bio-exponential model and conventional DWI derived from mono-exponential model on their capabilities to differentiate ICC and HCC in cirrhotic livers.
The purpose of this study was to determine the feasibility of IVIM-DWI and conventional DWI in differentiating ICC and HCC in cirrhotic livers, and to subsequently compare the diagnostic performance of various parameters derived from IVIM-DWI and conventional DWI.
RESULTS
Patient characteristics
The final study population for the ICC group were 65 patients (44 men and 21 women; mean age, 54.95 ± 11.83 years; range, 35–80 years) with 68 tumors, and the tumors’ diameter were ranged from 8.7–175 mm (63.44 ± 4.89 mm); the HCC group were consisted of 65 patients (50 men and 15 women; mean age, 52.69 ± 10.86 years; range, 31–78 years) with 68 tumors, and the tumors’ diameter were ranged from 6.5–168 mm (59.60 ± 4.71 mm). For each group, there were 61 patients with Child-Pugh A, 4 patients with Child-Pugh B and no Child-Pugh C patient. No statistical significance was obtained from the patients’ gender (P = 0.24), age (P = 0.26), nodule size (P = 0.57) and Child-Pugh classification (P > 0.999) in the comparison of HCC and ICC group.
Comparison of IVIM-DWI and conventional DWI parameters
The ADC value (R1, P < 0.001; R2, P < 0.001), determined by both radiologists, of the ICC (Figure 1) was significant higher than the HCC group (Figure 2). As for the IVIM parameters, the ADCslow (R1, P < 0.001; R2, P < 0.001) value of the ICC group was significantly higher than HCC, however, the ADCfast (R1, P = 0.118; R2, P = 0.072) and f (R1, P = 0.112; R2, P = 0.104) value of the ICC group demonstrated a numerical value increasing trend than HCC group but without the statistical significance. The detailed value of the IVIM and DWI parameters of ICC and HCC group were listed in Table 1. Figure 3 shows the quantitative comparison of differences in ADCslow and ADC in the ICC and HCC groups.
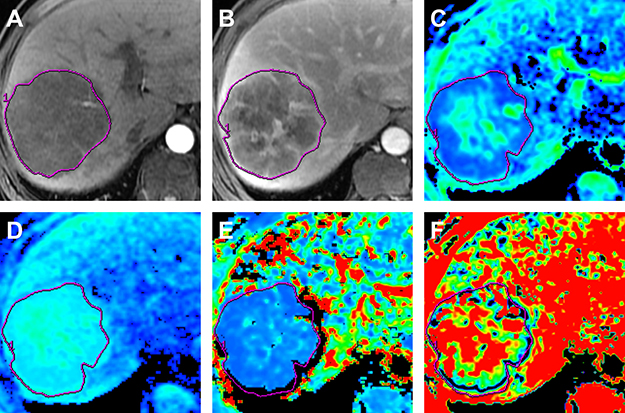
Figure 1: MR images in a 63-year old man with surgically proved ICC. (A) Arterial phase MR image. (B) Portal venous phase MR image. (C) Standard ADC map. (D) ADCslow map. (E) ADCfast map. (F) f map. The tumor shows peripheral rim-like enhancement on arterial phase MR image and with progressive central enhancement on portal venous phase. The ADC map demonstrates a higher ADC value (1.41 × 10⁻³ mm2/s) compared with cutoff value (1.18 × 10⁻³ mm2/s), the ADCslow also demonstrates a higher ADC value (1.26 × 10⁻³ mm2/s) compared with cutoff value (1.06 × 10⁻³ mm2/s).
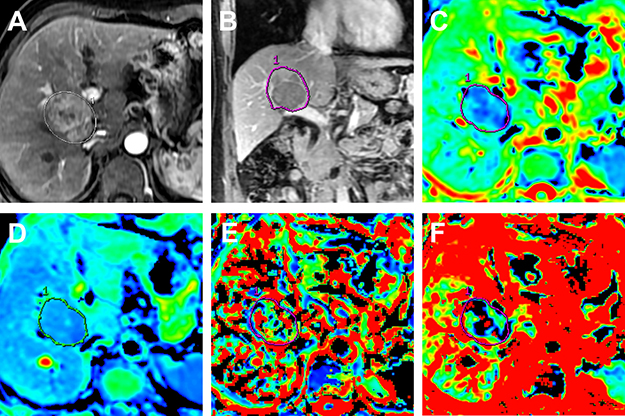
Figure 2: MR images in a 58-year old man with surgically confirmed HCC. (A) Arterial phase MR image. (B) Portal venous phase MR image. (C) Standard ADC map. (D) ADCslow map. (E) ADCfast map. (F) f map. The tumor shows typically hyperintense on arterial phase MR image and hypointense to liver parenchyma on portal venous phase. The ADC map demonstrates a lower ADC value (0.98 × 10⁻³ mm2/s) compared with cutoff value (1.18 × 10⁻³ mm2/s), the ADCslow also demonstrates a lower ADC value (0.76 × 10⁻³ mm2/s) compared with cutoff value (1.06 × 10⁻³ mm2/s).
Table 1: IVIM and DWI parameters of the HCC and ICC group of the two radiologists
Parameters |
Observer |
HCC |
ICC |
t/z |
P |
|---|---|---|---|---|---|
ADC |
R1 R2 |
1.16 ± 0.29 1.14 ± 0.30 |
1.42 ± 0.21 1.44 ± 0.25 |
5.896 6.346 |
< 0.001 < 0.001 |
ADCslow |
R1 R2 |
0.9 ± 0.22 0.90 ± 0.23 |
1.14 ± 0.21 1.15 ± 0.22 |
6.360 6.678 |
< 0.001 < 0.001 |
ADCfast |
R1 R2 |
16.75 ± 11.53 16.54 ± 11.51 |
19.92 ± 11.99 20.14 ± 11.66 |
1.572 1.814 |
0.118 0.072 |
f |
R1 R2 |
0.37 ± 0.16 0.36 ± 0.16 |
0.34 ± 0.12 0.33 ± 0.13 |
1.601 1.637 |
0.112 0.104 |
Note: R1: radiologist 1, R2: radiologist 2. HCC: hepatocellular carcinoma, ICC: intrahepatic cholangiocarcinoma, ADC: apparent diffusion coefficient, ADCslow: slow ADC, ADCfast: fast ADC. ADC, ADCslow, ADCfast are in units of ×10-3mm2/s, f is in units of 100%.
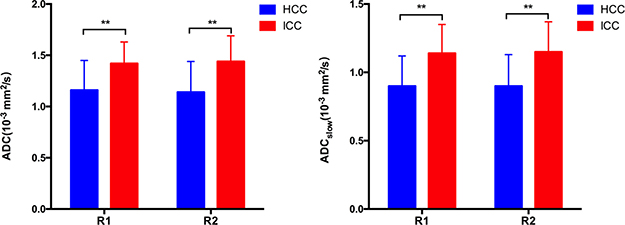
Figure 3: ADCslow and ADC (mean ± standard deviation) value measured by two radiologists for ICC and HCC group. R1 = Radiologist 1; R2 = Radiologist 2. The ADC and ADCslow of the ICC group were significant higher than HCC group by both two radiologists. (**P < 0.001)
Diagnostic performance of IVIM-DWI and conventional DWI parameters
The receiver operating characteristics (ROC) curves in distinguishing ICC from the HCC group derived from two radiologists of IVIM-DWI and conventional DWI parameters were listed in Figure 4. The ADCslow demonstrated the highest area under curve (AUC) with a value of 0.803 (95% Confidence Interval [CI]: 0.726-0.866) obtained by radiologist 1, and AUC values were 0.792 (CI: 0.714–0.857) for ADC, 0.573 (CI: 0.485 –0.657) for ADCfast, and 0.578 (CI: 0.490–0.662) for f value. The AUC values of ADCslow was statistical greater than ADCfast (Z = 4.003, P < 0.001) and f (Z = 3.769, P = 0.002), and AUC values of ADC was also statistical greater than ADCfast (Z = 3.986, P = 0.001) and f (Z = 3.048, P = 0.002). However, no statistical significant difference was obtained from the AUC values between the comparison of ADC and ADCslow (Z = 0.309, P = 0.758), ADCfast and f (Z = 0.092, P = 0.927). Additionally, AUC values obtained by radiologist 2 were 0.814 (CI: 0.738-0.875) for ADCslow, 0.797 (CI: 0.719-0.861) for ADC, 0.594 (CI: 0.507-0.678) for ADCfast and 0.575 (CI: 0.487-0.659) for f. The AUC values of ADCslow was statistically greater than ADCfast (Z = 4.071, P < 0.001) and f (Z = 4.087, P < 0.001), AUC values of ADC was also statistically greater than ADCfast (Z = 3.965, P = 0.0001) and f (Z = 3.232, P = 0.001). However, no statistical significant difference was obtained from the AUC values between the ADCslow and ADC (Z = 0.517, P = 0.605), ADCfast and f (Z = 0.370, P = 0.717). Table 2 shows the sensitivity and specificity of IVIM and DWI parameters at optimal cutoff values in differentiating ICC and HCC groups.0
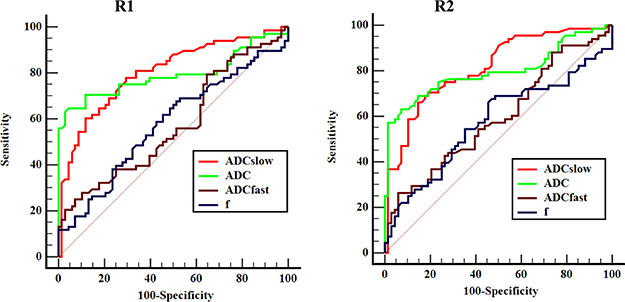
Figure 4: Receiver operating characteristic (ROC) curves of IVIM-DWI and conventional DWI parameters measured by two radiologists for differentiating ICC and HCC. R1 = Radiologist 1; R2 = Radiologist 2. Area under curve (AUC) for ADC and ADCslow were higher than the ADCfast and f obtained by two radiologists, and the differences were statistical significance.
Table 2: Sensitivity and specificity of IVIM-DWI and conventional DWI parameters at optimal cutoff value in differentiating the HCC and ICC measured by two radiologists
Group |
Observer |
Optimal cutoff value |
Sensitivity (100%) |
Specificity (100%) |
Youden index |
|---|---|---|---|---|---|
ADC |
R1 R2 |
1.18 1.14 |
64.71 (44/68) 57.35 (39/68) |
95.59 (65/68) 98.53 (67/68) |
0.603 0.559 |
ADCslow |
R1 R2 |
1.06 0.995 |
77.94 (53/68) 70.59 (48/68) |
70.59 (48/68) 80.88 (55/68) |
0.485 0.515 |
ADCfast |
R1 R2 |
7.99 8.47 |
25.00 (17/68) 26.47 (18/68) |
92.65 (63/68) 94.12 (64/68) |
0.177 0.206 |
f |
R1 R2 |
0.30 0.30 |
67.65 (46/68) 67.65 (46/68) |
48.53 (33/68) 52.94 (36/68) |
0.161 0.206 |
Note: R1: radiologist 1, R2: radiologist 2. ADC: apparent diffusion coefficient, ICC: inter-class correlation coefficient, ADCslow: slow ADC, ADCfast: fast ADC. ADC, ADCslow, ADCfast are in units of ×10-3 mm2/min, f is in units of 100%.
Inter-observer reproducibility
When looking at the intra-class correlation coefficient between the two observers, the intra-class correlation coefficient values of the HCC group were 0.976 for ADC, 0.960 for ADCslow, 0.944 for ADCfast and 0.950 for f. For the ICC group, intra-class correlation coefficient values were 0.911 for ADC, 0.952 for ADCslow, 0.939 for ADCfast and 0.912 for f. The Bland-Altman analysis for inter-observer measurement in the IVIM-DWI and conventional DWI parameters are shown in Figure 5 and 6.
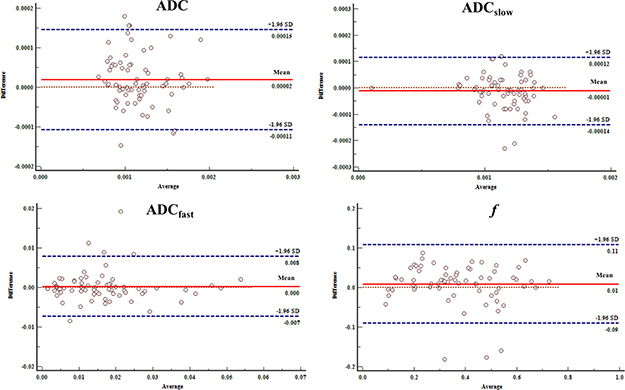
Figure 5: Bland-Altman analysis of differences between two radiologists of the IVIM-DWI and conventional DWI parameters with HCC. The differences were relatively small measured by two radiologists toward the parameters.
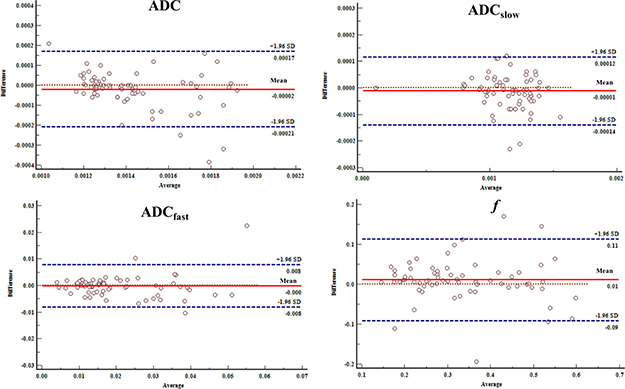
Figure 6: Bland-Altman analysis of differences between two radiologists of the IVIM-DWI and conventional DWI parameters with ICC. The differences were relatively small measured by two radiologists toward the parameters.
DISCUSSION
Accurate preoperative differentiation of ICC and HCC has always been limited because of the similar imaging signs depicted by using the usual imaging modalities can not be used to accurately differentiate these entities [14, 15]. HCC usually coexists with liver cirrhosis, whereas ICC is traditionally considered to mainly in the absence of cirrhosis and which used to be regarded as the differential diagnosis point [22, 23]. However, ICC can also be presented with cirrhosis especially with the risk factor of HBV infection, so the differentiation of ICC and HCC can be much more difficult in the cirrhotic livers. Regarding the ICC MR imaging, the ADC value has been used to assess the differentiated grade and tumor response after local-regional therapy [24, 25], and the contrasted enhanced MR has been used to evaluate the enhanced characteristics [26, 27]. However, few studies have determined the feasibility of IVIM in differentiating the ICC and HCC in cirrhotic livers.
In the present study, both ADC and ADCslow showed statistical significance in differentiating ICC and HCC, and the numeric values of ICC was statistical higher than HCC. Histologically, the tumor’s cellularity of the HCC was higher than ICC, and high cellularity could decrease extracellular space and limit water diffusion, finally, the value of diffusion coefficient for ADC and ADCslow were decreased. Furthermore, the pathological structures of ICC were mainly consisted of malignant tumor cell, fibrotic tissue and necrotic tissue, the periphery of the tumor were tumor cells and the center of the tumor were mainly fibrotic tissue [28]. The cellularity of ICC is relatively small and the existed tumor cell could arrange into acinar like structures, thus, which could further prompt the water molecular diffusion and increase the ADC and ADCslow value. Previous studies compared the ADC value of ICC and normal hepatic parenchyma and showed that the value of ICC was lower than the normal hepatic tissue [29], and some other studies also reported that the ADC value of the HCC was also lower than that of the relatively low cellularity benign nodules [30, 31]. These current results were consistent with the findings that low cellularity tumor demonstrated a high ADC value compared with the high cellularity tumor.
Our results indicated that the numerical values of ADC were greater than ADCslow in both HCC and ICC groups, and which could be explained by the contribution of perfusion to the diffusion coefficient being removed. In addition, the IVIM-derived ADCslow showed higher AUC value compared with ADC in differentiating ICC and HCC group, and the better diagnostic performance of ADCslow can be explained by the fact that ADC is a non-specific parameter and which could not only influence by the microcirculation related perfusion but also affected by the cellularity related diffusion. Woo et al [32] reported that a high AUC value for ADCslow than for ADC in differentiating high-grade HCC from low-grade HCC. Klauss M et al. [33] also demonstrated a higher AUC value of ADCslow in differentiating HCC and hepatic benign nodules. Thus, ADCslow might be better to categorize the ICC and HCC entities.
It is noteworthy that despite a better diagnostic performance of ADCslow and ADC in differentiating the ICC and HCC group, an overlap of the values still existed in the two groups. This may be related to the following factors. First, the pathological heterogeneity of the tumor. As the recent evidence [28] suggested that the ICC has multiple cellular origins including differentiated hepatocytes, intrahepatic biliary epithelial cells and pluripotent stem cells, the multiple cellular origins may have similar biological behaviors. Thus, from the cell origin and biology perspective, determination of the two kinds of tumor may also overlap. Second, the evaluation of the abdominal MR imaging is hindered by the respiratory motion artifacts and which may also impact on the results. Furthermore, the study cohort was all HBV-related patients with cirrhotic livers, the common pathogenesis of the two groups may also share the common pathological process, so which may also cause the overlap.
Our data demonstrated that the perfusion parameters, ADCfast and f were not statistical significantly in differentiating the ICC and HCC group. In theory, the ADCfast is correlated with the average blood flow rate and f is associated with the fraction volume of capillary blood flow, which could be used to reflect the vascularity in tissue, and might be helpful in differentiating the ICC and HCC group. Paradoxically, ADCfast and f values of the ICC and HCC group showed no statistical difference in our study. The current result may be attributed to the fact that measurement of the ICC and HCC groups were in the setting of liver cirrhosis and which may share the similar blood supply. Previous studies [34, 35] dealing with the enhanced MR imaging showed similar enhancement pattern of ICC compared with HCC, thus, the perfusion related parameters was not helpful in differentiating the HCC-mimicking blood supply of ICC. Yoon JH et al. [30] also reported that ADCfast and f can not be used to characterize focal hepatic lesions, Sun et al. [36] reported that the ADCfast and f were not useful for assessing the tumor differentiation grade in rectal cancer because of the lower diagnostic efficiency, poor reproducibility and high uncertainty of ADCfast and f, which were consistent with our results.
We acknowledge some limitations of our study. First, because of its retrospective nature, there may have been potential for bias in patient selection. Second, the ROIs were mainly selected on the solid parts instead of the whole part of carcinoma, as the heterogeneity of tumor exists, which may lead to selection bias. Thirdly, we did not compare the usefulness of IVIM in the differentiating of ICC and HCC with that of other imaging modalities, such as the dynamic contrast-enhanced MR and enhanced CT, because part of participants did not conduct with enhanced MR or CT examination. Fourth, this is a single-center study with a single MR unit which leaves the question open on the reproducibility. Finally, the ICC and HCC specimens underwent IVIM examination were not included in our study, as which could entirely eliminate the effect of perfusion.
In conclusion, the results of the preliminary study have demonstrated that ADCslow values calculated with IVIM modeling of diffusion weighted imaging and ADC values derived from mono-exponential model demonstrated a superior diagnostic performance than ADCfast and f.
MATERIALS AND METHODS
Participants
This study was approved by the institutional review board (West China Hospital, Sichuan University), and written informed consent was waived for this retrospective review. This study was conducted in accordance with the Declaration of Helsinki. For the study population, 133 registered patients with ICC on cirrhotic livers confirmed by pathologically were potentially included between January 2014 and March 2017. Among them, 68 subjects were excluded for the following reasons: 1, IVIM examination was not performed (n = 12); 2, pathologically combined with HCC and ICC (n = 36); 3, the image quality was unsatisfactory (n = 7); 4, patients without HBV infection (n = 13). For the control group, patients with pathologically proved HCC with HBV-related cirrhosis were one-to-one matched with ICC patients. The matching criteria were: 1, age (± 5 years); 2, HBV-related cirrhosis; 3, number of tumors (single or multiple); 4, tumor size (less than 20 mm, 21–40 mm or ≥ 41mm); 5, Child-Pugh classifications.
Imaging technique
For all examinations, studies were carried out by using a 3.0 T MR system (Discovery MR750, GE Healthcare, Milwaukee, USA). An eight-channel phased-array torsor coil (GE Medical System) was used for all measurements. The routine MR imaging was performed with a fast spin echo (FSE) sequence with respiratory gating. Fat-saturation axial T2 images were obtained with repetition time/echo time (TR/TE) of 3529/77.6 ms (effective), and the slice thickness was 5.0 mm with gap of 1 mm; field of view, 38 × 38 cm2; matrix size, 320 × 320; NEX, 2.0. Axial enhanced T1-weighted images were obtained with TR/TE of 3.9/1.8 ms (effective), and the slice thickness was 5.0 mm with gap of 1 mm; field of view, 38 ×30.4 cm2; matrix size, 320 × 160; NEX, 1. The total scanning time for routine sequences were about 15 minutes. The IVIM was performed by using an echo-planner imaging in the axial plane with respiratory gating. The parallel imaging was used and the parameters were: TR/TE, 3750/61.4; field of view, 38 × 28 cm2; matrix size, 128×128 and the slice thickness was 5.0 mm with gap of 1 mm. Thirteen b values were from 0 to 1200 sec/mm2 (0, 10, 20, 40, 80, 100, 150, 200, 400, 600, 800, 1000, 1200) were used, and the NEX for each b was 2, 2, 2, 2, 2, 2, 2, 2, 4, 6, 8, 10. The total scanning time for IVIM was about 10 minutes.
Imaging analysis
All the MR images were obtained and transferred to the workstation (Advantage workstation 4.6; GE Medical System). Two independent radiologists (B.S., Y.W., with 25 and 5 years of experience in reading MR images, 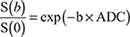 respectively) who were blinded to the histopathological results evaluated the IVIM data. The MR images were anonymized and randomized distributed by a third radiologists (M.W.). The ADC value was calculated by using a mono-exponential model with the equation:
Where S(b) represents the signal intensity in the 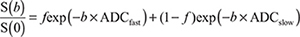 presence of diffusion sensitization, and S(0) represents the signal intensity in the absence of diffusion sensitization. For the true ADC (ADCslow), pseudo-ADC (ADCfast) and perfusion fraction (f), the bi-exponential IVIM model was used with the equation:
For every patient, the two independent radiologists placed three region of interests (ROIs) on the solid part of tumor per slice, and three continuous slices according to the largest diameter of tumor were selected for measurement. Identification of selection of the representative tissue for ROIs placement were performed on the DW images (b = 0). T2-weighted and dynamic contrast-enhanced T1-weighted images were also used to avoid the hemorrhagic, calcified and necrotic areas. The mean value of ROIs on each parameter map was calculated. The shape, size and positon of ROIs were consistent on each parameter map.
Statistical analysis
All statistical analyses were performed by using a statistical software package (SPSS19.0 (SPSS Inc, Chicago, IL, USA)). Numerical variance is indicated as the mean and standard deviation. Baseline patient characteristics between the ICC and HCC group were compared with the independent-sample t test for the continuous variables and χ2 test for the categorical variables. The mean value of each parameter for each subject measured by the two radiologists were used for statistical analyses, respectively. MR parameters between ICC and HCC were compared with independent-sample t test. Receiver operating characteristics (ROC) curves analyses were performed to evaluate the diagnostic performance of each IVIM parameters and DWI in distinguishing ICC from HCC groups, and to determine the optimal parameter for the differential diagnosis. The cutoff point was determined by using the maximized value of Youden index, sensitivity, specificity at the threshold value were calculated. Z-test was used to compare the area under ROC curves (AUC) in IVIM and DWI parameters. Intra-class correlation coefficient (ICC) was used to determine the reliability between the two independent radiologists in each parameter, ICC values less than 0.5 are indicative of poor reliability, 0.5–0.75 indicate moderate reliability, 0.75–0.9 indicate good reliability, values greater than 0.90 indicate excellent reliability [37]. Bland-Altman plot was used to evaluate the agreement between the inter-observer measurements. A P value of less than 0.05 was considered to indicate statistical significance.
Author contributions
B.S., Y.W., F.G., D, Z., Z.H., M.W. participated in the study design. Y.W., F.H., C.C., T.D., J.C., and L.C. conducted the experiment. B.S., Y.W., F.G. participated in the MR image analysis. B.S., Y.W., F.G analyzed the data. B.S, Y.W., F.G., prepared the first draft of the manuscript. B.S, Y.W., F.G. revised the manuscript.
CONFLICTS OF INTEREST
Competing financial interests: The authors declare no competing financial interests.
FUNDING
This study was funded by Research Grant of National Nature Science Foundation of China and Science (Grant number 81471658) and Technology Support Program of Sichuan Province (Grant number 2017SZ0003).
REFERENCES
1. Altekruse SF, Petrick JL, Rolin AI, Cuccinelli JE, Zou Z, Tatalovich Z, McGlynn KA. Geographic variation of intrahepatic cholangiocarcinoma, extrahepatic cholangiocarcinoma, and hepatocellular carcinoma in the United States. PLoS One. 2015; 10:e0120574. https://doi.org/10.1371/journal.pone.0120574.
2. Seo N, Kim DY, Choi JY. Cross-Sectional Imaging of Intrahepatic Cholangiocarcinoma: Development, Growth, Spread, and Prognosis. AJR Am J Roentgenol. 2017; 209: W64–w75. https://doi.org/10.2214/ajr.16.16923.
3. Saha SK, Zhu AX, Fuchs CS, Brooks GA. Forty-Year Trends in Cholangiocarcinoma Incidence in the U.S.: Intrahepatic Disease on the Rise. Oncologist. 2016; 21: 594-9. https://doi.org/10.1634/theoncologist.2015-0446.
4. Zhou HB, Hu JY, Hu HP. Hepatitis B virus infection and intrahepatic cholangiocarcinoma. World J Gastroenterol. 2014; 20: 5721–9. https://doi.org/10.3748/wjg.v20.i19.5721.
5. Esnaola NF, Meyer JE, Karachristos A, Maranki JL, Camp ER, Denlinger CS. Evaluation and management of intrahepatic and extrahepatic cholangiocarcinoma. Cancer. 2016; 122:1349–69. https://doi.org/10.1002/cncr.29692.
6. Bridgewater J, Galle PR, Khan SA, Llovet JM, Park JW, Patel T, Pawlik TM, Gores GJ. Guidelines for the diagnosis and management of intrahepatic cholangiocarcinoma. J Hepatol. 2014; 60:1268–89. https://doi.org/10.1016/j.jhep.2014.01.021.
7. Weber SM, Ribero D, O'Reilly EM, Kokudo N, Miyazaki M, Pawlik TM. Intrahepatic cholangiocarcinoma: expert consensus statement. HPB (Oxford). 2015; 17:669–80. https://doi.org/10.1111/hpb.12441.
8. Li F, Han J, Han F, Wang JW, Luo RZ, Li AH, Zhou JH. Combined Hepatocellular Cholangiocarcinoma (Biphenotypic) Tumors: Potential Role of Contrast-Enhanced Ultrasound in Diagnosis. AJR Am J Roentgenol. 2017; 209:767–74. https://doi.org/10.2214/ajr.16.17513.
9. Fabrega-Foster K, Ghasabeh MA, Pawlik TM, Kamel IR. Multimodality imaging of intrahepatic cholangiocarcinoma. Hepatobiliary Surg Nutr. 2017; 6:67–78. https://doi.org/10.21037/hbsn.2016.12.10.
10. Li R, Cai P, Ma KS, Ding SY, Guo DY, Yan XC. Dynamic enhancement patterns of intrahepatic cholangiocarcinoma in cirrhosis on contrast-enhanced computed tomography: risk of misdiagnosis as hepatocellular carcinoma. Sci Rep. 2016; 6: 26772. https://doi.org/10.1038/srep26772.
11. Fujita N, Asayama Y, Nishie A, Ishigami K, Ushijima Y, Takayama Y, Okamoto D, Moirta K, Shirabe K, Aishima S, Wang H, Oda Y, Honda H. Mass-forming intrahepatic cholangiocarcinoma: Enhancement patterns in the arterial phase of dynamic hepatic CT - Correlation with clinicopathological findings. Eur Radiol. 2017; 27:498–506. https://doi.org/10.1007/s00330-016-4386-3.
12. Wu XP, Ni JM, Zhang ZY, Lu FQ, Li B, Jin HH, Dai T. Preoperative Evaluation of Malignant Perihilar Biliary Obstruction: Negative-Contrast CT Cholangiopancreatography and CT Angiography Versus MRCP and MR Angiography. AJR Am J Roentgenol. 2015; 205: 780–8. https://doi.org/10.2214/ajr.14.13983.
13. Hwang J, Kim YK, Park MJ, Lee MH, Kim SH, Lee WJ, Rhim HC. Differentiating combined hepatocellular and cholangiocarcinoma from mass-forming intrahepatic cholangiocarcinoma using gadoxetic acid-enhanced MRI. J Magn Reson Imaging. 2012; 36: 881–9. https://doi.org/10.1002/jmri.23728.
14. Peporte AR, Sommer WH, Nikolaou K, Reiser MF, Zech CJ. Imaging features of intrahepatic cholangiocarcinoma in Gd-EOB-DTPA-enhanced MRI. Eur J Radiol. 2013; 82: e101–6. https://doi.org/10.1016/j.ejrad.2012.10.010.
15. Kim SY. Preoperative Radiologic Evaluation of Cholangiocarcinoma. Korean J Gastroenterol. 2017; 69:159–63. https://doi.org/10.4166/kjg.2017.69.3.159.
16. Iima M, Le Bihan D. Clinical Intravoxel Incoherent Motion and Diffusion MR Imaging: Past, Present, and Future. Radiology. 2016; 278:13–32. https://doi.org/10.1148/radiol.2015150244.
17. Filli L, Wurnig MC, Luechinger R, Eberhardt C, Guggenberger R, Boss A. Whole-body intravoxel incoherent motion imaging. Eur Radiol. 2015; 25:2049–58. https://doi.org/10.1007/s00330-014-3577-z.
18. Li GF, Duan SJ, Yan LF, Wang W, Jing Y, Yan WQ, Sun Q, Wang SM, Nan HY, Xu TY, Zheng DD, Hu YC, Cui GB. Intravoxel incoherent motion diffusion-weighted MR imaging parameters predict pathological classification in thymic epithelial tumors. Oncotarget. 2017; 8:44579–92. https://doi.org/10.18632/oncotarget.17857.
19. Yoshida S, Takahara T, Kwee TC, Waseda Y, Kobayashi S, Fujii Y. DWI as an Imaging Biomarker for Bladder Cancer. AJR Am J Roentgenol. 2017; 208:1218–28. https://doi.org/10.2214/ajr.17.17798.
20. Surov A, Meyer HJ, Höhn AK, Behrmann C, Wienke A, Spielmann RP, Garnov N. Correlations between intravoxel incoherent motion (IVIM) parameters and histological findings in rectal cancer: preliminary results. Oncotarget. 2017; 8:21974–83. https://doi.org/10.18632/oncotarget.15753.
21. Wan Q, Deng YS, Zhou JX, Yu YD, Bao YY, Lei Q, Chen HJ, Peng YH, Mei YJ, Zeng QS, Li XC. Intravoxel incoherent motion diffusion-weighted MR imaging in assessing and characterizing solitary pulmonary lesions. Sci Rep. 2017; 7: 43257. https://doi.org/10.1038/srep43257.
22. Horino K, Beppu T, Komori H, Masuda T, Hayashi H, Okabe H, Takamori H, Baba H. Evaluation of mass-forming intrahepatic cholangiocarcinoma with viral hepatitis. Hepatogastroenterology. 2012; 59: 1217–9. https://doi.org/10.5754/hge09739.
23. Chinchilla-Lopez P, Aguilar-Olivos NE, Garcia-Gomez J, Hernandez-Alejandro KK, Chable-Montero F, Motola-Kuba D, Patel T, Mendez-Sanchez N. Prevalence, Risk Factors, and Survival of Patients with Intrahepatic Cholangiocarcinoma. Ann Hepatol. 2017; 16: 565–8. https://doi.org/10.5604/01.3001.0010.0293.
24. Halappa VG, Bonekamp S, Corona-Villalobos CP, Li Z, Mensa M, Reyes D, Eng J, Bhagat N, Pawlik TM, Geschwind JF, Kamel IR. Intrahepatic cholangiocarcinoma treated with local-regional therapy: quantitative volumetric apparent diffusion coefficient maps for assessment of tumor response. Radiology. 2012; 264:285–94. https://doi.org/10.1148/radiol.12112142.
25. Xu J, Igarashi S, Sasaki M, Matsubara T, Yoneda N, Kozaka K, Ikeda H, Kim J, Yu E, Matsui O, Nakanuma Y. Intrahepatic cholangiocarcinomas in cirrhosis are hypervascular in comparison with those in normal livers. Liver Int. 2012; 32:1156–64. https://doi.org/10.1111/j.1478-3231.2012.02783. x.
26. Luna A, Pahwa S, Bonini C, Alcala-Mata L, Wright KL, Gulani V. Multiparametric MR Imaging in Abdominal Malignancies. Magn Reson Imaging Clin N Am. 2016; 24:157–86. https://doi.org/10.1016/j.mric.2015.08.005.
27. Park MJ, Kim YK, Park HJ, Hwang J, Lee WJ. Scirrhous hepatocellular carcinoma on gadoxetic acid-enhanced magnetic resonance imaging and diffusion-weighted imaging: emphasis on the differentiation of intrahepatic cholangiocarcinoma. J Comput Assist Tomogr. 2013; 37:872–81. https://doi.org/10.1097/RCT.0b013e31829d44c1.
28. Wei M, Lu L, Lin P, Chen Z, Quan Z, Tang Z. Multiple cellular origins and molecular evolution of intrahepatic cholangiocarcinoma. Cancer Lett. 2016; 379:253–61. https://doi.org/10.1016/j.canlet.2016.02.038.
29. Fattach HE, Dohan A, Guerrache Y, Dautry R, Boudiaf M, Hoeffel C, Soyer P. Intrahepatic and hilar mass-forming cholangiocarcinoma: Qualitative and quantitative evaluation with diffusion-weighted MR imaging. Eur J Radiol. 2015; 84:1444–51. https://doi.org/10.1016/j.ejrad.2015.05.003.
30. Yoon JH, Lee JM, Yu MH, Kiefer B, Han JK, Choi BI. Evaluation of hepatic focal lesions using diffusion-weighted MR imaging: comparison of apparent diffusion coefficient and intravoxel incoherent motion-derived parameters. J Magn Reson Imaging. 2014; 39:276–85. https://doi.org/10.1002/jmri.24158.
31. Jerjir N, Bruyneel L, Haspeslagh M, Quenet S, Coenegrachts K. Intravoxel incoherent motion and dynamic contrast-enhanced MRI for differentiation between hepatocellular adenoma and focal nodular hyperplasia. Br J Radiol. 2017; 90: 20170007. https://doi.org/10.1259/bjr.20170007.
32. Woo S, Lee JM, Yoon JH, Joo I, Han JK, Choi BI. Intravoxel incoherent motion diffusion-weighted MR imaging of hepatocellular carcinoma: correlation with enhancement degree and histologic grade. Radiology. 2014; 270:758–67. https://doi.org/10.1148/radiol.13130444.
33. Klauss M, Mayer P, Maier-Hein K, Laun FB, Mehrabi A, Kauczor HU, Stieltjes B. IVIM-diffusion-MRI for the differentiation of solid benign and malign hypervascular liver Lesions-Evaluation with two different MR scanners. Eur J Radiol. 2016; 85:1289–94. https://doi.org/10.1016/j.ejrad.2016.04.011.
34. Huang B, Wu L, Lu XY, Xu F, Liu CF, Shen WF, Jia NY, Cheng HY, Yang YF, Shen F. Small Intrahepatic Cholangiocarcinoma and Hepatocellular Carcinoma in Cirrhotic Livers May Share Similar Enhancement Patterns at Multiphase Dynamic MR Imaging. Radiology. 2016; 281: 150–7. https://doi.org/10.1148/radiol.2016151205.
35. Choi SH, Lee SS, Kim SY, Park SH, Park SH, Kim KM, Hong SM, Yu E, Lee MG. Intrahepatic Cholangiocarcinoma in Patients with Cirrhosis: Differentiation from Hepatocellular Carcinoma by Using Gadoxetic Acid-enhanced MR Imaging and Dynamic CT. Radiology. 2017; 282:771–81. https://doi.org/10.1148/radiol.2016160639.
36. Sun H, Xu Y, Xu Q, Shi K, Wang W. Rectal cancer: Short-term reproducibility of intravoxel incoherent motion parameters in 3.0T magnetic resonance imaging. Medicine (Baltimore). 2017; 96. https://doi.org/10.1097/md.0000000000006866.
37. Koo TK, Li MY. A Guideline of Selecting and Reporting Intraclass Correlation Coefficients for Reliability Research. J Chiropr Med. 2016; 15:155–63. https://doi.org/10.1016/j.jcm.2016.02.012.