
INTRODUCTION
Erythropoiesis in bone marrow (BM) is regulated by a host of signaling pathways [1–4], and key erythroid lineage-specific transcription factors (TF) such as the erythroid Krüppel-like factor (EKLF/KLF1), GATA1, RUNX1, FOG1, SCL and NF-E2 etc., [1, 2, 5–7]. Additionally, growth factors such as erythropoietin (Epo) play an indispensable role in facilitating differentiation of immature erythrocytes to become mature red blood cells (RBC) [8]. Genetic ablation or inactivating mutations in any of these molecules have been reported to be lethal for the survival of animals as these abnormalities result in severely defective erythropoiesis [9–15].
IL-2 signaling plays a critical role in the survival, proliferation and function of a variety of immune cells [16–18]. Also, it is a critical factor in maintaining immune homeostasis because of its influence on regulatory T (Treg) cells [19]. Il2−/− and all other mice with defective IL-2 signaling develop severe autoimmune pathologies due to lack of optimal Treg cell activity [20–23]. Severe immune pathologies have also been reported in case of humans having defects in IL-2 signaling [24]. We have recently shown that mice lacking IL-2 signaling have strong defects in erythrocyte differentiation and they develop anemia very early in life [25]. Though, the reasons behind this are not completely known, we have reported that Klf1 suppression is a major factor for anemia development in Il2−/− mice [25]. However, in addition to dysregulated KLF1 activity, whether other signaling molecules are also involved is so far unknown. Further, the molecular mechanism involved in Klf1 suppression in IL-2-deficient erythroid precursor cells has also not been elucidated.
Although, many TFs are involved in the regulation of BM erythropoiesis, the contributions of nuclear factor of activated T cell (NFAT) family TFs (NFATc1, NFATc2, NFATc3, NFATc4 and NFAT5) has so far not been investigated. Besides NFAT5, all other NFAT proteins are regulated by a calcium (Ca2+)-calcineurin-mediated mechanism [26, 27]. In mature lymphocytes, immune receptor (T cell receptor; TCR or B cell receptors; BCR) ligation with cognate ligands results in an increase in intracellular calcium levels in a phospholipase C-γ (PLC-γ)-dependent manner, which subsequently activate the serine-threonine phosphatase calcineurin. Active calcineurin dephosphorylates multiple serine residues in the cytoplasmic NFAT proteins facilitating their activation and nuclear translocation. Nuclear NFAT regulates gene expression related to cytokine production, cell cycle, cell death, and cell differentiation etc, [28, 29]. Besides the calcineurin-mediated pathway, NFAT proteins can also be activated by cytokines as has been reported in the context of preTCR-negative thymocytes [30]. On the other hand, NFAT5 mostly expressed in non-hematopoietic lineage cells is activated upon osmotic stress [31]. Alterations in NFAT activity have been reported to induce pathological conditions ranging from immunodeficiency to cancer [30, 32–34]. However, despite extensive analysis of the role of NFAT proteins in lymphocyte development and function, their role in erythropoiesis still need to be investigated. Here, by analyzing Il2−/− mice we show that an enhanced integrin-cAMP-NFAT signaling axis not only downregulated Klf1 expression but also increased the apoptosis of Il2−/− erythrocyte precursors. Our findings suggest that NFAT hyperactivity is a key mechanism that blocks erythrocyte differentiation and promotes anemia development in Il2−/− mice, which might also be operative in inducing anemia in humans.
RESULTS
Impaired NFAT activity in Il2-/- immature erythrocytes
IL-2 signaling in an all-or-none-dependent manner regulates erythropoiesis. This is evident from the severely reduced numbers of Ter119+ cells in the BM of Il2−/− mice compared to WT and Il2+/- mice (Figure 1A). During erythrocyte differentiation in BM, CD71+Ter119- erythroid precursor cells differentiate to the CD71+Ter119+ stage, where upon further signaling they finally develop into CD71-Ter119+ mature erythrocytes [35]. As reported earlier, lack of IL-2 signaling resulted in a block in erythrocyte differentiation at the transition of CD71+Ter119- cells to the CD71+Ter119+ stage [25]. As a result, in the BM of Il2−/− mice an accumulation of CD71+Ter119- cells and a paucity of Ter119+ cells were observed (Figure 1B). To investigate if NFAT proteins are involved in this defective erythropoiesis in Il2−/− mice, we analysed Nfat expression in erythrocytes. NFAT involvement in erythropoiesis has been suggested but their exact role is not clear until now [36]. Analysis of BM cells revealed a dose-dependent increase in Nfatc1, Nfatc2 and Nfatc3 expression in Il2−/− mice compared to littermate control mice (Figure 1C). A similar observation in isolated BM Ter119+ cells not only revealed erythrocyte-specific Nfat expression but also confirmed high Nfat expression in Il2−/− mice (Figure 1D).
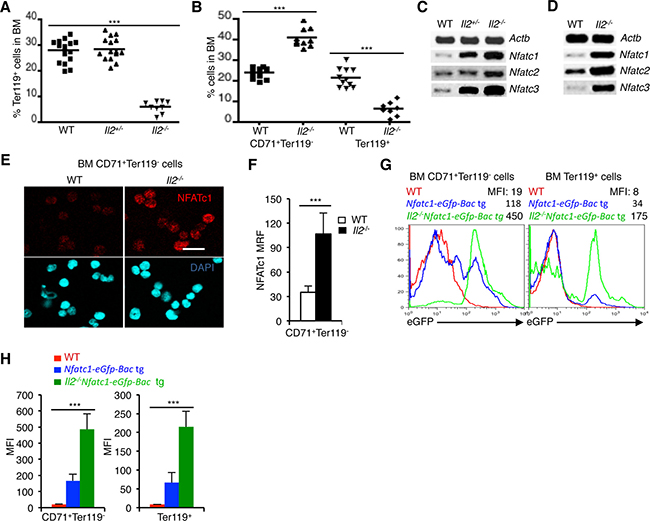
Figure 1: NFAT expression in erythrocytes. (A) Distribution of Ter119+ cells in the BM of Il2−/− mice compared to WT and Il2+/- littermate controls. (B) Distribution of CD71+Ter119- and Ter119+ (CD71+Ter119+ + CD71-Ter119+) erythrocyte precursor cells in the BM of WT and Il2−/− mice. (C) Expression levels of Nfatc1, Nfatc2 and Nfatc3 mRNA in total BM cells from indicated mice. (D) Nfatc1, Nfatc2 and Nfatc3 gene expression in isolated BM Ter119+ cells from WT and Il2−/− mice. (E) Immunofluorescence analysis of NFATc1 levels in sorted BM CD71+Ter119- cells from WT and Il2−/− mice. DAPI fluorescence indicates nuclear staining. Scale bar, 10 μm. (F) Quantification of NFATc1 mean relative fluorescence (MRF) in BM CD71+Ter119- cells from WT (n = 52) and Il2−/− (n = 42) mice. (G) GFP expression levels in BM CD71+Ter119- and Ter119+ (CD71+Ter119+ + CD71-Ter119+) cells from Il2−/−Nfatc1-eGfp-Bac tg reporter mice compared to WT and Nfatc1-eGfp-Bac tg mice. (H) Quantification of GFP expression levels in BM CD71+Ter119- and Ter119+ (CD71+Ter119+ + CD71-Ter119+) cells from indicated mice. Data in A and B are cumulative of multiple experiments, and in C-G are representative of 3 independent experiments, (n = 4 per group). In (A, B and F) ***p < 0.0001 and in (H) ***p = 0.0004 or 0.0006, one-way ANOVA and unpaired t-test.
At protein levels, immunofluorescence analysis revealed NFATc1 proteins in WT immature CD71+Ter119- cells (Figure 1E, 1F). Again, enhanced levels of NFATc1 in Il2−/− CD71+Ter119- cells compared to WT cells confirmed an increased NFAT activity in the immature erythrocytes in the absence of IL-2 signaling (Figure 1E, 1F). To further substantiate our observation regarding Nfat expression in erythrocytes, we analysed the levels of enhanced green fluorescent protein (eGFP) expression in CD71+Ter119- and Ter119+ (CD71+Ter119+ + CD71-Ter119+) BM cells from Nfatc1-eGfp-Bac transgenic (tg) reporter mice [37]. Detectable GFP levels in both populations in Nfatc1-eGfp-Bac tg mice confirmed an erythrocyte-specific Nfat expression (Figure 1G, 1H). Again, CD71+Ter119- and Ter119+ cells from Il2−/−Nfatc1-eGfp-Bac tg mice revealed higher GFP levels compared to Nfatc1-eGfp-Bac tg cells, confirming an increased NFAT activity in Il2−/− erythrocytes (Figure 1G, 1H). Additionally, GFP analysis also revealed a decrease in Nfatc1 expression in the more mature Ter119+ cells compared to the immature CD71+Ter119- cells, both in the Nfatc1-eGfp-Bac tg and Il2−/−Nfatc1-eGfp-Bac tg cells (Figure 1G, 1H) suggesting that NFAT activity could influence the transition of CD71+Ter119- cells to later stages.
Enhanced integrin-cAMP signaling in Il2-/- erythrocytes
We have recently reported an integrin-cAMP signaling-mediated regulation of Nfat expression in thymocytes and T cells [32]. Involvement of cAMP in integrin signaling has been reported previously [38–40]. Also, a previous study has reported involvement of integrin in erythrocyte development [4]. To investigate whether integrin-cAMP signaling also regulates Nfat expression in erythrocytes, we analyzed integrin expression on erythroid cells. Both at protein and mRNA levels, expression of various integrin were detectable in WT BM Ter119+ cells (Figure 2A, 2B). Integrin expression was highly variable as some integrin (Vcam1, Itgb3, Icam2, Icam1 and Sell) were expressed at higher level compared to others (Lfa2, Itgb2, Itga6, Itgav, Itgb1, Pecam1, Itga4, Itga5 and Selp), (Figure 2B). Interestingly, in Il2−/− Ter119+ cells a general and strong increase in expression of many integrin was observed (Figure 2A, 2B). Compared to WT cells, Il2−/− CD71+Ter119+ cells showed an increased expression of CD49d, CD2, and CD5 molecules (Figure 2A). Additionally, in Il2−/− Ter119+ cells an increased expression of other integrin (Lfa2, Itgb2, Itga6, Itgav, Itgb1, Pecam1, Itga4, Itga5 and Selp) (Figure 2B) suggested that enhanced integrin-cAMP signals might be involved in the upregulated NFAT expression in these cells. Supporting this conclusion, we observed increased expression of Adcy3 (adenylate cyclase 3) and Creb in Il2−/− Ter119+ cells compared to WT cells (Figure 2C). Efficient CREB (cAMP-response element binding) binding sequences at Nfatc1 promoter, as well as Forskolin or cAMP-CREB-mediated Nfatc1 transcriptional activation has been reported previously [41, 42]. Our observations suggest that an increased integrin-cAMP signaling that operates in Il2−/− erythroid cells is the reason behind enhanced NFAT activity in these cells.
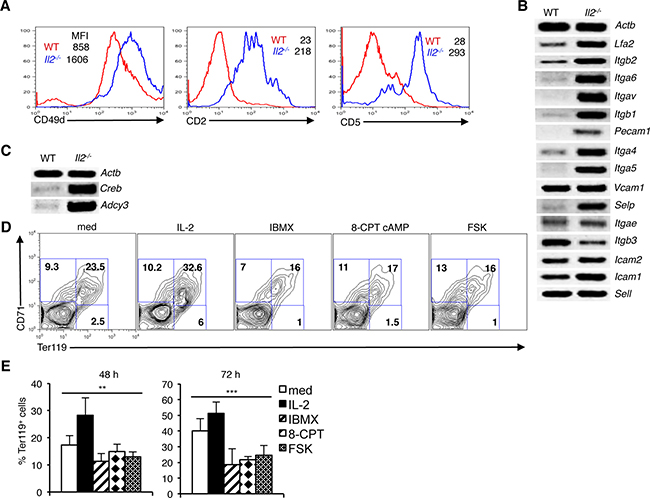
Figure 2: Integrin-cAMP signals influence erythrocyte differentiation. (A) Expression levels of CD49d, CD2 and CD5 on Ter119+ erythroid cells from WT and Il2−/− mice. (B) Level of mRNA expression of various integrins in Il2−/− Ter119+ cells compared to WT mice. (C) Expression of cAMP signaling-related genes Adcy3 and Creb in Il2−/− Ter119+ cells compared to that in WT mice. (D) Distribution of erythroid cells based on CD71 and Ter119 expression in WT BM cells cultured for 48 h either in medium only or in the presence of IL-2, IBMX, 8-CPT-cAMP or Forskolin (FSK). (E) Quantification of Ter119+ cells at 48 and 72 h of WT BM cell culture in the absence or presence of IL-2, IBMX, 8-CPT-cAMP or FSK. Data in (A–C) are representative of three and in (D and E) are representative of two independent experiments. Numbers inside the histograms in (A) represent mean fluorescence intensity (MFI) and numbers inside each FACS plot in (D) represent percent respective populations. Data in (E) are presented as mean ± s.d., **p = 0.0019, ***p = 0.001, one-way ANOVA.
To explore whether increased cAMP signaling influences erythrocyte differentiation, we treated Il2−/− BM cells with IL-2 or various cAMP-inducing agents. IL-2 treatment enhanced the differentiation of CD71+Ter119+cells, whereas increasing cAMP activity by treating cells with IBMX; an inhibitor of phosphodiesterase activity, or 8-CPT-cAMP; a cAMP analog, or with Forskolin reduced this differentiation (Figure 2D, 2E). This suggests that the increased integrin-cAMP signaling in Il2−/− mice exerts a negative influence on erythrocyte differentiation.
Lack of IL-2 signaling impairs Klf1 expression
The enhanced integrin expression in Il2−/− Ter119+ cells suggest that IL-2 signaling in WT cells most likely keeps the integrin-cAMP signaling in check and, thereby, facilitates differentiation of CD71+Ter119- cells to CD71+Ter119+ stage. If this was the case, immature erythrocytes should respond to IL-2 signals and, therefore, should express the IL-2 receptor (IL-2R). Analysis of IL-2R components revealed undetectable expression of Il2ra (Cd25), very low level of Il2rb (Cd122), and a relatively strong expression of Il2rg (Cd132) in WT erythroid cells (Figure 3A). Interestingly, compared to WT controls, in Il2−/− Ter119+ cells both at mRNA and protein levels all three IL-2R components were strongly upregulated (Figure 3A, 3B). Intriguingly, WT Ter119+ cells expressed higher levels of IL-2Rβ and IL-2Rγ compared to the immature CD71+Ter119- cells (Figure 3B). Again, Il2−/− Ter119+ cells not only expressed much higher levels of IL-2Rβ and IL-2Rγ but also significantly upregulated the expression of IL-2Rα, which was not detectable in WT Ter119+ cells (Figure 3B). These observations suggest that in immature erythrocytes IL-2 signals most likely dampen the integrin-cAMP levels to reduce NFAT activity and facilitate their differentiation.
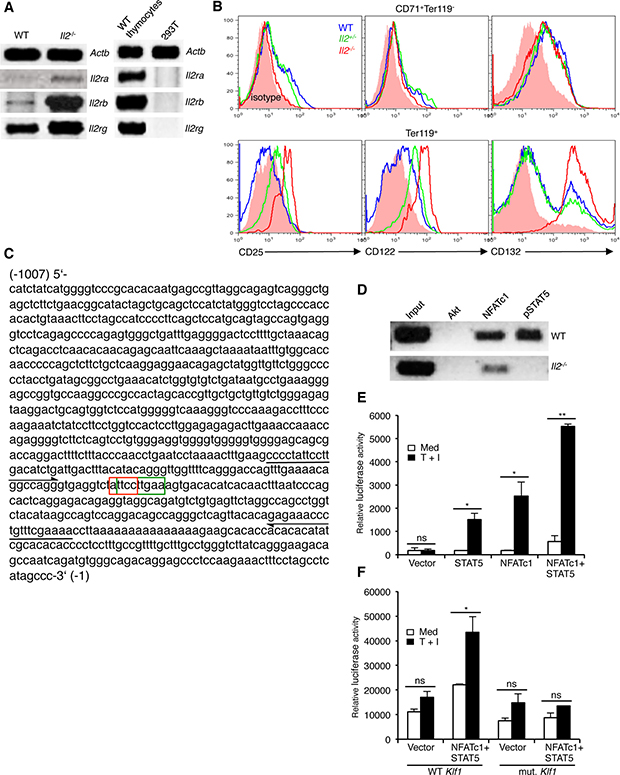
Figure 3: Impaired NFATc1 and STAT5 binding at Klf1 promoter in Il2−/− erythrocytes. (A) Expression of Il2ra, Il2rb and Il2rg genes in Il2−/− Ter119+ cells compared to WT cells. WT thymocytes and 293T cells were used as positive and negative controls respectively. (B) Intracellular expression of CD25 (IL-2Rα), CD122 (IL-2Rβ) and CD132 (IL-2Rγ) in BM CD71+Ter119- and Ter119+ (CD71+Ter119+ + CD71-Ter119+) cells from WT and Il2−/− mice. (C) Nucleotide sequence of 1kb DNA element upstream of the transcriptional start site containing the Klf1 gene promoter. The composite NFATc1 (3′-CCTTA-5′: red boxed) and STAT5 (5′-TTCNNNGAA-3′: green boxed) binding sites are indicated. Arrows in 5′ and 3′ directions indicate the region amplified in ChIP assays for NFATc1 and STAT5 binding to Klf1 promoter. (D) ChIP analysis for NFATc1 and STAT5 binding at the Klf1 promoter region as indicated in (C) in isolated Ter119+ cells from WT and Il2−/− mice. ChIP with Akt Abs was used as a negative control. (E) Luciferase reporter assay depicting the influence of NFATc1 and STAT5 on Klf1 promoter activity in unstimulated or TPA + Ionomycin (T + I) stimulated 293 HEK cells. (F) Effect of NFATc1 and STAT5 on mutant Klf1 promoter (TT-GA) activity in unstimulated or TPA + Ionomycin (T + I) stimulated 293 HEK cells. Data in (A, B, E and F) are representative of three, and in (D) are representative of two independent experiments. Data in (E and F) are presented as mean ± s.d., ns = not significant, and in (E) *p = 0.0178 or 0.0333 and **p = 0.0016, and in (F) *p = 0.0415, paired t-test.
To investigate the functional relevance of enhanced NFAT activity in Il2−/− erythroid cells, we hypothesized that most likely it suppresses Klf1 expression in these cells. Analysis of the DNA element 1kb upstream of the transcriptional start site of Klf1 gene revealed a composite binding site for NFAT (5′-GGAAA/T-3′) and STAT5 (5′-TTCNNNGAA-3′) (Figure 3C). Chromatin immunoprecipitation analysis revealed a strong NFATc1 binding at the Klf1 promoter in WT CD71+Ter119- cells (Figure 3D). However, we also observed an equally strong binding of STAT5 at the Klf1 promoter suggesting a possible cooperation between STAT5 and NFATc1 in regulating Klf1 expression. Accordingly, in reporter assays only STAT5 and NFATc1 together induced strong Klf1 promoter activity, whereas promoter activity was minimal to STAT5 or NFATc1 activity alone (Figure 3E). Further, STAT5 and NFATc1-induced Klf1 promoter activity was lost when the composite site was mutated (ATTCCTTGAA - AGACCTTGAA) (Figure 3F). STAT5 activity in response to erythropoietin (Epo) signaling has been reported to critically influence erythrocyte survival and differentiation [23, 43]. Interestingly, despite having increased NFATc1 levels, in Il2−/− CD71+Ter119- cells a strong impairment in NFATc1 binding to Klf1 promoter was observed (Figure 3D). This could be due to the absence of STAT5 activity in Il2−/− CD71+Ter119- cells as they not only are deficient in IL-2 signals, but also lack optimal Epo receptor (EpoR) expression [25]. These observations suggest that IL-2 signaling is essential for optimal Klf1 expression and thereby promotes erythropoiesis in the BM.
Enhanced cell death of immature erythrocytes in Il2-/- mice
To investigate whether enhanced NFAT activity exerts a negative influence on their survival, we analysed cell death in Il2−/− erythroid precursor cells. Annexin V analysis revealed a strong increase in apoptosis (50% vs 15% in BM and 40% vs 8% in spleen) of Il2−/− erythroid cells compared to WT mice (Figure 4A). The increased cell death in Il2−/− mice was mostly in the CD71+Ter119+ and CD71-Ter119+ compartments as cell death in the CD71+Ter119- stage was similar to that in WT mouse (Figure 4B). These observations suggest that anemia in Il2−/− mice is a combinatorial effect of Klf1 dysregulation and subsequent apoptosis of immature erythrocytes. Agreeing with this, we observed an increase in expression of Fasl, a prominent target of NFAT [44, 45], and also of Fas, Casp3, Casp8 and Bim in Il2−/− erythroid cells (Figure 4C). NFAT proteins have been shown to regulate activation-induced cell death (AICD) of T cells following an immune response in a Fas-FasL-dependent manner [46, 47]. Thus, enhanced Fas-FasL activity as well as upregulated activity of other apoptosis-promoting molecules in IL-2-deficient erythroid cells results in increased cell death leading to anemia development in Il2−/− mice.
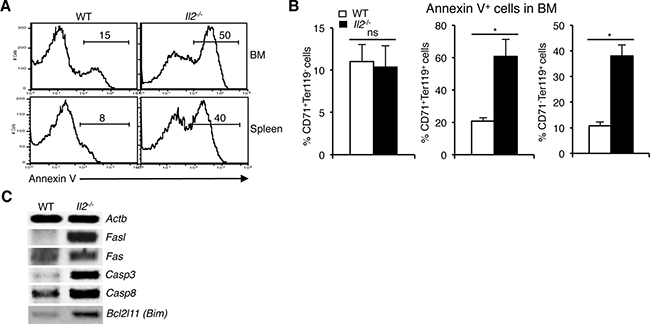
Figure 4: Enhanced NFAT signaling induces apoptosis in Il2−/− immature erythrocytes. (A) Cell death analysis in BM and splenic Ter119+ cells from WT and Il2−/− mice as revealed by Annexin V staining. (B) Quantification of % Annexin V positive cells in BM CD71+Ter119-, CD71+Ter119+ and CD71-Ter119+ fractions from WT and Il2−/− mice. (C) Expression of apoptosis-related genes in the BM Ter119+ cells from Il2−/− mice compared to WT controls. Data in (A–C) are representative of three independent experiments. Number inside each histogram represents percent Annexin V positive population. Data in (B) are presented as mean ± s.d., ns = not significant and *p = 0.7376 or 0.0141, paired t-test.
Ablation of NFAT activity promotes erythropoiesis
To investigate which NFAT protein is responsible for the defective erythropoiesis in Il2−/− mice, we analyzed various Nfat mutant mice. Analysis of Nfatc2−/− or Nfatc3−/− mice revealed comparable numbers of Ter119+cells in BM to that of littermate WT mice (Figure 5A). Further analysis for differentiation stages showed neither Nfatc2−/− nor Nfatc3−/− mice had any defect at the CD71+Ter119+ stage, and they differentiated to CD71-Ter119+erythrocytes similar to that in control mice (Figure 5B). Even the combined loss of NFATc2 and NFATc3 activity (Nfatc2−/−Nfatc3−/− mice) did not impair erythropoiesis in the BM (Figure 5B). These observations suggest that NFATc1 is the key erythrocyte-specific NFAT protein and overactivity of NFATc1 is probably inducing the erythropoietic defects and anemia in Il2−/− mice.
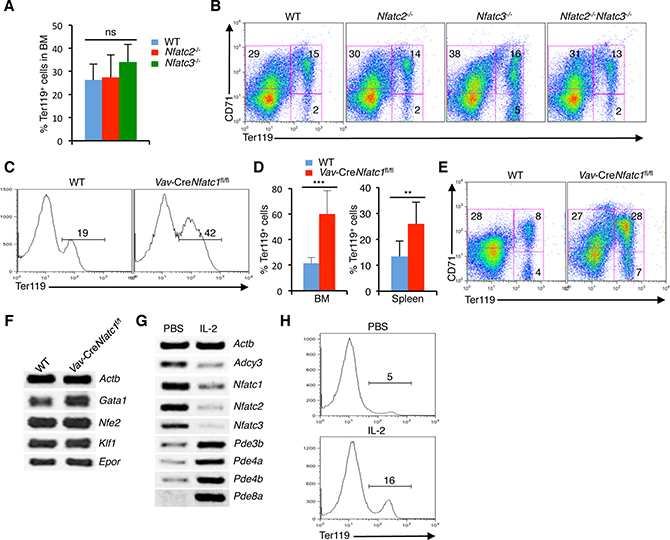
Figure 5: Reduction in NFATc1 activity facilitates erythropoiesis. (A) Quantification of BM Ter119+ cells in Nfatc2−/− and Nfatc3−/− mice compared to littermate control mice. (B) Distribution of erythroid cells based on CD71 and Ter119 expression in the BM of Nfatc2−/−, Nfatc3−/− and Nfatc2−/−Nfatc3−/− mice compared to WT mice. (C) Ter119+ cells distribution in the BM of Vav-CreNfatc1fl/fl mice compared to littermate control mice. (D) Quantification of percent Ter119+ cells in BM and spleen of Vav-CreNfatc1fl/fl mice compared to littermate WT mice. (E) Erythrocyte differentiation profile based on CD71 and Ter119 expression in the spleen of Vav-CreNfatc1fl/fl mice compared to WT littermates. (F) Expression of Gata1, Nfe2, Klf1 and Epor genes in BM Ter119+ cells from WT and Vav-CreNfatc1fl/fl mice. (G) Nfat and cAMP signaling-related genes expression in BM Ter119+ cells from PBS or IL-2 treated Il2−/− mice. (H) Distribution of Ter119+ cells in the BM of PBS or IL-2 treated Il2−/− mice. Data in (A–H) are representative of three or more independent experiments. Numbers inside each FACS plot represent percent respective populations. Data in (A and D) are presented as mean ± s.d., ns = not significant, in (D) **p = 0.0063 and ***p < 0.0001, one-way ANOVA and paired t-test.
Nfatc1−/− mice are embryonic lethal [48]. Therefore, we analyzed Vav-CreNfatc1fl/fl mice, which revealed an enhanced erythropoiesis, as they had significantly increased Ter119+ population both in BM and spleen compared to littermate WT mice (Figure 5C, 5D). This was in contrast with the normal erythropoiesis observed in Nfatc2−/−, Nfatc3−/− and Nfatc2−/−Nfatc3−/− mice (Figure 5A, 5B) indicating that manipulation of NFATc1 activity can influence erythropoiesis. Also, the increased Ter119+ population in Vav-CreNfatc1fl/fl mice was in contrast to the severely reduced numbers of Ter119+ cells in Il2−/− mice, suggesting that enhanced NFATc1 activity most likely has a negative influence on BM erythropoiesis. In line with the increase in Ter119+ cells, differentiation of CD71+Ter119- cells to Ter119+ stages was enhanced in Vav-CreNfatc1fl/fl mice compared to WT controls (Figure 5E). Further, Vav-CreNfatc1fl/fl Ter119+ cells expressed normal levels of Klf1 and Epor, which were suppressed in the Il2−/− mice (Figure 5F).
Next, we analysed if IL-2-deficiency is leading to enhanced NFAT activity, treatment with IL-2 should reverse this in Il2−/− mice. Interestingly, IL-2 treatment effectively downregulated Nfat expression in Il2−/− Ter119+cells (Figure 5G). Simultaneously, a strong downregulation in Adcy3, and upregulation in several phosphodiesterases (Pde3b, Pde4a, Pde4b, and Pde8a) in Il2−/− Ter119+ cells was observed. These observations further emphasize that the increased cAMP signaling was responsible for the enhanced NFAT activity in Il2−/− mice. As a result of downregulation in NFAT activity, erythropoiesis in IL-2 treated Il2−/− mice returned to normal, as more Ter119+ cells appeared in IL-2 treated mice compared to PBS treated controls (Figure 5H). Thus, by manipulating cAMP levels, IL-2 signals regulate NFAT activity in erythroid cells.
DISCUSSION
Our observation about Nfat expression in erythrocytes suggests they might have a role to play in erythropoiesis, and the increased NFAT activity in Il2−/− erythroid cells (Figure 1D–1H) could be one of the reasons that the Il2−/− mice suffer from severe anemia. We have shown previously that IL-2 critically regulates BM erythropoiesis in a Treg-dependent manner, and restoration of Treg activity or abolition of IFN-γ activity significantly reversed anemia in Il2−/− mice [25]. Also, recently we have reported that in a Treg-dependent manner IL-2 signaling plays an indispensable role in the maintenance of hematopoietic stem cell (HSC) integrity [49]. However, the lack of Treg activity though severely impairs BM erythropoiesis, additional factors and signaling molecules might be involved in the drastically reduced number of RBCs in Il2−/− mice. One possible reason for anemia in Il2−/−mice could be increased cell death of the differentiating erythrocytes. Our observation regarding increased apoptosis of Ter119+ populations in Il2−/− mice supports this notion (Figure 4A, 4B).
Most likely NFAT activity is essential at the early stages in the CD71+Ter119- cells and needs to be downregulated as the erythrocytes mature. This is evident from our analysis of the Nfatc1-eGfp-Bac tg reporter mice, where GFP levels were highest in the CD71+Ter119- cells but was reduced in the Ter119+ cells (Figure 1G, 1H). This probably happens via IL-2 signaling-mediated downregulation in cAMP levels in these cells. Our observations of downregulated Adcy3 and upregulated phosphodiesterases expression in IL-2 treated Il2−/− mice support this hypothesis (Figure 5G). Under this circumstance, Nfat expression was suppressed and erythropoiesis in Il2−/− mice was restored (Figure 5G, 5H). We have shown previously that integrin-cAMP signaling induces Nfat expression in thymocytes and T cells [32]. Similar to thymocytes, erythrocytes also express various integrin and their levels were strongly upregulated in the IL-2-deficient Ter119+ cells (Figure 2A, 2B). Increasing intracellular cAMP levels clearly has a negative influence on erythrocyte differentiation as fewer Ter119+ cells developed in in vitro BM cultures where cAMP levels were enhanced (IBMX, 8-CPT-cAMP or FSK treated cells) compared to the IL-2-treated cells (Figure 2D, 2E). This suggests that the developing erythrocytes are sensitive to IL-2 signaling.
IL-2 receptor expression in erythrocytes is so far not known. However, analysis of ‘ErythronDB’, the database containing genes expressed during erythropoiesis, shows robust expression of Il2rg in all stages of erythrocyte development [50, 51]. The absence of IL-2Rα and low levels of IL-2Rβ and IL-2Rγ expression in WT Ter119+ cells (Figure 3A, 3B) suggest that in erythrocytes IL-2 signals most likely are transduced via the intermediate-affinity IL-2Rβ + IL-2Rγ receptors, similar to that in naïve T cells [18]. However, the upregulated expression of IL-2R components in Il2−/− erythrocytes (Figure 3A, 3B) is quite surprising, and we still do not know the mechanism behind it. The presence of the composite NFAT and STAT5 binding sequence at the Klf1 promoter suggests that optimal NFAT and STAT5 activity might be an essential factor that regulates Klf1 expression in erythrocytes (Figure 3C). Enhanced NFAT activity in absence of STAT5 activity in Il2−/− erythrocytes failed to induce optimal Klf1 expression resulting in a differentiation block at the CD71+Ter119- to CD71+Ter119+ transition. Further, the induction of Klf1 promoter activity in response to combined NFATc1 and STAT5 activity (Figure 3E), and the loss of promoter activity when the composite site was mutated (Figure 3F) suggests that an optimal activity of essential TFs during erythrocyte differentiation stages is critical for normal erythropoiesis.
Our analysis of various Nfat mutant mice suggests that NFATc1 activity most likely plays an important role in erythrocyte differentiation. Neither single nor combined loss of NFATc2 and NFATc3 activity had any influence on Ter119+ cell development in the BM (Figure 5A, 5B). However, loss of hematopoietic cells-specific NFATc1 activity clearly induced augmented differentiation of CD71+Ter119- cells to the CD71+Ter119+ stage, which resulted in the generation of more Ter119+ erythrocytes in Vav-CreNfatc1fl/fl mice compared to WT controls (Figure 5C–5E). This was similar to what has been reported for mice deficient in Desert Hedgehog (Dhh) signalling [52]. The significant improvement in erythropoiesis in the IL-2 treated Il2−/− mice (Figure 5H), where upon IL-2 signaling Nfat expression was strongly reduced (Figure 5G) also supports the point that enhanced NFAT activity is harmful for erythrocyte differentiation.
Altogether, our observations suggest a critical role for IL-2 in maintaining steady state RBC number by regulating the integrin-cAMP-NFAT signaling axis (Figure 6). Manipulation of this signaling pathway could open up new avenues to modulate erythropoiesis and to prevent anemia development.
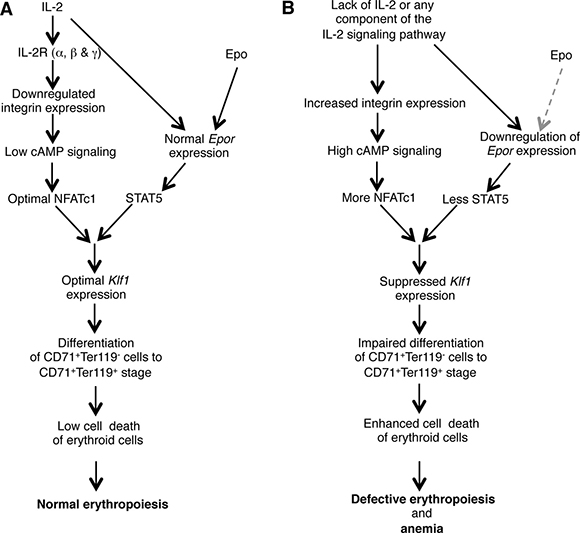
Figure 6: Model showing the role of IL-2 in maintaining BM erythropoiesis. (A) IL-2 signals are essential to lower the integrin-cAMP-NFAT signaling, and in facilitating optimal KLF1 and EpoR expression, which results in normal erythropoiesis in the BM. (B) Deficiency in IL-2 or of any component of IL-2 signaling pathway leads to upregulated integrin-cAMP-NFAT signaling as well as suppressed Klf1 and Epor expression. Both these defects combinedly result in enhanced cell death of immature erythrocytes leading to the development of severe anemia in IL-2 signaling-deficient mice. Grey dashed arrow represents lack of Epo signaling.
MATERIALS AND METHODS
Mice
C57BL/6 wild-type, Il2−/−, Nfatc1-eGfp-Bac tg, Il2−/−Nfatc1-eGfp-Bac tg, Nfatc1fl/fl, Vav-CreNfatc1fl/fl, Nfatc2−/−, Nfatc3−/−, and Nfatc2−/−Nfatc3−/− mice, all on C57BL/6 background and of 3–8 weeks age unless mentioned otherwise were used throughout the study. Animals were housed in the central animal facility (ZEMM) of the University of Würzburg, according to standard animal care protocols. All animal experiments were performed taking utmost care, and were according to established guidelines (approved by the Regierung von Unterfranken, Wuerzburg, Permit Number 55.2-2531.01-53/10B).
Flow cytometry
For flow cytometry, and Ter119+ BM cell isolation all antibodies were purchased either from BD Pharmingen or eBioscience. Anti-CD2 (RM2-5), anti-CD5 (53-7.3), anti-CD25 (PC61), anti-CD49d (R1-2), anti-CD71 (C2), anti-CD122 (TM-b1), anti-CD132 (TUGm2), anti-Ter119 (TER-119), annexin V and isotype-matched control antibodies either directly conjugated with fluorochromes or with biotin were used throughout this study. Biotinylated antibodies were revealed with secondary streptavidin-allophycocyanin or phycoerythrin-Cy5 (PE-Cy5) antibodies. Flow cytometry and data analysis were performed following standard procedure using FACSCalibur and FlowJo software.
Cell isolation and sorting
For cell isolation and sorting, BM cells from both hind limbs were collected and single cell suspension was prepared. Ter119+ BM cells were isolated using anti-Ter119 microbeads (Miltenyi Biotec) following manufacturer’s protocol. For cell sorting, BM cells were incubated with anti-CD71 and anti-Ter119 antibodies. CD71+Ter119-, CD71+Ter119+ and CD71-Ter119+ erythroid cells were sorted by using a FACSAria (BD Biosciences) flow cytometer.
Immunofluorescence staining
Sorted CD71+Ter119- BM cells from WT or Il2−/− mice were immunostained with NFATc1 (Santa Cruz, sc14034) antibodies following previously published protocol [30]. DAPI was used to confirm nuclear staining.
Intracellular staining
For intracellular CD25 (IL-2Rα), CD122 (IL-2Rβ) and CD132 (IL-2Rγ) staining, 5 × 10⁶ freshly prepared BM cells from WT and Il2−/− mice were used. Cells were first surface stained for CD71 and Ter119 followed by intracellular CD25, CD122 and CD132 staining according to eBioscience Foxp3 staining protocol. IL-2 receptors expression in erythroid cells was analyzed by gating on CD71+Ter119-, CD71+Ter119+ and CD71-Ter119+erythroid cells.
Cell death analysis
1 × 10⁶ freshly isolated WT or Il2−/− BM and spleen cells were used to evaluate apoptosis of total Ter119+ cells, or of gated CD71+Ter119-, CD71+Ter119+ and CD71-Ter119+ erythroid cells. BM cells were stained for CD71 and Ter119 and subsequently, live or dead cell discrimination was performed with annexin V staining following manufacturer’s protocol (BD Biosciences).
Chromatin immunoprecipitation
5–8 × 10⁶ WT or Il2−/− BM CD71+Ter119+ cells were used for each ChIP assay following the Miltenyi Biotec ChIP protocol. 8–10 μg of NFATc1 (Santa Cruz; sc-7294), pSTAT5 (NEB; 9314), and Akt (NEB; 9272) antibodies were used for immunoprecipitation. DNA fragments were purified and used to amplify the Klf1 promoter region bound to NFATc1 or STAT5. Primers used to amplify the Klf1 promoter region are mentioned in the Supplementary Table 1.
In vivo injections
6 weeks old male and female Il2-/- mice were injected on every alternate day with 1 μg recombinant murine IL-2 (rmIL-2, Peprotech) or an equal volume of PBS intraperitoneally for two consecutive weeks. Four days after getting the last injection, mice were analyzed to study the effects of IL-2 on erythropoiesis in the BM.
In vitro culture assay
3 × 10⁶ freshly isolated WT BM cells were either cultured in RPMI-1640 medium supplemented with 10% FCS only, or in presence of IL-2 (1 μg), IBMX (0.5 mM), 8-CPT-cAMP (50 μM) or Forskolin (50 μM). 48 or 72 h later cells were analyzed to investigate the influence of IL-2 or various cAMP-inducing agents on erythrocyte differentiation.
Semiquantitative RT-PCR
Total BM cells or magnetically isolated Ter119+ cells from WT or Il2−/− mice were used to synthesize cDNA using Miltenyi Biotec cDNA synthesis kit and protocol. Semiquantitative RT-PCR was performed to investigate the expression of indicated genes. Primer sequences are available in the supplementary information online.
Luciferase reporter assays
The 1007bp Klf1 promoter fragment was generated by amplification from murine genomic DNA (chr8: 87424731-87426061) using following primers: Fw.5´-AACTCGAGCATCTATCATGGGGTCCCGC-3´ and Rev.5´-TTAAGCTTGGGCTATGAGGCTAGGAAAG-3´. The blunt ended left (XhoI) and right (HindIII) arms were cloned into the corresponding XhoI and HindIII sites of pGL3 basic vector. 50 ng of murine Klf1 luciferase reporter construct containing the 1007bp DNA fragment spanning the promoter region (-960 to +47 bp) was co-transfected along with 500 ng control vectors, or expression vectors for a constitutively active STAT5 (STAT5ca) or NFATc1 (Nc1) alone, or with both STAT5 and NFATc1 into 293 HEK cells by polyethylenimine (PEI) (St. Louis, Missouri, USA) transfection method. 36 h post-transfection cells were left unstimulated or stimulated with PMA plus Ionomycin (100 ng/ml each, Calbiochem) for 12 h. Afterwards, luciferase activity representing the Klf1 promoter transactivation was measured using a MicroLumat LB 96P (EG&G Berthold) luminometer. For mutant Klf1 promoter construct, mutations in the composite STAT5-NFAT binding site (TT-GA) were introduced by site directed mutagenesis and promoter activity was assessed in response to STAT5 and NFATc1 activity.
Statistics
Data are presented as mean ± s.d. Statistical significance was assessed using Student’s t-test for comparison between two groups and ANOVA for differences between groups.
Author contributions
SG maintained mice colonies, genotyped mice, isolated cells and performed experiments. GW helped in experiments, SKH helped with the Nfatc1-eGfp-Bac tg reporter mice and in luciferase reporter assays. ES contributed in organizing study materials, data interpretation and inputs for manuscript writing. A.K.P. conceived the project, designed and performed experiments, supervised the study and wrote the manuscript.
ACKNOWLEDGMENTS
The authors thank A. Rao (La Jolla Institute for Allergy and Immunology) for Nfatc1fl/fl mice; D. Kioussis (Medical Research Council National Institute for Medical Research, London) for Vav-Cre mice; and C. Linden (University of Würzburg) for excellent cell sorting.
CONFLICTS OF INTEREST
The authors declare that they have no financial or commercial conflicts of interest.
FUNDING
This work was supported by a ‘PostDoc Plus Funding’ grant from the Graduate School of Life Sciences (GSLS), University of Wuerzburg, Germany (AP), the Deutsche José Carreras Leukämie-Stiftung e.V. grant (DJCLS R 15/12) (AP), a fellowship from the Vandervell Foundation, UK (AP), the Deutsche Forschungsgemeinschaft (DFG) grant TRR52 and the Wilhelm-Sander Foundation (SK-H and ES).
REFERENCES
1. Cantor AB, Orkin SH. Transcriptional regulation of erythropoiesis: an affair involving multiple partners. Oncogene. 2002; 21:3368–3376.
2. Perry C, Soreq H. Transcriptional regulation of erythropoiesis. Fine tuning of combinatorial multi-domain elements. Eur J Biochem. 2002; 269:3607–3618.
3. Hattangadi SM, Wong P, Zhang L, Flygare J, Lodish HF. From stem cell to red cell: regulation of erythropoiesis at multiple levels by multiple proteins, RNAs, and chromatin modifications. Blood. 2011; 118:6258–6268.
4. Eshghi S, Vogelezang MG, Hynes RO, Griffith LG, Lodish HF. Alpha4beta1 integrin and erythropoietin mediate temporally distinct steps in erythropoiesis: integrins in red cell development. J Cell Biol. 2007; 177:871–880.
5. Siatecka M, Bieker JJ. The multifunctional role of EKLF/KLF1 during erythropoiesis. Blood. 2011; 118:2044–2054.
6. Weiss MJ, Orkin SH. Transcription factor GATA-1 permits survival and maturation of erythroid precursors by preventing apoptosis. Proceedings of the National Academy of Sciences of the United States of America. 1995; 92:9623–9627.
7. Dore LC, Crispino JD. Transcription factor networks in erythroid cell and megakaryocyte development. Blood. 2011; 118:231–239.
8. Fried W. Erythropoietin and erythropoiesis. Exp Hematol. 2009; 37:1007–1015.
9. Nuez B, Michalovich D, Bygrave A, Ploemacher R, Grosveld F. Defective haematopoiesis in fetal liver resulting from inactivation of the EKLF gene. Nature. 1995; 375:316–318.
10. Perkins AC, Sharpe AH, Orkin SH. Lethal beta-thalassaemia in mice lacking the erythroid CACCC-transcription factor EKLF. Nature. 1995; 375:318–322.
11. Pevny L, Simon MC, Robertson E, Klein WH, Tsai SF, D’Agati V, Orkin SH, Costantini F. Erythroid differentiation in chimaeric mice blocked by a targeted mutation in the gene for transcription factor GATA-1. Nature. 1991; 349:257–260.
12. Fujiwara Y, Browne CP, Cunniff K, Goff SC, Orkin SH. Arrested development of embryonic red cell precursors in mouse embryos lacking transcription factor GATA-1. Proceedings of the National Academy of Sciences of the United States of America. 1996; 93:12355–12358.
13. Shivdasani RA, Mayer EL, Orkin SH. Absence of blood formation in mice lacking the T-cell leukaemia oncoprotein tal-1/SCL. Nature. 1995; 373:432–434.
14. Peters LL, Andrews NC, Eicher EM, Davidson MB, Orkin SH, Lux SE. Mouse microcytic anaemia caused by a defect in the gene encoding the globin enhancer-binding protein NF-E2. Nature. 1993; 362:768–770.
15. Levin J, Peng JP, Baker GR, Villeval JL, Lecine P, Burstein SA, Shivdasani RA. Pathophysiology of thrombocytopenia and anemia in mice lacking transcription factor NF-E2. Blood. 1999; 94:3037–3047.
16. Malek TR, Castro I. Interleukin-2 receptor signaling: at the interface between tolerance and immunity. Immunity. 2010; 33:153–165.
17. Boyman O, Sprent J. The role of interleukin-2 during homeostasis and activation of the immune system. Nat Rev Immunol. 2012; 12:180–190.
18. Liao W, Lin JX, Leonard WJ. Interleukin-2 at the crossroads of effector responses, tolerance, and immunotherapy. Immunity. 2013; 38:13–25.
19. Fontenot JD, Rasmussen JP, Gavin MA, Rudensky AY. A function for interleukin 2 in Foxp3-expressing regulatory T cells. Nat Immunol. 2005; 6:1142–1151.
20. Sadlack B, Merz H, Schorle H, Schimpl A, Feller AC, Horak I. Ulcerative colitis-like disease in mice with a disrupted interleukin-2 gene. Cell. 1993; 75:253–261.
21. Willerford DM, Chen J, Ferry JA, Davidson L, Ma A, Alt FW. Interleukin-2 receptor alpha chain regulates the size and content of the peripheral lymphoid compartment. Immunity. 1995; 3:521–530.
22. Suzuki H, Kundig TM, Furlonger C, Wakeham A, Timms E, Matsuyama T, Schmits R, Simard JJ, Ohashi PS, Griesser H, Taniguchi T, Paige CJ, Mak TW. Deregulated T cell activation and autoimmunity in mice lacking interleukin-2 receptor beta. Science. 1995; 268:1472–1476.
23. Socolovsky M, Fallon AE, Wang S, Brugnara C, Lodish HF. Fetal anemia and apoptosis of red cell progenitors in Stat5a-/-5b-/- mice: a direct role for Stat5 in Bcl-X(L) induction. Cell. 1999; 98:181–191.
24. Sharfe N, Dadi HK, Shahar M, Roifman CM. Human immune disorder arising from mutation of the alpha chain of the interleukin-2 receptor. Proceedings of the National Academy of Sciences of the United States of America. 1997; 94:3168–3171.
25. Chopra M, Langenhorst D, Beilhack A, Serfling E, Patra AK. Interleukin-2 critically regulates bone marrow erythropoiesis and prevents anemia development. Eur J Immunol. 2015; 45:3362–3374.
26. Hogan PG, Chen L, Nardone J, Rao A. Transcriptional regulation by calcium, calcineurin, and NFAT. Genes Dev. 2003; 17:2205–2232.
27. Crabtree GR, Olson EN. NFAT signaling: choreographing the social lives of cells. Cell. 2002; 109:S67–79.
28. Macian F. NFAT proteins: key regulators of T-cell development and function. Nat Rev Immunol. 2005; 5:472–484.
29. Serfling E, Klein-Hessling S, Palmetshofer A, Bopp T, Stassen M, Schmitt E. NFAT transcription factors in control of peripheral T cell tolerance. Eur J Immunol. 2006; 36:2837–2843.
30. Patra AK, Avots A, Zahedi RP, Schuler T, Sickmann A, Bommhardt U, Serfling E. An alternative NFAT-activation pathway mediated by IL-7 is critical for early thymocyte development. Nat Immunol. 2013; 14:127–135.
31. Lopez-Rodriguez C, Antos CL, Shelton JM, Richardson JA, Lin F, Novobrantseva TI, Bronson RT, Igarashi P, Rao A, Olson EN. Loss of NFAT5 results in renal atrophy and lack of tonicity-responsive gene expression. Proceedings of the National Academy of Sciences of the United States of America. 2004; 101:2392–2397.
32. Klein-Hessling S, Rudolf R, Muhammad K, Knobeloch KP, Maqbool MA, Cauchy P, Andrau JC, Avots A, Talora C, Ellenrieder V, Screpanti I, Serfling E, Patra AK. A threshold level of NFATc1 activity facilitates thymocyte differentiation and opposes notch-driven leukaemia development. Nat Commun. 2016; 7:11841.
33. Patra AK, Drewes T, Engelmann S, Chuvpilo S, Kishi H, Hunig T, Serfling E, Bommhardt UH. PKB rescues calcineurin/NFAT-induced arrest of Rag expression and pre-T cell differentiation. Journal of Immunology. 2006; 177:4567–4576.
34. Mancini M, Toker A. NFAT proteins: emerging roles in cancer progression. Nat Rev Cancer. 2009; 9:810–820.
35. Zhang J, Socolovsky M, Gross AW, Lodish HF. Role of Ras signaling in erythroid differentiation of mouse fetal liver cells: functional analysis by a flow cytometry-based novel culture system. Blood. 2003; 102:3938–3946.
36. Bogacheva O, Bogachev O, Menon M, Dev A, Houde E, Valoret EI, Prosser HM, Creasy CL, Pickering SJ, Grau E, Rance K, Livi GP, Karur V, et al. DYRK3 dual-specificity kinase attenuates erythropoiesis during anemia. J Biol Chem. 2008; 283:36665–36675.
37. Hock M, Vaeth M, Rudolf R, Patra AK, Pham DA, Muhammad K, Pusch T, Bopp T, Schmitt E, Rost R, Berberich-Siebelt F, Tyrsin D, Chuvpilo S, et al. NFATc1 induction in peripheral T and B lymphocytes. Journal of Immunology. 2013; 190:2345–2353.
38. Carrera AC, Rincon M, De Landazuri MO, Lopez-Botet M. CD2 is involved in regulating cyclic AMP levels in T cells. Eur J Immunol. 1988; 18:961–964.
39. Hahn WC, Rosenstein Y, Burakoff SJ, Bierer BE. Interaction of CD2 with its ligand lymphocyte function-associated antigen-3 induces adenosine 3′,5′-cyclic monophosphate production in T lymphocytes. Journal of Immunology. 1991; 147:14–21.
40. Meyer CJ, Alenghat FJ, Rim P, Fong JH, Fabry B, Ingber DE. Mechanical control of cyclic AMP signalling and gene transcription through integrins. Nat Cell Biol. 2000; 2:666–668.
41. Chuvpilo S, Jankevics E, Tyrsin D, Akimzhanov A, Moroz D, Jha MK, Schulze-Luehrmann J, Santner-Nanan B, Feoktistova E, Konig T, Avots A, Schmitt E, Berberich-Siebelt F, et al. Autoregulation of NFATc1/A expression facilitates effector T cells to escape from rapid apoptosis. Immunity. 2002; 16:881–895.
42. Park HJ, Baek K, Baek JH, Kim HR. The cooperation of CREB and NFAT is required for PTHrP-induced RANKL expression in mouse osteoblastic cells. J Cell Physiol. 2015; 230:667–679.
43. Socolovsky M, Nam H, Fleming MD, Haase VH, Brugnara C, Lodish HF. Ineffective erythropoiesis in Stat5a(-/-)5b(-/-) mice due to decreased survival of early erythroblasts. Blood. 2001; 98:3261–3273.
44. Kavurma MM, Khachigian LM. Signaling and transcriptional control of Fas ligand gene expression. Cell Death Differ. 2003; 10:36–44.
45. Rengarajan J, Mittelstadt PR, Mages HW, Gerth AJ, Kroczek RA, Ashwell JD, Glimcher LH. Sequential involvement of NFAT and Egr transcription factors in FasL regulation. Immunity. 2000; 12:293–300.
46. Latinis KM, Norian LA, Eliason SL, Koretzky GA. Two NFAT transcription factor binding sites participate in the regulation of CD95 (Fas) ligand expression in activated human T cells. J Biol Chem. 1997; 272:31427–31434.
47. Li-Weber M, Laur O, Krammer PH. Novel Egr/NF-AT composite sites mediate activation of the CD95 (APO-1/Fas) ligand promoter in response to T cell stimulation. Eur J Immunol. 1999; 29:3017–3027.
48. de la Pompa JL, Timmerman LA, Takimoto H, Yoshida H, Elia AJ, Samper E, Potter J, Wakeham A, Marengere L, Langille BL, Crabtree GR, Mak TW. Role of the NF-ATc transcription factor in morphogenesis of cardiac valves and septum. Nature. 1998; 392:182–186.
49. Giampaolo S, Wojcik G, Serfling E, Patra AK. Interleukin-2-regulatory T cell axis critically regulates maintenance of hematopoietic stem cells. Oncotarget. 2017; 8:29625–29642. https://doi.org/10.18632/oncotarget.16377.
50. Kingsley PD, Greenfest-Allen E, Frame JM, Bushnell TP, Malik J, McGrath KE, Stoeckert CJ, Palis J. Ontogeny of erythroid gene expression. Blood. 2013; 121:e5–e13.
51. Greenfest-Allen E, Malik J, Palis J, Stoeckert CJ Jr. Stat and interferon genes identified by network analysis differentially regulate primitive and definitive erythropoiesis. BMC Syst Biol. 2013; 7:38.
52. Lau CI, Outram SV, Saldana JI, Furmanski AL, Dessens JT, Crompton T. Regulation of murine normal and stress-induced erythropoiesis by Desert Hedgehog. Blood. 2012; 119:4741–4751.