
INTRODUCTION
Hypoxia is a crucial determinant of the aggressiveness of solid tumors [1]. Because of the rapid growth of tumor cells and inadequate vascular distribution in the tumor microenvironment, an imbalance in oxygen delivery and consumption results in hypoxia [2, 3]. Previous studies have shown that hypoxia can affect the proliferation, invasion, and metastasis of tumors [4, 5], the induction of apoptosis [6], and angiogenesis [7]. Tumors become more aggressive as a result.
N-myc downstream-regulated gene 1 (NDRG1) has various effects on tumor cell function. It has been reported to respond to many stressful environments, such as DNA damage [8] and hypoxia [9, 10]. In hypoxia, up-regulation of NDRG1 leads to cellular differentiation, proliferation, re-distribution of the cell cycle, and metastasis [11–13]. The expression of NDRG1 depends on both transcriptional and epigenetic regulation. In transcriptional regulation, many transcription factors, such as HIF-1 [13], aryl hydrocarbon receptor (AHR) [14], and activating protein 1 (AP-1) [15], have been reported to bind to NDRG1’s promoter and activate its expression. Regarding epigenetic regulation, NDRG1 was reported to be regulated epigenetically by histone acetylation [16] and microRNA-769-3p [17]. However, no studies have indicated that NDRG1 is regulated by DNA methylation or non-coding RNA.
Long non-coding RNAs (lncRNAs) comprise a subgroup of non-coding RNAs whose lengths are greater than 200 nucleotides. Recent studies have indicated that many lncRNAs respond to cellular stresses, such as drugs [18], hormones [19, 20], radiation [21, 22], and hypoxia [23–25]. lncRNAs respond to these stimuli by participating in several steps of gene expression, leading to changes in cellular function. For example, lncRNAs epigenetically regulate gene expression [26, 27], inhibit target gene degradation [28], block the effect of microRNA (miRNA) by forming a sponge structure to absorb miRNA [29, 30], and regulate synthesis and degradation of target proteins [31, 32]. Although some oxygen-responsive lncRNAs have been identified and play a role in the onset of several cancers [27, 32], genomic profiling of lncRNAs regulated by oxygen in breast cancer remained to be explored.
In this study, next-generation sequencing was used to identify oxygen-responsive lncRNAs in MCF-7 breast cancer cells. Among these differentially expressed lncRNAs, we chose a hypoxia-induced lncRNA, NDRG1-OT1, for further analysis, particularly the isoform NDRG1-OT1_v4, which had the highest expression levels in hypoxia. In order to identify genes regulated by NDRG1-OT1_v4, the genomic expression profiling of MCF-7 cells overexpressing NDRG1-OT1_v4 in normoxia was examined. Among the NDRG1-OT1_v4-regulated genes, we focused on NDRG1 and found that NDRG1-OT1_v4 inhibited NDRG1 expression by promoting NDRG1 degradation via the ubiquitin-proteasome pathway.
RESULTS
Identification of lncRNA expression profiles in different O2 conditions
In order to examine all lncRNAs regulated by O2 in MCF-7 cells, cells were harvested under normoxia (O2), hypoxia (N2), and re-oxygenation (Re-O2) conditions in triplicate. The lncRNA expression profiles were analyzed using a next-generation sequencing (NGS) system. A Student’s t-test was conducted to examine the difference in FPKMs between each condition. The criteria for selecting O2-responsive lncRNAs consisted of fold change > 3 and significant differences (P <0.001) between the N2 and O2 conditions (Figure 1A) as well as Re-O2 and N2 (Figure 1B). In addition, lncRNAs were further filtered to include only those with an opposite response between shifting from normoxia to hypoxia and from hypoxia to re-oxygenation, but similar expression levels between normoxia and re-oxygenation (Figure 1C). In total, 472 lncRNAs met these criteria (Figure 1C). Among them, 49% (n = 231) were up-regulated in N2 and down-regulated in Re-O2, while 51% (n = 241) were down-regulated in N2 and up-regulated in Re-O2 (Figure 1D). Lastly, principal component analysis (PCA) using expression levels of these 472 O2-responsive lncRNAs also showed distinct clusters of transcriptional responses for each condition (Figure 1E).
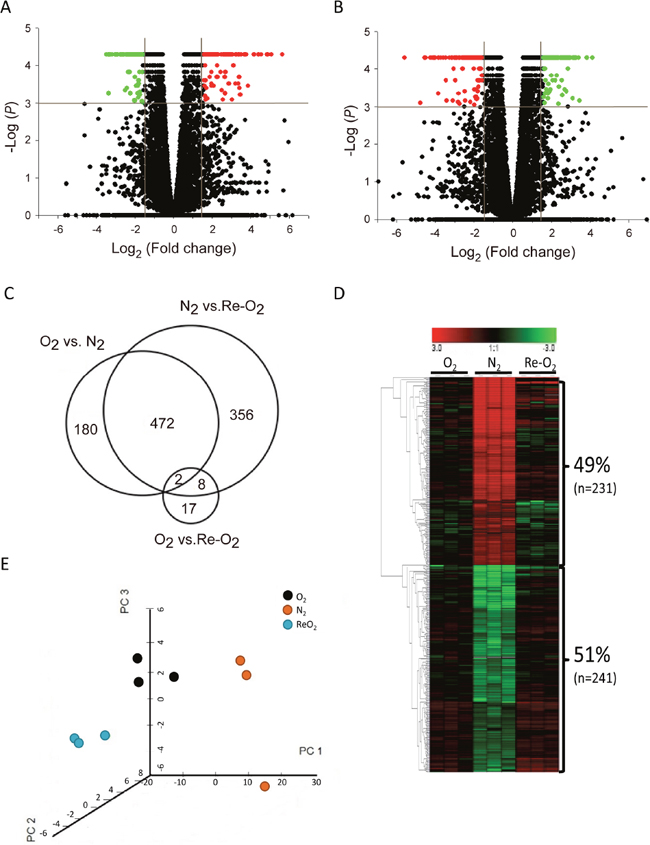
Figure 1: Identification of oxygen-responsive lncRNAs in MCF-7 cells using next generation sequencing analysis. (A) Volcano plots of differentially expressed lncRNAs responding to hypoxia (N2). Criteria for selecting O2-responsive lncRNAs: fold change >3X and P <0.001. Red points: up-regulated lncRNAs in N2; green points: down-regulated lncRNAs in N2. (B) Volcano plots of differentially expressed lncRNAs responding to reoxygenation (ReO2). Criteria for selection were as in panel (A). Red points: down-regulated lncRNAs in ReO2; green points: up-regulated lncRNAs in ReO2. (C) Venn diagram of differentially expressed lncRNAs in different O2 conditions. O2: normoxia. (D) Heat map and hierarchical cluster analysis of O2-responsive lncRNAs. Red: up-regulated lncRNAs in N2 and down-regulated in ReO2; green: down-regulated lncRNAs in N2 and up-regulated in ReO2. (E) Principal component analysis (PCA) of O2-responsive lncRNAs. PCA was plotted using expression of differentially expressed probes after quantile normalization. Each dot represents each sample. Three independent experiments were done in normoxia (black), hypoxia (orange), and re-oxygenation (cyan) respectively.
NDRG1-OT1 was hypoxia responsive lncRNA
Among these differentially expressed lncRNAs, we used quantitative RT-PCR to validate the expression profiles of the top three hypoxia-inducible lncRNAs: lnc-CPN2-1, lnc-C11orf35-2 and lnc-NDRG1-1. LncRNA MALAT1 was used as a positive control for hypoxia [33]. Similar to the expression pattern in NGS, all three lncRNAs were significantly up-regulated under N2 and down-regulated under Re-O2 (Figure 2A). Especially, we were particularly interested in lnc-NDRG1-1. The main reason was that lnc-NDRG1-1 was located in NDRG1 (Figure 2B), which has been systemically investigated in our lab [14, 17, 34]. Therefore, we decided to investigate the relationship between this lncRNA and NDRG1 in the following experiments. In addition, following the guidelines on gene nomenclature of the Human Genome Organization (HUGO), we renamed lnc-NDRG1-1 as NDRG1-OT1, which it is called hereafter. As shown in Figure 2B, NDRG1-OT1 has five isoforms. The expression levels of these isoforms in MCF-7 cells under different O2 conditions were different (Table 1). Among them, excluding v1 and v3 transcripts that did not express in normoxia, the v4 transcript had the highest expression level in N2 and the largest fold changes among different O2 environments. The phenomenon were observed in other breast cancer cell lines (Figure 2C). Therefore, we investigated the role of this isoform in the regulatory mechanisms of NDRG1-OT1 on its target genes under different O2 conditions.
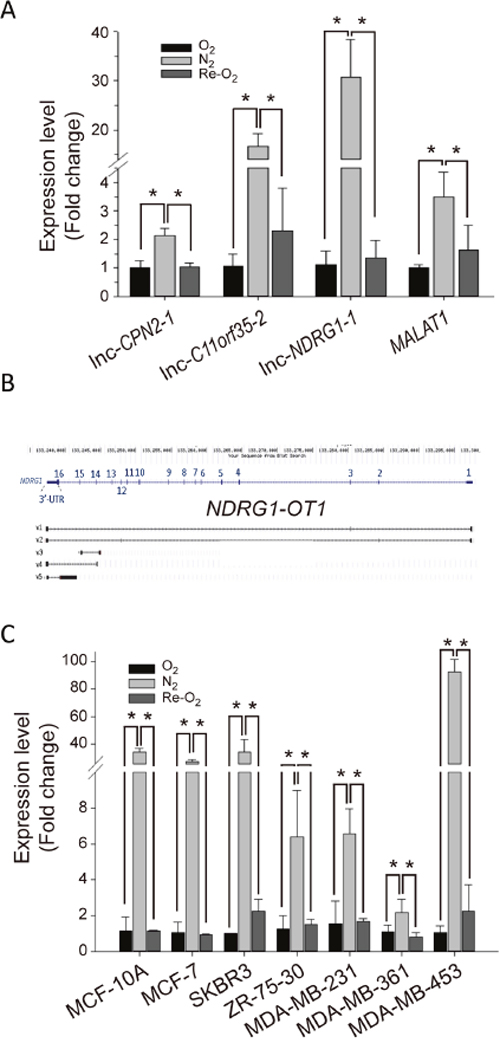
Figure 2: NDRG1-OT1_v4 is up-regulated in hypoxia and down-regulated in re-oxygenation. (A) Validation of lnc-CPN2-1, lnc-C11orf35-2, lnc-NDRG1-1 and MALAT1 expression levels among different O2 conditions by quantitative RT-PCR. Internal control: 18s. Positive control for hypoxia: MALAT1 [33]. The relative expression level of each condition was normalized to O2. Data were repeated at least 3 times, and the results are means ± SDs. *, P <0.05. (B) Schematic diagram of NDRG1-OT1 isoforms. Transcription of NDRG1-OT1 was overlapped with NDRG1, located in chromosome 8. The exon number and position are shown on the sequence of NDRG1. v1-v5 indicate the different isoforms. (C) Expression profiling of NDRG1-OT1_v4 in six breast cancer cells and one breast normal cell line (MCF-10A) under different O2 conditions.
Table 1: The amount of NDRG1-OT1 isoforms among different O2 conditions
NDRG1-OT1 isoform |
O2 |
N2 |
ReO2 |
|||
|---|---|---|---|---|---|---|
FPKM (%) |
Read count |
FPKM (%) |
Read count |
FPKM (%) |
Read count |
|
NDRG1-OT1_v1 |
0.0 |
0.0 |
0.0 |
0.0 |
0.0 |
0.0 |
NDRG1-OT1_v2 |
4.6 |
16.3 |
119.7 (38.1) |
441.0 |
2.1 |
6.9 |
NDRG1-OT1_v3 |
0.0 |
0.0 |
4.0 |
7.7 |
0.0 |
0.0 |
NDRG1-OT1_v4 |
3.6 |
9.3 |
182.4 (58.0) |
490.17 |
6.8 |
16.7 |
NDRG1-OT1_v5 |
0.4 |
7.6 |
8.2 |
175.17 |
0.3 |
5.5 |
FPKM, fragments per kilobase of transcript per million mapped reads.
Gene expression profiling in MCF-7 cells overexpressing NDRG1-OT1_v4
In order to identify genes regulated by NDRG1-OT1_v4, the gene expression of wild type MCF-7 cells and MCF-7 cells overexpressing NDRG1-OT1_v4 in O2 was compared using Illumina Human HT-12 v4 BeadChips. Student’s t-test was used to examine the difference in gene expression intensities. The criteria for defining NDRG1-OT1_v4-regulated genes included fold change > 2 and significant differences (P <0.05) (Figure 3A). In total, 108 genes met the criteria, with 47 induced by NDRG1-OT1_v4 and 61 inhibited by NDRG1-OT1_v4 (Figure 3B). To validate the NDRG1-OT1_v4-regulated genes identified by microarray, we used RT-PCR to examine the top five differentially expressed genes responding to ectopic NDRG1-OT1_v4 (Table 2). As shown in Figure 3C, the results of RT-PCR, except CLEC2D, were similar to those of microarray. Furthermore, pathway analysis showed that these genes were involved in the antigen presentation pathway, tRNA charging, sperm motility, eNOS signaling, and protein ubiquitination (Figure 3D).
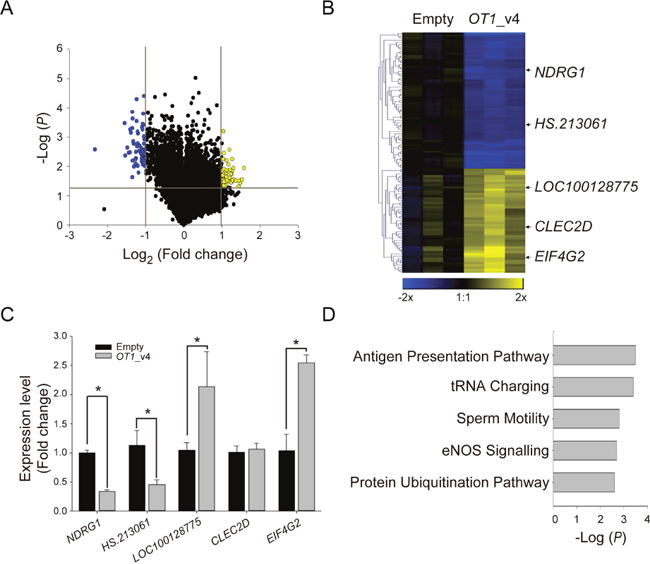
Figure 3: Identification of NDRG1-OT1_v4-regulated genes using microarray analysis. (A) Volcano plot of differentially expressed genes in MCF-7 cells over-expressing NDRG1-OT1_v4 in O2. Criteria for selecting NDRG1-OT1_v4 regulated genes: fold change >2X and P <0.05. Yellow points: up-regulated genes in cells over-expressing NDRG1-OT1_v4; blue points: down-regulated genes. (B) Heat map and hierarchical cluster analysis of NDRG1-OT1_v4-regulated genes. Yellow: up-regulated genes in cells over-expressing NDRG1-OT1_v4; blue: down-regulated genes. Top five differentially expressed genes were indicated. (C) Relative transcriptional levels of the top five differentially expressed genes in MCF-7 cells overexpressing NDRG1-OT1_v4 by quantitative RT-PCR. Internal control: 18s. The relative expression level was normalized to empty vector. (D) Top five pathways in which NDRG1-OT1_v4 regulated genes were enriched using Ingenuity Pathway Analysis (IPA). The significance of pathways was determined by IPA’s default threshold (-log(P-value) < 1.3).
Table 2: Top five differentially expressed genes responding to ectopic NDRG1-OT1_v4
Gene |
Fold change (log2) |
P-value |
Rank (|Fold change|) |
|---|---|---|---|
NDRG1 |
-2.32 |
3.0x10⁻³* |
1 |
HS.213061 |
-1.58 |
1.2x10⁻²* |
2 |
LOC100128775 |
1.53 |
4.0x10⁻³* |
3 |
EIF4G2 |
1.53 |
2.9x10⁻²* |
4 |
CLEC2D |
1.49 |
3.7x10⁻²* |
5 |
*P <0.05 was considered significant.
NDRG1 mRNA and protein levels are down-regulated by NDRG1-OT1_v4
Among the top five differentially expressed genes, we were particularly interested in NDRG1 because it is a hypoxia-responsive gene with the highest fold change in response to ectopic expression of NDRG1-OT1_v4. We used quantitative RT-PCR and western blotting to validate NDRG1 mRNA (Figure 4A&4B) and protein levels (Figure 4C–4F) in MCF-7 and SKBR3 breast cancer cells. Both transcript and protein levels of NDRG1 were significantly down-regulated in cells overexpressing NDRG1-OT1_v4.
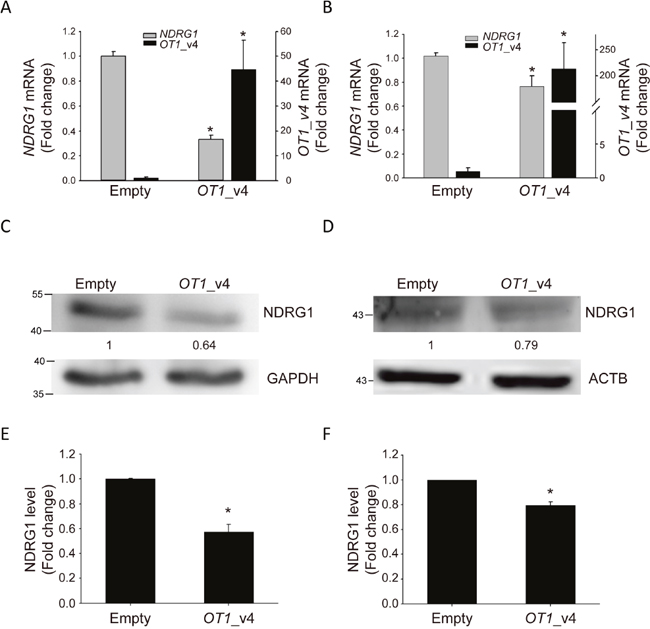
Figure 4: NDRG1-OT1_v4 inhibits NDRG1 mRNA and protein levels. (A and B) Relative transcriptional level of NDRG1 (gray, left axis) and NDRG1-OT1_v4 (black, right axis) in MCF-7 (A) and SKBR3 (B) cells overexpressing NDRG1-OT1_v4. Two μg of plasmid were transfected into MCF-7 cells. NDRG1 mRNA was measured by quantitative RT-PCR. Internal control: 18s. The relative expression levels were normalized to empty vector. (C and D) Western blot of NDRG1 in NDRG1-OT1_v4 overexpressed MCF-7 (C) and SKBR3 (D) cells. Relative protein amount of NDRG1 in MCF-7 cells overexpressing NDRG1-OT1_v4. Internal control: GAPDH (C) and ACTB (D). (E and F) Quantification of NDRG1 in MCF-7 (E) and SKBR3 (F) cells transfected with NDRG1-OT1_v4 plasmid. The relative expression levels were normalized to empty vector. Data were repeated at least 3 times, and the results are the means ± SDs *, P <0.05.
NDRG1_OT1_v4 promotes NDRG1 ubiquitination and degradation
Since the protein ubiquitination pathway was one of the pathways that NDRG1-OT1_v4-regulated genes were involved in (Figure 3D), we next investigated whether NDRG1-OT1_v4 down-regulated NDRG1 by affecting the stability of NDRG1. We first examined the stability of NDRG1 mRNA by treating cells with a transcriptional inhibitor, actinomycin D (10 μg/mL). MCF-7 & SKBR3 cells were harvested at the indicated time points (0, 2, 4, 8 h) after treatment. As shown in Figure 5A&5B, the degradation of NDRG1 mRNA was not affected by NDRG1-OT1_v4.
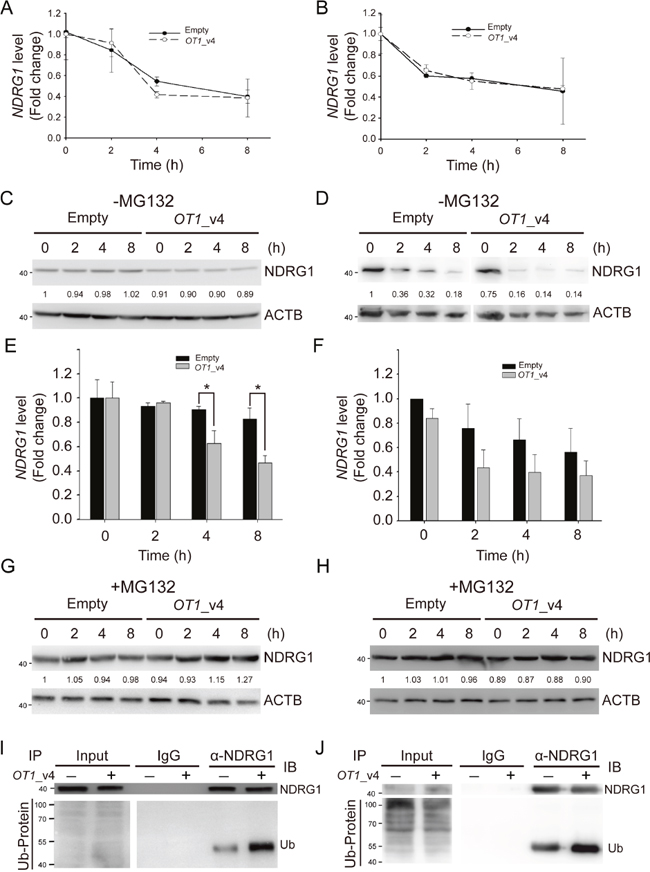
Figure 5: NDRG1-OT1_v4 promotes NDRG1 degradation via ubiquitination. (A and B) Temporal profile of NDRG1 in NDRG1-OT1_v4-overexpressed MCF-7 (A) and SKBR3 (B) cells treated with actinomycin D (10 μg/mL). NDRG1 mRNA was measured by quantitative RT-PCR. Internal control: 18s. (C and D) Western blot of NDRG1 in NDRG1-OT1_v4-overexpressed MCF-7 (C) and SKBR3 (D) cells treated with cycloheximide (10 μg/mL). (E and F) Quantification of NDRG1 in (C&D). The results are the means ± SDs. *, P <0.05. (G and H) Western blot of NDRG1 in NDRG1-OT1_v4-overexpressed MCF-7 (G) and SKBR3 (H) cells treated with cycloheximide (10 μg/mL) and MG132 (20 μg/mL). (I and J) Co-immunoprecipitation of NDRG1 and ubiquitin in MCF-7 (I) and SKBR3 (J) cells overexpressing NDRG1-OT1_v4 in the presence of MG132 (20 μg/mL). Cells were immunoprecipitated with NDRG1 antibody, followed by western blotting. Data were repeated at least 3 times.
Next, in order to examine the effects of NDRG1-OT1_v4 on stability of NDRG1 protein, cells overexpressing NDRG1-OT1_v4 were examined by treating with a protein synthesis inhibitor, cycloheximide (10 μg/mL). Within 8 h after cycloheximide treatment, the protein levels of NDRG1 were significantly diminished in cells overexpressing NDRG1-OT1_v4 compared to control cells, indicating NDRG1-OT1_v4 promoted NDRG1 degradation (Figure 5C–5F). When MCF-7 & SKBR3 cells were treated with both cycloheximide and MG132, a proteasome inhibitor, NDRG1-OT1_v4 no longer promoted NDRG1 degradation (Figure 5G&5H). In addition, to examine whether down-regulation of NDRG1 by NDRG1-OT1_v4 was via the ubiquitin-proteasome system, we performed immunoprecipitation with an anti-NDRG1 antibody, followed by immunoblotting using an anti-ubiquitin antibody. The results showed that NDRG1-OT1_v4 increased ubiquitin binding to NDRG1 (Figure 5I&5J). These results suggest that NDRG1-OT1_v4 inhibits NDRG1 expression through the ubiquitin-proteasome pathway.
DISCUSSION
To identify oxygen-responsive lncRNAs in breast cancer, we identified 472 lncRNAs responding to changes in oxygen concentration. Among these lncRNAs, NDRG1-OT1, especially NDRG1-OT1_v4 isoform, was the most responsive to oxygen changes. Next, NDRG1-OT1_v4 was overexpressed in MCF-7 cells under normoxia and NDRG1 was chosen for further analysis because it had the greatest fold change in expression. Lastly, we identified the mechanism by which NDRG1-OT1_v4 inhibits NDRG1 via ubiquitin-mediated proteolysis.
In this study, NGS was used to identify oxygen-responsive lncRNAs in breast cancer MCF-7 cells (Figure 1). Among the oxygen-responsive lncRNAs, NDRG1-OT1 was chosen for further analysis based on several reasons. First, NDRG1-OT1 was in the top three lncRNAs that were strongly up-regulated under hypoxia and down-regulated under re-oxygenation. Second, since lncRNA usually up/down-regulates its neighboring genes [27, 35], we found that NDRG1-OT1 was transcribed within the hypoxia-inducible gene NDRG1 (Figure 2B). Therefore, we hypothesized that NDRG1-OT1 may participate in breast cancers acclimatizing to hypoxia and hence chose NDRG1-OT1 for further experiments.
lncRNAs usually have more than one transcript form, and different isoforms have different biological functions. For example, UCA1 has three isoforms, but only the 1.4 kb (v1) isoform promotes bladder cancer proliferation and metastasis [31]. Similarly, NDRG1-OT1 has five isoforms. Four of the five NDRG1-OT1 isoforms, including v4, contained the NDRG1 3’-UTR, but only NDRG1-OT1_v4 contained parts of the NDRG1 14th exon and 14th intron. Since NDRG1-OT1_v4 had the highest expression level and proportion under hypoxia, we speculated that the 14th exon and 14th intron of NDRG1-OT1_v4 may play a pivotal role in regulating cell functions under hypoxia.
To explore the function of NDRG1-OT1_v4, we used microarray to identify genes regulated by NDRG1-OT1_v4. Pathway analyses showed that these NDRG1-OT1_v4 regulated genes were involved in the antigen presentation pathway, tRNA charging, sperm motility, endothelial nitric oxide synthase (eNOS) signaling, and the proteasome-ubiquitination pathway (Figure 3D). Since NDRG1-OT1_v4 was a hypoxia-inducible lncRNA, these pathways should be associated with hypoxia too. Indeed, previous studies have demonstrated that hypoxia increased T cell stimulation in dendrite cells [36], cardiac and hepatic eNOS production [37], and protein ubiquitination [38]. Hypoxia also negatively regulated the motility of sperm [39]. Moreover, some studies have discovered that hypoxia influences ubiquitin-mediated proteolysis via lncRNAs [23, 32].
In this study, we found that NDRG1-OT1_v4 inhibited its overlapped gene NDRG1 at both mRNA and protein levels in at least two breast cancer cell lines, MCF-7 & SKBR3 (Figure 4). According to previous findings, expression levels of several lncRNAs were mainly correlated with those of their nearest genes, resulting in either a positive [27] or negative effect [26]. Although our findings indicated that NDRG1-OT1_v4 had a negative effect on NDRG1, NDRG1-OT1_v4 does not seem to play a major role. Previous studies have demonstrated that NDRG1 expression under different oxygen concentrations was regulated by both transcriptional [14, 40] and epigenetic factors [17]. Therefore, NDRG1-OT1_v4 is likely one of several regulatory mechanisms that fine tunes the expression of NDRG1 in response to changes in oxygen concentrations.
In addition, mRNA and protein levels of NDRG1 were both decreased by overexpressing NDRG1-OT1_v4. Regarding mRNA stability, upon treatment with the transcriptional inhibitor actinomycin D, we found that NDRG1-OT1_v4 did not affect NDRG1 mRNA stability (Figure 5A & 5B). Unlike other lncRNA, such as TINCR, it has been found to regulate mRNA stability [28]. Therefore, we expected that NDRG1-OT1_v4 might inhibit the transcription of NDRG1. Deletion analysis of lncRNA followed by luciferase reporter assays or dot-blot assays [41] could be used to identify the pivotal region of lncRNA regulating its target genes.
On the other hand, when MCF-7 cells were treated with the protein synthesis inhibitor cycloheximide, NDRG1-OT1_v4 promoted NDRG1 degradation via ubiquitin-mediated proteolysis (Figure 5C–5J). Although previous studies have indicated that lncRNAs can promote protein stability by blocking protein from interacting with ubiquitin [19, 23, 32], we observed an opposite effect of lncRNA on ubiquitin-mediated proteolysis. Namely, we first reported that NDRG1-OT1_v4 destabilized NDRG1 by promoting ubiquitination (Figure 5C–5J).
There were some limitations in this study. First, in order to investigate NDRG1-OT1_v4-regulated genes, using both overexpression and silencing of NDRG1-OT1_v4 would be optimal to reduce the false positives. However, when we tried to knock down NDRG1-OT1_v4 under hypoxia by transducing several shRNAs against NDRG1-OT1_v4, not only was the NDRG1-OT1_v4 down-regulated but also its downstream gene NDRG1. Because of this off-target effect, we only conducted the experiments on ectopically expressed NDRG1-OT1_v4. Second, to examine whether this novel regulatory mechanism of NDRG1-OT1_v4 exists in other cancer types, similar experiments should be performed in different cancer cell lines and clinical samples.
In conclusion, we identified a group of oxygen-responsive lncRNAs in breast cancer cells and a novel regulatory mechanism of NDRG1-OT1_v4 by enhancing the degradation of its down-stream target NDRG1 protein.
MATERIALS AND METHODS
Cell culture and treatments
Breast cancer cell lines, MCF-7, SKBR3, and MDAMB-231, were maintained in Dulbecco’s modified Eagle’s medium (DMEM) (GIBCO, Carlsbad, USA), which was supplemented with 10% fetal bovine serum (FBS) (GIBCO) and 1% penicillin-streptomycin-amphotericin solution (Biological Industries, Beit-Haemek, Israel). Breast cancer cell line ZR75-30 was maintained in Roswell Park Memorial Institute (RPMI). Breast cancer cell lines, MDAMB-361 and MDAMB-453, were cultured in Leibovitz’s L-15 (L15) culture medium (GIBCO) with 20% FBS and 1% antibiotics. Normal cell line MCF-10A were maintained in DMEM and Ham’s Nutrient Mixture F12 (F12) mixed buffer (GIBCO, Carlsbad, CA, USA) with 5% horse serum, 20 ng epidermal growth factor, 0.5 mg hydrocortisone, 100 ng cholera toxin, 10 μg insulin, and 1% penicillin-streptomycin-amphotericin solution (Biological Industries, Beit-Haemek, Israel).
Except MDAMB-361 and MDAMB-453 growing in a humidified atmosphere without CO2, other cells were incubated at 37°C in a humidified atmosphere with 5% CO2, or in an In VivO 2-200 hypoxia chamber (Ruskinn Technology, Leeds, UK) filled with a gas mixture of 0.5% O2, 5% CO2 and 94.5% N2, for 24 h. For the drug treatment experiment, MCF-7 cells were mixed with 10 μg/mL cycloheximide (Merck, Darmstadt, Germany) or 10 μg/mL actinomycin D (Sigma, St. Louis, USA).
Next-generation sequencing and analysis of oxygen-responsive lncRNA
Total RNA extracted from MCF-7 was digested to 180 bp fragments after removing rRNAs with a Ribo-Zero Gold kit (Illumina, San Diego, USA). The RNA fragments were reverse-transcribed to cDNA using a TruSeq Stranded total RNA kit (Illumina), and were ligated to specific adapters at both ends of these cDNA fragments to produce a sequencing library. Next, the sequencing libraries were hybridized with adapter’s oligonucleotide sequence on the surface of flow cells (Illumina). Each bound fragment was amplified into a clonal cluster through bridge amplification. All of the clusters on the flow cell were finally sequenced by HiScan SQ (Illumina).
The FastQC program (http://www.bioinformatics.babraham.ac.uk/projects/fastqc/) was used to examine the quality control of sequencing reads, and TopHat 2 (https://ccb.jhu.edu/software/tophat/indshex.tml) was used to align sequencing reads to human genome references (GRCh37/hg19). Then, these mapped reads were matched to lncRNAs from the Lncipedia database (http://www.lnciedia.org/) and were normalized to Fragments Per Kilobase of transcript per Million mapped reads (FPKM) as the expression level of a given lncRNA using Cufflink (http://cole-trapnell-lab.github.io/cufflinks/). Finally, Cuffdiff (http://cole-trapnell-lab.github.io/cufflinks/cuffdiff/) was utilized to compare the different FPKMs for each condition. All of the data have been deposited in Gene Expression Omnibus (GEO, GSE84167).
Plasmid DNA construction and transfection
The pUC57 plasmid containing NDRG1-OT1_v4 was purchased from GenScript (GenScript, Piscataway, USA), digested by BamH1 (BioLabs, New England, UK) and EcoR1 (BioLabs), and inserted into the pcDNA3.1+ plasmid (Thermo Fisher Scientific Taiwan). MCF-7 cells were transfected with pcDNA3.1+-NDRG1-OT1_v4 or empty vector using jetPRIME transfection reagent (Polyplus-transfection, New York, USA) according to the manufacturer’s instructions. After 4 h, the transfection medium was replaced with fresh medium-containing serum. After 24 h, cells were checked for RNA expression by quantitative RT-PCR.
RNA extraction and quantitative RT-PCR
Total RNA was extracted by TRIpure reagent (Roche Diagnostics, Branchburg, USA) according to the manufacturer’s protocol. One μg of total RNA was reverse-transcribed to cDNA using a High-Capacity cDNA Reverse Transcription Kit (Applied Biosystems, Carlsbad, USA). Ten percent of each cDNA was used as the template for quantitative real-time PCR with FastStart Universal SYBR Green Master reaction mixture (Roche) and custom primers (Table 3). Finally, the reaction was carried out on an ABI Step One plus system (Applied Biosystems). Each reaction was done in triplicate, and data were normalized to loading control 18s rRNA.
Table 3: The primers for quantitative RT-PCR
Gene/lncRNA |
Sequence (5’ to 3’) |
|---|---|
NDRG1-OT1_v4 |
(F) CTCCCAGGTTCCTGTACTACTG |
NDRG1 |
(F) GGCAACCTGCACCTGTTCATCAAT |
18s rRNA |
(F) TCAACTTTCGATGGTAGTCGCCGT |
F, forward; R, reverse.
Human genome microarray analysis
The total RNA was primed with T7 Oligo(dT) and amplified by an Illumina TotalPre RNA Amplification Kit (Ambion, Austin, USA) to synthesize the cDNA containing a T7 promoter sequence. Following the first strand of cDNA synthesis, the second strand of cDNA was synthesized by converting the single-stranded cDNA into a double-stranded DNA (dsDNA) template for transcription. The reaction employed DNA polymerase and RNAase H to simultaneously degrade the RNA and synthesize the second strand of cDNA. After cleanup, in vitro transcription was conducted using the double-stranded cDNA as a template and T7 RNA polymerase to synthesize multiple copies of biotinylated complementary RNA (cRNA). After amplification, the cRNA was mixed with an equal volume of hybridization buffer and hybridized to Illumina Human HT-12 v4 BeadChips (Illumina) at 58°C for 16 h. After hybridization, the BeadChip was washed and stained with streptavidin-Cy3 dye. The intensity of the beads’ fluorescence was detected by HiScan SQ (Illumina), and the results were analyzed using BeadStudio software.
After scanning, the intensity data of Illumina Human HT-12 v4 BeadChips were analyzed using Partek software (Partek, St. Charles, USA) for mRNA analysis. Background-adjusted signals were normalized by a quantile normalization algorithm. All data have been uploaded to GEO (GSE72881). Furthermore, Ingenuity Pathway Analysis (Ingenuity Systems Inc. Redwood City, USA) was applied to comprehend the biological functions and signaling pathways of differentially expressed genes.
Protein extraction and western blotting
MCF-7 cells were lysed in RIPA lysis buffer (Sigma), and protein concentration was determined using Bio-Rad Protein assay reagent (Bio-Rad Laboratories, Hercules, USA). Then, the protein lysate was separated by 10% SDS-PAGE and transferred to a PVDF membrane (Bio-Rad Laboratories). The membranes were blocked by TBST Blocking buffer (Arrowtec, Taiwan) for 10 min and hybridized to a primary antibody consisting of NDRG1 (Abcam Inc., Cambridge, USA) and ubiquitin (Abcam). After immunoblotting, the membranes were washed by TBS (Omics Bio, Taiwan) with Tween20 and reacted with horseradish peroxidase-conjugated goat anti-rabbit IgG or rabbit anti-mouse IgG (GeneTex, Irvine, USA). The protein bands were visualized using an enhanced chemiluminescence system (Millipore, Billerica, USA).
Co-immunoprecipitation
The immunoprecipitation antibodies, 5 μg NDRG1 Ab (Abcam) and 5 μg normal mouse IgG (Millipore), were reacted with 50 μL G beads (Life Technology, Gaithersburg, USA) in 200 μL Ab binding & washing buffer (Life Technology), followed by overnight shaking at 4°C. MCF-7 cells were harvested and lysed in RIPA buffer (Sigma) after reacting with 20 μM MG132 (Abmol, Houston, USA) for 4 h. Then, protein concentration was determined using Bio-Rad Protein assay reagent (Bio-Rad Laboratories). One thousand μg of protein lysate were reacted with Ab-G beads during overnight shaking at 4°C. After immunoprecipitation, protein-Ab-G bead complexes were separated and washed with washing buffer (Life Technology). Finally, protein-Ab-G bead complexes were boiled for 10 min, and western blotting was performed.
Statistical analysis
All data are reported as means ± SDs for at least 3 independent experiments. The difference between each group was analyzed using Student’s t test. P <0.05 was considered significant, if no other α value was specified.
Author contributions
LCL conceived and designed the experiments. HCL, JCY, and LYC performed the experiments. HCL, HHC, and LCL analyzed the data. MHT, EYC, and LCL contributed reagents, materials, and/or analysis tools. HCL and LCL wrote the paper. All authors reviewed the manuscript.
ACKNOWLEDGMENTS AND GRANT SUPPORT
This research was supported by a grant from the Ministry of Science and Technology (Grant No. MOST 103-2320-B-002-065-MY3). We thank Melissa Stauffer for editorial assistance.
CONFLICTS OF INTEREST
The authors declare that they have no competing financial interests.
REFERENCES
1. Masson N, Ratcliffe PJ. Hypoxia signaling pathways in cancer metabolism: the importance of co-selecting interconnected physiological pathways. Cancer Metab. 2014; 2:3.
2. Gulledge CJ, Dewhirst MW. Tumor oxygenation: a matter of supply and demand. Anticancer Res. 1996; 16:741-749.
3. Curran CS, Keely PJ. Breast tumor and stromal cell responses to TGF-beta and hypoxia in matrix deposition. Matrix Biol. 2013; 32:95-105.
4. Wang F, Zhang H, Xu N, Huang N, Tian C, Ye A, Hu G, He J, Zhang Y. A novel hypoxia-induced miR-147a regulates cell proliferation through a positive feedback loop of stabilizing HIF-1alpha. Cancer Biol Ther. 2016; 7:1-9.
5. Bae KM, Dai Y, Vieweg J, Siemann DW. Hypoxia regulates SOX2 expression to promote prostate cancer cell invasion and sphere formation. Am J Cancer Res. 2016; 6:1078-1088.
6. Knowles HJ, Harris AL. Hypoxia and oxidative stress in breast cancer. Hypoxia and tumourigenesis. Breast Cancer Res. 2001; 3:318-322.
7. da Motta LL, Ledaki I, Purshouse K, Haider S, De Bastiani MA, Baban D, Morotti M, Steers G, Wigfield S, Bridges E, Li JL, Knapp S, Ebner D, et al. The BET inhibitor JQ1 selectively impairs tumour response to hypoxia and downregulates CA9 and angiogenesis in triple negative breast cancer. Oncogene. 2016; 10:13.
8. Kurdistani SK, Arizti P, Reimer CL, Sugrue MM, Aaronson SA, Lee SW. Inhibition of tumor cell growth by RTP/rit42 and its responsiveness to p53 and DNA damage. Cancer Res. 1998; 58:4439-4444.
9. Salnikow K, Costa M, Figg WD, Blagosklonny MV. Hyperinducibility of hypoxia-responsive genes without p53/p21-dependent checkpoint in aggressive prostate cancer. Cancer Res. 2000; 60:5630-5634.
10. Salnikow K, Kluz T, Costa M, Piquemal D, Demidenko ZN, Xie K, Blagosklonny MV. The regulation of hypoxic genes by calcium involves c-Jun/AP-1, which cooperates with hypoxia-inducible factor 1 in response to hypoxia. Mol Cell Biol. 2002; 22:1734-1741.
11. Lee JC, Chung LC, Chen YJ, Feng TH, Juang HH. N-myc downstream-regulated gene 1 downregulates cell proliferation, invasiveness, and tumorigenesis in human oral squamous cell carcinoma. Cancer Lett. 2014; 355:242-252.
12. Chang X, Xu X, Ma J, Xue X, Li Z, Deng P, Zhang S, Zhi Y, Chen J, Dai D. NDRG1 expression is related to the progression and prognosis of gastric cancer patients through modulating proliferation, invasion and cell cycle of gastric cancer cells. Mol Biol Rep. 2014; 41:6215-6223.
13. Wang Q, Li LH, Gao GD, Wang G, Qu L, Li JG, Wang CM. HIF-1alpha up-regulates NDRG1 expression through binding to NDRG1 promoter, leading to proliferation of lung cancer A549 cells. Mol Biol Rep. 2013; 40:3723-3729.
14. Li EY, Huang WY, Chang YC, Tsai MH, Chuang EY, Kuok QY, Bai ST, Chao LY, Sher YP, Lai LC. Aryl hydrocarbon receptor activates NDRG1 transcription under hypoxia in breast cancer cells. Sci Rep. 2016; 6:20808.
15. Broggini T, Wustner M, Harms C, Stange L, Blaes J, Thome C, Harms U, Mueller S, Weiler M, Wick W, Vajkoczy P, Czabanka M. NDRG1 overexpressing gliomas are characterized by reduced tumor vascularization and resistance to antiangiogenic treatment. Cancer Lett. 2015; 20:9.
16. Li Q, Chen H. Transcriptional silencing of N-Myc downstream-regulated gene 1 (NDRG1) in metastatic colon cancer cell line SW620. Clin Exp Metastasis. 2011; 28:127-135.
17. Luo EC, Chang YC, Sher YP, Huang WY, Chuang LL, Chiu YC, Tsai MH, Chuang EY, Lai LC. MicroRNA-769-3p down-regulates NDRG1 and enhances apoptosis in MCF-7 cells during reoxygenation. Sci Rep. 2014; 4:5908.
18. Luo F, Sun B, Li H, Xu Y, Liu Y, Liu X, Lu L, Li J, Wang Q, Wei S, Shi L, Lu X, Liu Q, Zhang A. A MALAT1/HIF-2alpha feedback loop contributes to arsenite carcinogenesis. Oncotarget. 2016; 7:5769-5787. https://doi.org/10.18632/oncotarget.6806.
19. Zhang A, Zhao JC, Kim J, Fong KW, Yang YA, Chakravarti D, Mo YY, Yu J. LncRNA HOTAIR Enhances the androgen-receptor-mediated transcriptional program and drives castration-resistant prostate cancer. Cell Rep. 2015; 13:209-221.
20. Bhan A, Mandal SS. Estradiol-induced transcriptional regulation of long non-coding RNA, HOTAIR. Methods Mol Biol. 2016; 1366:395-412.
21. Feldstein O, Nizri T, Doniger T, Jacob J, Rechavi G, Ginsberg D. The long non-coding RNA ERIC is regulated by E2F and modulates the cellular response to DNA damage. Mol Cancer. 2013; 12:131.
22. Zhou Z, Liu H, Wang C, Lu Q, Huang Q, Zheng C, Lei Y. Long non-coding RNAs as novel expression signatures modulate DNA damage and repair in cadmium toxicology. Sci Rep. 2015; 5:15293.
23. Yang F, Zhang H, Mei Y, Wu M. Reciprocal regulation of HIF-1alpha and lincRNA-p21 modulates the Warburg effect. Mol Cell. 2014; 53:88-100.
24. Xue M, Li X, Li Z, Chen W. Urothelial carcinoma associated 1 is a hypoxia-inducible factor-1alpha-targeted long noncoding RNA that enhances hypoxic bladder cancer cell proliferation, migration, and invasion. Tumour Biol. 2014; 35:6901-6912.
25. Voellenkle C, Garcia-Manteiga JM, Pedrotti S, Perfetti A, De Toma I, Da Silva D, Maimone B, Greco S, Fasanaro P, Creo P, Zaccagnini G, Gaetano C, Martelli F. Implication of Long noncoding RNAs in the endothelial cell response to hypoxia revealed by RNA-sequencing. Sci Rep. 2016; 6:24141.
26. Takayama K, Horie-Inoue K, Katayama S, Suzuki T, Tsutsumi S, Ikeda K, Urano T, Fujimura T, Takagi K, Takahashi S, Homma Y, Ouchi Y, Aburatani H, et al. Androgen-responsive long noncoding RNA CTBP1-AS promotes prostate cancer. EMBO J. 2013; 32:1665-1680.
27. Wang Y, Liu X, Zhang H, Sun L, Zhou Y, Jin H, Zhang H, Zhang H, Liu J, Guo H, Nie Y, Wu K, Fan D, et al. Hypoxia-inducible lncRNA-AK058003 promotes gastric cancer metastasis by targeting gamma-synuclein. Neoplasia. 2014; 16:1094-1106.
28. Xu TP, Liu XX, Xia R, Yin L, Kong R, Chen WM, Huang MD, Shu YQ. SP1-induced upregulation of the long noncoding RNA TINCR regulates cell proliferation and apoptosis by affecting KLF2 mRNA stability in gastric cancer. Oncogene. 2015; 34:5648-5661.
29. Zhang Z, Zhu Z, Watabe K, Zhang X, Bai C, Xu M, Wu F, Mo YY. Negative regulation of lncRNA GAS5 by miR-21. Cell Death Differ. 2013; 20:1558-1568.
30. Cao C, Sun J, Zhang D, Guo X, Xie L, Li X, Wu D, Liu L. The long intergenic noncoding RNA UFC1, a target of MicroRNA 34a, interacts with the mRNA stabilizing protein HuR to increase levels of beta-catenin in HCC cells. Gastroenterology. 2015; 148:415-426.e418.
31. Huang J, Zhou N, Watabe K, Lu Z, Wu F, Xu M, Mo YY. Long non-coding RNA UCA1 promotes breast tumor growth by suppression of p27 (Kip1). Cell Death Dis. 2014; 5:e1008.
32. Yang F, Huo XS, Yuan SX, Zhang L, Zhou WP, Wang F, Sun SH. Repression of the long noncoding RNA-LET by histone deacetylase 3 contributes to hypoxia-mediated metastasis. Mol Cell. 2013; 49:1083-1096.
33. Michalik KM, You X, Manavski Y, Doddaballapur A, Zornig M, Braun T, John D, Ponomareva Y, Chen W, Uchida S, Boon RA, Dimmeler S. Long noncoding RNA MALAT1 regulates endothelial cell function and vessel growth. Circ Res. 2014; 114:1389-1397.
34. Lai LC, Su YY, Chen KC, Tsai MH, Sher YP, Lu TP, Lee CY, Chuang EY. Down-regulation of NDRG1 promotes migration of cancer cells during reoxygenation. PLoS One. 2011; 6:e24375.
35. Beckedorff FC, Ayupe AC, Crocci-Souza R, Amaral MS, Nakaya HI, Soltys DT, Menck CF, Reis EM, Verjovski-Almeida S. The intronic long noncoding RNA ANRASSF1 recruits PRC2 to the RASSF1A promoter, reducing the expression of RASSF1A and increasing cell proliferation. PLoS Genet. 2013; 9:e1003705.
36. Ogino T, Onishi H, Suzuki H, Morisaki T, Tanaka M, Katano M. Inclusive estimation of complex antigen presentation functions of monocyte-derived dendritic cells differentiated under normoxia and hypoxia conditions. Cancer Immunol Immunother. 2012; 61:409-424.
37. Yoon G, Oh CS, Kim HS. Distinctive expression patterns of hypoxia-inducible factor-1alpha and endothelial nitric oxide synthase following hypergravity exposure. Oncotarget. 2016; 7:33675-33688. https://doi.org/10.18632/oncotarget.9372.
38. Chowdhury AR, Long A, Fuchs SY, Rustgi A, Avadhani NG. Mitochondrial stress-induced p53 attenuates HIF-1alpha activity by physical association and enhanced ubiquitination. Oncogene. 2016; 27:13.
39. Verratti V, Di Giulio C, D’Angeli A, Tafuri A, Francavilla S, Pelliccione F. Sperm forward motility is negatively affected by short-term exposure to altitude hypoxia. Andrologia. 2016; 24:7.
40. Cangul H. Hypoxia upregulates the expression of the NDRG1 gene leading to its overexpression in various human cancers. BMC Genet. 2004; 5:27.
41. Lin A, Li C, Xing Z, Hu Q, Liang K, Han L, Wang C, Hawke DH, Wang S, Zhang Y. The LINK-A lncRNA activates normoxic HIF1 [alpha] signalling in triple-negative breast cancer. Nat Cell Biol. 2016; 18:213-224.