
INTRODUCTION
Drug repurposing circumvents the high costs and extended timeframes associated with drug discovery. It is a cost-effective approach to identifying and prioritizing novel therapeutic combinations for low prevalence yet highly lethal diseases such as epithelial ovarian cancer (EOC), the deadliest of the gynecological diseases. EOC is diagnosed in 225,000 women worldwide and results in more than 140,000 deaths annually [1]. Though primary tumors typically respond to frontline treatment, peritoneal dissemination of malignant cells resistant to taxanes and/or platinum-based compounds eventually result in recurrent disease. There are no common causative somatic gene mutations, outside of TP53 alterations in serous adenocarcinoma and KRAS, BRAF and PTEN in mucinous, endometrioid, and low grade serous cancers, suggested to be associated with the pathogenesis of EOC [2]. Since there is not a dominant pathway to exploit across these genetically complex tumors, generalized EOC-specific targeted therapy has proven elusive and for the most part futile. Precision cancer medicine directed at distinct tumor vulnerabilities is imperative to make the vertical advancement in treatment in order to improve quality and duration of life for EOC patients. Consequently, there is a critical need to screen EOC tumors for specific genetic signatures to determine the most effective combinatorial treatment options on a case-by-case basis. Until then, chemotherapy resistance and drug toxicity will continue to hinder improvements in overall survival of patients with EOC.
Clinically relevant genetic signatures should both stratify patients into prognostic subtypes and predict chemotherapeutic response [3]. Relying solely on clinicopathologic markers to guide treatment decisions has proven ineffective mainly due to lack of knowledge of the inherent molecular vulnerabilities within individual tumors. The development of early prediction models initially utilized microarray technology to discern small gene sets predictive of treatment response [4–7]. However, as sequencing and gene silencing technologies continue to become commonplace, a more exact analysis of tumor biology is possible [8–10]. If solid tumors are truly heterogeneous diseases with assorted molecular features, hybrid signatures that take into account a combination of clinical and genetic characteristics allow oncologists the most informed criteria possible regarding therapeutic choices and risk of recurrence. The introduction of online publication compendiums and queryable databases offer a vast resource of data mining at little to no cost of access [11–14], this enables bioinformatical inquiry to become an integral component of modern research projects. Meta-analyses of multiple data sets, inconceivable before the advent of Internet technology, allows a global perspective on genetic relationships across a spectrum of tumor types [15–17]. The molecular assay PAM50 (and the clinical equivalent Prosigna®) run on the NanoString nCounter®-platform is an example of an integrated breast cancer-subtyping platform developed for use in local laboratories [18, 19]. The Cancer Genome Atlas (TCGA) supplies both mutational and clinical data for a 33 tumor types, including ovarian serous adenocarcinoma [2], allowing researchers to identify molecular subtypes with survival correlations for EOC patients [20, 21]. Therefore, novel computational approaches identifying clinically relevant predictive signatures have the potential to advance EOC therapy in ways not conceivable through traditional basic science approaches [22, 23].
Auranofin (Ridaura®) is a gold complex originally approved as an antirheumatic agent that has emerged as a potential candidate for multiple repurposed therapies including neurodegenerative diseases, HIV/AIDS and microbial infections [24, 25]. Auranofin has an acceptable safety profile and has recently completed a Phase 2 study for treatment of chronic lymphocytic leukemia [26, 27]. Even though its specific anti-inflammatory mechanisms are not fully understood, auranofin also demonstrates several anticancer properties. Its most well studied mechanism of action is inhibition of thioredoxin reductase (TrxR) enzyme with subsequent induction of reactive oxygen species (ROS) [28, 29]. It has also been shown to mimic proteasomal inhibition by acting upon proteasome-associated deubiquitinases (DUBs) [30]. Other areas of research for the anti-growth activity of this heavy metal compound focus on inhibition of the STAT3 and NFκB pathways [31, 32]. When directed against EOC cell lines, additional mechanisms of action have been demonstrated. It was shown to be more potent than cisplatin in decreasing cell viability, especially in cells conditioned for cisplatin-resistance [33]. In addition, studies in ovarian cancer models have implicated auranofin as a potent activator of the FOXO3 tumor suppressor [34], as well as a selective inhibitor of oncogenic protein kinase C iota (PKCι) signaling [35]. The latter studies include a clinical trial evaluating the benefits of oral dosing of auranofin alongside CA-125 monitoring in asymptomatic ovarian cancer patients [36]. Auranofin has also been shown to be more effective in BRCA1-defective ovarian cells due to accumulations in unrepaired DNA damage [37]; however, this observation has not been confirmed clinically. Importantly, substantial evidence has demonstrated the synergistic enhancement of auranofin effects when used in combination with other compounds [28, 38–42].
The HSP90 chaperone protein utilizes an ATP-dependent mechanism to orchestrate various cellular functions, including the protection and activation of oncogenic client proteins [43]. Due to exploitation of its housekeeping functions by malignant cells, therapeutics directed at disabling HSP90 activity is a current area of drug discovery. Though early natural products induced severe toxicities, current synthetic analogs display acceptable safety profiles and are being investigated in the treatment of a broad spectrum of neoplasms [43]. Among these next-generation compounds are AUY922 (Vernalis) and ganetespib, both of which are resorcinol class compounds that inhibit the ATP-binding domain of HSP90 [44–46], though few investigations have evaluated their impact on ovarian tumor biology. One such study was a meta-analysis of siRNA screens indicating that degradation of HSP90 client proteins has the potential to sensitize EOC cell lines to additional targeted therapies. Moreover, exposure to ganetespib sensitized orthotopic ovarian xenografts to treatment with paclitaxel [47]. Although not currently being investigated in the treatment of EOC, studies have also demonstrated AUY922 efficacy in EOC models [48, 49].
As indicated, current methods of clinical intervention for EOC patients are dismal. Although the introduction of platinum and taxane-based therapy led to substantial improvements in patient survival, very little progress has occurred over the last few decades. In order to repurpose available FDA-cleared compounds based on pharmacogenomic profiles, we attempted to classify a phenotypic response to the combinatorial effects of auranofin and AUY922 through the use of transcriptional expression data. We selectively performed twelve different two-drug combination treatments in ten EOC cell lines and utilized RNA sequencing data to group expression signatures according to drug sensitivity or resistance. We show that combinations of auranofin (ROS inducer) and AUY922 (HSP90 antagonist) are highly potent towards a subset of EOC cells while others show inherent resistance. We have demonstrated that these lines exhibit dissimilar disruption of ROS homeostasis after auranofin treatment, while AUY922 activity displays potency across all lines. The in silico analyses identified two 23-gene panels correlated with either resistance or sensitivity to this combination and interrogation of these gene sets in the TCGA data set demonstrate a proclivity of tumors expressing genes related to the resistant panel more so than the sensitive panel. The goal of this project is to provide evidence for pre-treatment transcriptional profiling of clinical tumors in order to predict efficacy of novel drug combinations, as well as identify genetic markers involved in chemotherapeutic response by integrating high-throughput screening and in silico exploration.
RESULTS
Viability studies of FDA-approved drugs in EOC cell lines
Utilizing a robotic screening assay in a 384-well format, we exposed ten EOC cell lines to twelve different two-drug combination treatments using FDA-approved drugs not currently in use as EOC therapies (Supplementary Table 1). Although many of the single agent and drug combinations showed robust inhibition of cell viability across all lines, we were interested in drug combinations that demonstrate disparate phenotypes across EOC cell lines. After analyzing the preliminary data, we chose to further investigate the combinatorial effects of auranofin (a reported ROS inducer) paired with either AUY922 or ganetespib (HSP90 inhibitors). This mechanistic combination was chosen due to the diverse effects we saw on viability among the panel of EOC lines, where some lines showed sensitivity to the combination (A1847, A2780, OVCAR8) while others displayed resistance (OVCAR4, PEO4, SKOV3) (Supplementary Figure 1A & 1B). In order to validate these results in a 96-well format, we first performed single agent viability screens using the three compounds to determine dose response curves of each cell line (Supplementary Figure 1C-1E). Initial investigations revealed that the two HSP90 inhibitors exhibited similar activities across the cell lines; therefore, we focused our efforts on a single combination of auranofin and AUY922. We then confirmed the preliminary high-throughput viability results to this drug combination in the two groups of EOC cell lines using a checkerboard design (Figure 1A & Supplementary Figure 2A). In further experiments, we utilized A1847 and PEO4 as representative cell lines for the sensitive and resistant groups, respectively.
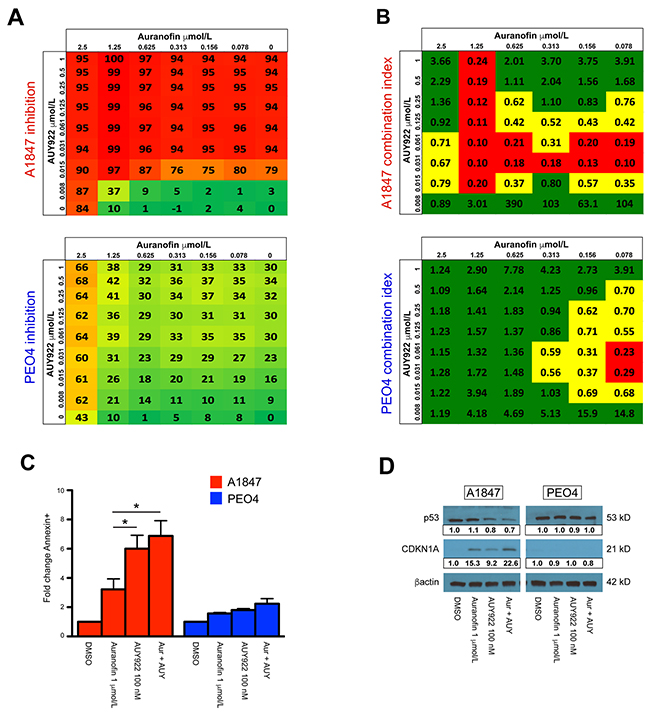
Figure 1: Combination analysis for auranofin and AUY922 in sensitive A1847 and resistant PEO4 cell lines. (A) Color scale for percentage of viability inhibition is shown across 48 different drug combinations of auranofin and AUY922 for A1847 (upper) and PEO4 (lower) cell lines. (B) Dose response data was used to calculate the Combination Index (CI) values for auranofin and AUY922 combination treatment for A1847 (upper) and PEO4 (lower). Shown is the average calculated CI value ± standard error of the mean. CI value of >0.8 [green] indicates no synergy; CI = 0.3-0.8 [yellow] indicates synergistic effects; CI value of <0.3 [red] indicates strong synergistic effects. (C) Fold-change of A1847 and PEO4 cells positive for Annexin V staining 48 hours after incubation with indicated compounds, both alone and in combination (Aur + AUY). Data were quantified for fold-changes relative to vehicle treated cells and are presented as bar graphs showing average fold-change ± standard error of the mean, * = p < 0.05. (D) Protein expression of TP53 and CDKN1A 24 hours after incubation with indicated compounds, both alone and in combination (Aur + AUY). β-actin was used as a loading control and densitometric analysis of western blot data was performed using ImageJ software.
To distinguish synergistic from additive effects of auranofin and AUY922, a combination index (CI) was calculated for each of the sensitive and resistant cell lines (Figure 1B & Supplementary Figure 2B). The CI model, originally developed by Chou et al. [50], is commonly used to assess drug interactions. Of the 48 total concentrations, auranofin and AUY922 are synergistic (<0.8 CI score) at 56% of the concentrations against A1847 cells compared to 27% for PEO4 cells. Moreover, this drug combination is highly synergistic (<0.3 CI score) for 29% of drug concentrations against A1847 cells versus only 4% for the PEO4 line (Figure 1B).
Induction of apoptosis is increased in sensitive cells
Due to the synergistic effects seen in the sensitive EOC cell lines, we investigated if cellular viability was mediated through an apoptotic mechanism. To examine auranofin and AUY922-induced apoptosis, we evaluated Annexin V staining 48 hours after single agent and combinatorial treatment at the indicated concentrations (Figure 1C & Supplementary Figure 3A). After treatment, the fraction of Annexin V positive A1847 cells increased by an average of 3.2-fold in the auranofin group, 6.0-fold in the AUY922 group and 6.9-fold in the combination group relative to the vehicle group. Alternatively, in the resistant PEO4 cells the average induction of Annexin V staining was 1.6-fold in the auranofin group, 1.8-fold in the AUY922 and only 2.2-fold in the combination group relative to the vehicle group. We also evaluated p53 and CDKN1A protein levels after drug treatment (Figure 1D & Supplementary Figure 3B). Western blot analysis demonstrated strong p53 expression in A1847, A2780, OVCAR4 and PEO4 cells, yet undetectable in both OVCAR8 and SKOV3. Treatment of cells with auranofin for 24 hours did not alter p53 expression in any of the tested cell lines, though exposure to AUY922 alone or in combination with auranofin decreased expression of p53 in the sensitive A1847 and resistant OVCAR4 lines. A downstream effector of p53, the cyclin dependent kinase inhibitor CDKN1A, was increased in the sensitive A1847 after incubation with both auranofin and AUY922, as well as after combinatorial treatment of the two compounds. The resistant PEO4 line failed to demonstrate a marked increase in CDKN1A after any type of treatment, corroborating the decreased Annexin V staining seen post-treatment. Increased CDKN1A expression was also seen after single agent and combinatorial treatment in sensitive A2780 and resistant OVCAR4 cell lines, undetectable in OVCAR8 regardless of treatment and only increased after exposure to auranofin in SKOV3 cells (Supplementary Figure 3B).
Auranofin-induced disruptions of reactive oxygen pathways
We compared the auranofin IC50 dose response curves of our sensitive and resistant cell lines using a Student’s t-test and revealed a statistically significant difference between groups (Figure 2A). We next performed Western blot analyses of these cultures after incubation with the indicated concentrations (Figure 2B & Supplementary Figure 4A). The NRF2/KEAP1 pathway is a key regulator of cellular responses to oxidative stress in several ovarian cancer models [51, 52], and has been shown to be influenced by auranofin treatment [28, 53, 54]. We hypothesized that the effects of auranofin on ROS disruption are mediated, in part, through these proteins. We demonstrate that the sensitive A1847 cell line has strong basal expression of NRF2 while all other cell lines have diminished basal levels. Upon incubation with auranofin, either as a single agent or in combination with AUY922, the expression of NRF2 increased in all cell lines tested, indicating a common mechanism of action of auranofin. Conversely, protein expression of KEAP1 was similar between all cell lines at the basal level, though differences in KEAP1 inhibition were seen upon treatment with auranofin and/or AUY922 (Figure 2B & Supplementary Figure 4A). We also wanted to investigate the pan-ubiquitination status of proteins after incubation with auranofin due to its previous implication as an inhibitor of proteasome-associated deubiquitinases (DUBs) [30]. Our results showed that, although treatment with auranofin either alone or in combination with AUY922 increased total ubiquinated proteins across all lines tested, this phenomenon was markedly higher in the sensitive group, suggesting a role of DUB inhibition in the increased apoptotic effects of auranofin (Figure 2B & Supplementary Figure 4A).
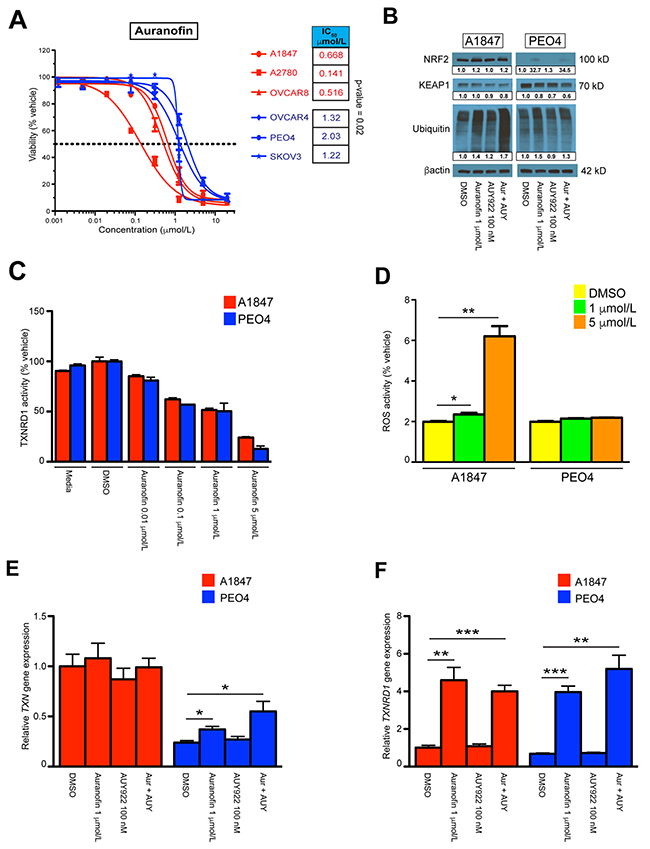
Figure 2: Single agent and combinatorial effects on reactive oxygen species homeostasis. (A) IC50 values of auranofin treatment across A1847, A2780, OVCAR8 [sensitive] and OVCAR4, PEO4, SKOV3 [resistant] cell lines. The points represent average viability ± standard error of mean following 72 hours of drug treatment at the indicated concentrations. Curve-fit lines were generated using non-linear regression analysis in GraphPad Prism. (B) Protein expression of NRF2, KEAP1 and pan-ubiquitin 24 hours after incubation with indicated compounds, both alone and in combination (Aur + AUY). β-actin was used as a loading control and densitometric analysis of western blot data was performed using ImageJ software with band quantification relative to DMSO-treated samples. (C) Inhibition of TXNRD1 activity was measured by NADPH-dependent reduction of DTNB in A1847 and PEO4 cell lines 6 hours after incubation with the indicated compounds. (D) Measurement of total ROS levels was measured using DCF fluorescence in A1847 and PEO4 cell lines 6 hours after incubation with the indicated compounds. (E, F) Transcriptional expression of TXN and TXRND1 in A1847 and PEO4 cell lines 6 hours after incubation with the indicated compounds, both alone and in combination (Aur + AUY). Data were quantified for the indicated fold-changes relative to vehicle treated cells and are presented as bar graphs showing the average fold-change ± standard error of the mean. * = p < 0.05, ** = p < 0.01, *** = p < 0.001.
Gold compounds such as auranofin have been shown to induce cell death through the deregulation of the thioredoxin reductase/thioredoxin (TXNRD1/TXN) redox system [55]. We therefore investigated the activity of our preferred drug combination on this system in EOC cell lines. TXNRD1 functions as a critical enzyme to maintain homeostasis of a reduced cellular milieu. Inhibition of TXNRD1 performance results in amplified levels of oxidized thioredoxin that further impairs the cellular response to oxidative stress. To determine if auranofin was inhibiting the enzymatic function of TXNRD1, we monitored TXNRD1 activity after 6 hours of auranofin exposure (Figure 2C & Supplementary Figure 4B). Interestingly, auranofin inhibits TXNRD1 activity at doses above 0.1 μmol/L in all cell lines tested, irrespective of its effects on viability (Supplementary Figure 4C). This finding demonstrates strong support that a principle mechanism of this gold compound is direct action on the TXNRD1/TXN system. To further delineate the influence auranofin has on the cellular response to impaired oxidative stress mechanisms, we performed RT-qPCR on sensitive A1847 and resistant PEO4 cell lines to examine transcriptional changes after treatment with auranofin and AUY922 (Figure 2E & 2F). We observed significant increases in the production of both TXN and TXNRD1 transcripts in the resistant PEO4 line after 6 hours of auranofin as both a single agent and in combination, while the presence of AUY922 alone did not produce similar results. Both cell lines demonstrated significant increases in TXNRD1 transcript production due to auranofin treatment, possibly due to a cellular compensatory mechanism for inhibited activity at the enzymatic level. Similar results were seen at 24 hours post-treatment, although by this time point even the sensitive A1847 line was increasing TXN transcriptional production due to auranofin exposure (Supplementary Figure 4D & 4E). We also wanted to measure differences in total ROS levels in the cells after exposure to these compounds. Although total ROS levels did not strictly correspond to cellular viability results between all cell lines (Supplementary Figure 5A), we did observe and increase in total ROS levels in the sensitive A1847 cell line 6 hours after treatment using a high concentration of auranofin (Figure 2D). This may indicate a higher sensitivity to auranofin on ROS homeostasis in A1847 as compared to PEO4. Finally, we investigated the effects of auranofin and AUY922 on mitochondrial function by monitoring disruptions in mitochondrial membrane potential. Changes in membrane potential lead to decoupling of the respiratory chain and is a key component of the early stages of programmed cell death. JC-1 is a dye that permeabilizes the mitochondrial membrane depending on its depolarization. The ratio of JC-1 aggregates-to-monomers is determined by the red/green fluorescence of JC-1 and is used as a general readout of mitochondrial membrane potential. However, we saw no changes in mitochondrial health of any cell line using this assay after treatment with auranofin, suggesting that the actions of auranofin are independent of mitochondrial stability (Supplementary Figure 5B).
AUY922 mediated effects on sensitive and resistant cell models
Similar to auranofin, we compared the AUY922 IC50 dose response curves of our cell lines (Figure 3A). Again, a Student’s t-test of the respective IC50’s demonstrated a significant p-value of 0.03 between groups. We next performed Western blot analysis 24 hours after incubation with indicated concentrations (Figure 3B, Supplementary Figure 6A & 6B). One of the hallmarks for effective HSP90 inhibition is an increase in the protein expression of HSP70 while HSP90 protein levels are maintained, as well as degradation of HSP90 client proteins [48, 56]. We observed this phenomenon across all cell lines using AUY922 either alone or in combination with auranofin. Additional verification that AUY922 efficacy is robust in all lines is the collective decrease in both phosphorylated AKT (at Thr308 and Ser473) and total AKT protein levels. We also wanted to observe transcriptional changes in HSP90 subunits after incubation with these compounds, therefore we performed RT-qPCR on sensitive A1847 and resistant PEO4 cell lines 6 hours after exposure (Figure 3C & 3D). We demonstrate significant increases in both the HSP90AA1 and HSP90AB1 subunits with either single agents, although AUY922 and the combination produced higher fold-changes then auranofin alone. Similar results were also seen at 24 hours post-incubation (Supplementary Figure 6C & 6D).
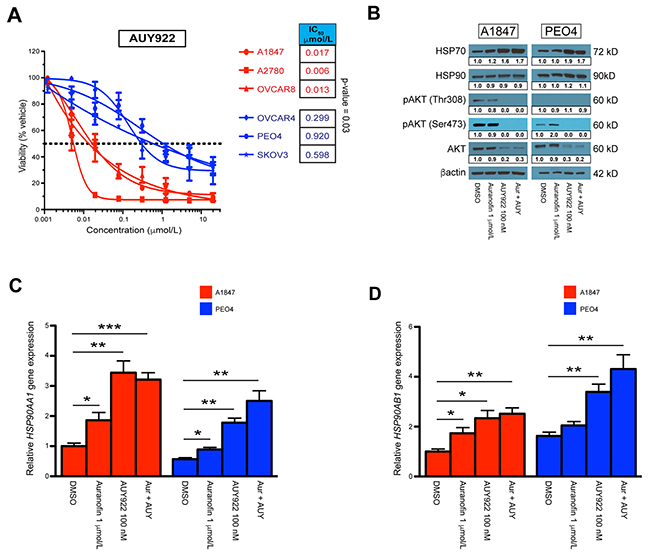
Figure 3: Single agent and combinatorial effects on the HSP90 pathway. (A) IC50 values of AUY922 treatment across A1847, A2780, OVCAR8 [sensitive] and OVCAR4, PEO4, SKOV3 [resistant] cell lines. The points represent average viability ± standard error of mean following 72 hours of drug treatment at the indicated concentrations. Curve-fit lines were generated using non-linear regression analysis in GraphPad Prism. (B) Protein expression of HSP70, HSP90, pAKT-Thr308, pAKT-Ser473 and AKT 24 hours after incubation with indicated compounds, both alone and in combination (Aur + AUY). β-actin was used as a loading control and densitometric analysis of western blot data was performed using ImageJ software. (C, D) Transcriptional expression of the HSP90AA1 and HSP90AB1 subunits in A1847 and PEO4 cell lines 6 hours after incubation with the indicated compounds, both alone and in combination (Aur + AUY). Data were quantified for the indicated fold-changes relative to vehicle treated cells and are presented as bar graphs showing the average fold-change ± standard error of the mean. * = p < 0.05, ** = p < 0.01, *** = p < 0.001.
Generation of predictive genetic signature
In order to evaluate the basal transcriptional activity of EOC cell lines that exhibit sensitivity versus resistance to the drug combination of auranofin and AUY922, RNA sequencing was performed to compare global expression profiles. We cultured the sensitive (A1847, A2780, OVCAR8) and resistant (OVCAR4, PEO4, SKOV3) lines, then extracted and purified total RNA. Paired end sequencing was performed and initial analyses were prepared using RSEM expected gene counts. The data were first filtered to remove non/low-expressed genes which resulted in a total of ~14,000 genes that were examined for differential expression. Next, normalization factors were calculated to scale the library sizes followed by estimation of the tag wise negative binomial dispersion values. An exact test for differences in gene wise mean expression values was then implemented and provided both log fold change (logFC) and false discovery rate (FDR) values. We discovered 283 differentially expressed genes (FDR cutoff of <0.05) between the “sensitive” and “resistant” subgroups which allowed us to finalize the list by using the top 23 genes expressed in the resistant and sensitive cell lines as determined by logFC and FDR (Tables 1 & 2). We also compiled expected counts of sequenced isoforms from each signature and determined the total average counts per cell line as well as group average for each RefSeq ID (Supplementary Tables 2 & 3). In addition, we queried our RNAseq data for lncRNA expression and compiled three transcripts, including HOTAIR, that were highly expressed in sensitive cell lines while six lncRNAs were upregulated in the resistant group (Supplementary Table 4).
Table 1: List of genes representing the resistant genetic signature.
Gene ID |
Gene name |
logFC |
FDR |
|---|---|---|---|
CDH6 |
cadherin 6, type 2, K-cadherin (fetal kidney) |
9.9 |
1.77E-19 |
IGFBP7 |
insulin-like growth factor binding protein 7 |
12.2 |
1.82E-15 |
MXRA5 |
matrix-remodelling associated 5 |
13.7 |
1.10E-12 |
ITGB6 |
integrin, beta 6 |
10.6 |
1.07E-11 |
WNT7A |
wingless-type MMTV integration site family, member 7A |
11.7 |
6.96E-11 |
TACSTD2 |
tumor-associated calcium signal transducer 2 |
9.4 |
3.31E-09 |
KRT19 |
keratin 19, type I |
9.3 |
3.78E-09 |
ESR1 |
estrogen receptor 1 |
13.0 |
6.46E-08 |
MUC16 |
mucin 16, cell surface associated |
11.6 |
1.23E-07 |
EHF |
ets homologous factor |
9.5 |
2.28E-07 |
S100A14 |
S100 calcium binding protein A14 |
9.2 |
1.48E-06 |
MAL2 |
mal, T-cell differentiation protein 2 |
8.5 |
2.04E-08 |
LAMA3 |
laminin, alpha 3 |
7.7 |
1.94E-06 |
ZBED2 |
zinc finger, BED-type containing 2 |
9.1 |
6.53E-06 |
LAD1 |
ladinin 1 |
9.2 |
3.12E-05 |
IRF6 |
interferon regulatory factor 6 |
9.9 |
3.12E-05 |
CFI |
complement factor I |
9.2 |
3.35E-05 |
CACNA2D3 |
calcium channel, voltage-dependent, alpha 2/delta subunit 3 |
10.1 |
1.09E-04 |
TSTD1 |
thiosulfate sulfurtransferase (rhodanese)-like domain containing 1 |
10.5 |
1.78E-04 |
COL5A1 |
collagen, type V, alpha 1 |
8.8 |
7.63E-05 |
MMP2 |
matrix metallopeptidase 2 |
8.2 |
8.56E-05 |
PDZK1IP1 |
PDZK1 interacting protein 1 |
8.6 |
1.77E-04 |
FAT2 |
FAT atypical cadherin 2 |
8.0 |
1.89E-04 |
RNA sequencing analyses was condensed to Gene ID, Gene name, logFC (log2-fold change) and FDR (Benjamini-Hochberg adjusted p-value to account for multiple comparisons). The panel of 23 genes that exhibit the highest logFC and FDR in the three resistant cell lines as compared to the three sensitive lines were selected as the resistant signature.
Table 2: List of genes representing the sensitive genetic signature.
Gene ID |
Gene name |
logFC |
FDR |
|---|---|---|---|
IGF2BP1 |
insulin like growth factor 2 mRNA binding protein 1 |
9.0 |
3.32E-06 |
ITPRIPL1 |
inositol 1,4,5-triphosphate receptor interacting protein-like 1 |
8.5 |
2.96E-05 |
ELFN1 |
extracellular leucine-rich repeat and fibronectin type III domain containing 1 |
9.7 |
3.12E-05 |
CCND2 |
cyclin D2 |
11.2 |
1.89E-04 |
PLAC8 |
placenta specific 8 |
6.0 |
3.71E-04 |
ARHGAP28 |
Rho GTPase activating protein 28 |
6.3 |
4.15E-04 |
SERPINF1 |
serpin peptidase inhibitor, clade F, member 1 |
7.9 |
8.03E-04 |
NOS3 |
nitric oxide synthase 3 |
5.1 |
1.49E-03 |
TBX2 |
T-box 2 |
7.4 |
1.68E-03 |
TEX15 |
testis expressed 15 |
7.7 |
2.00E-03 |
RASGRP2 |
RAS, guanyl releasing protein 2 |
7.4 |
2.24E-03 |
BAHCC1 |
BAH domain and coiled-coil containing 1 |
6.0 |
3.20E-03 |
APC2 |
adenomatosis polyposis coli 2 |
5.8 |
4.92E-03 |
COL13A1 |
collagen, Type XIII, Alpha 1 |
6.3 |
5.85E-03 |
FREM2 |
Fras1 related extracellular matrix protein 2 |
6.2 |
6.15E-03 |
AGAP2 |
ArfGAP with GTPase domain, ankyrin repeat and PH domain 2 |
6.7 |
6.37E-04 |
MME |
membrane metallo-endopeptidase |
5.6 |
9.19E-03 |
ESPNL |
espin-like |
6.1 |
9.31E-03 |
DDR2 |
discoidin domain receptor tyrosine kinase 2 |
6.1 |
0.01 |
PDGFRB |
platelet-derived growth factor receptor beta |
5.2 |
0.01 |
SCARF1 |
scavener receptor class F member 1 |
5.8 |
0.02 |
COL3A1 |
collagen type III alpha 1 |
7.1 |
0.03 |
STAG3 |
stromal antigen 3 |
6.2 |
0.04 |
RNA sequencing analyses was condensed to Gene ID, Gene name, logFC (log2-fold change) and FDR (Benjamini-Hochberg adjusted p-value to account for multiple comparisons). The panel of 23 genes that exhibit the highest logFC and FDR in the three sensitive cell lines as compared to the three resistant lines were selected as the sensitive signature.
RT-qPCR validation of signature genes
Before moving on to high-density RT-qPCR analysis, we first wanted to validate the robustness of the dual signatures using conventional SYBR Green qPCR on a subset of genes. We designed primers and interrogated three genes from each list to determine if the in silico data was an accurate representation of the in vitro profiles. Primers targeting resistant genes (CDH6, IGFBP7, WNT7A) and sensitive genes (ELFN1, ITPRIPL1, MME) led to prominent discrepancies between cycle threshold (Ct) values from A1847 and PEO4 cell lines (Supplementary Figure 7A & 7B). In certain cases, no amplification curves were evident within 40 cycles, implying miniscule to null transcriptional activity of these genes. As predicted, A1847 mRNA transcripts related to the resistant signature demonstrated much higher Ct values as compared to PEO4 transcripts, with a minimal mean Ct variation of 10.9 ± 1.2 cycles. Similarly, PEO4 transcripts of the sensitive genes showed higher Ct values with a minimal mean of 8.6 ± 1.7 cycles. Notably, similar amplification curves were seen in the reference control gene PPIA in both lines, indicating that the disparate mRNA levels were not a global phenomenon but instead restricted to genes selected from RNA sequencing (Supplementary Figure 7A & 7B). We next wanted to determine if the transcriptional profile of A1847 and PEO4 cell lines persisted when grown in vivo. To that end, we extracted RNA from intraperitoneal tumors grown from these cell lines in NOD scid gamma (NSG) mice and investigated transcriptional levels of the above validation genes (Supplementary Figure 7C & 7D). Interestingly, the disparity of the resistant signature is dampened due to increased transcription in A1847 xenografts, as evident by lower Ct values resulting in a minimal mean difference of 3.9 ± 1.4 cycles. However, the sensitive validation genes displayed comparable differences in Ct between cell line xenografts with a minimal mean variation of 7.9 ± 1.3 cycles. Furthermore, in vivo PPIA expression remained comparable between tumor types (Supplementary Figure 7C & 7D).
We then moved forward with high-density RT-qPCR studies by measuring mRNA expression of the 23 resistant signature genes in A1847 and PEO4 cultured cell lines using a 48x48 dynamic array on the Biomark™ HD system (Fluidigm microfluidic quantitative PCR platform). Using TaqMan® probes we determined basal Ct values of the resistant gene signature and demonstrate that they parallel the in silico data with a minimal mean variation of 15.9 (Figure 4A). We also used the Biomark assay to analyze gene signature fluctuations after 6 hours incubation with auranofin and AUY99, both as single agent and in combination (Supplementary Figure 8A, 8C & 8E). We observed moderate changes in Ct values 6 hours after drug treatment compared to basal levels with the greatest variations occurring in combination treated cells (Figure 4B & Supplementary Table 5). Similar to the SYBR Green results, the divergent gene expression of both basal and drug treated cultures is not reflected in the geometric mean of three reference controls GUSB, PPIA and TBP screened to confirm overall mRNA quality (Supplementary Figures 7E, 8B, 8D & 8F).
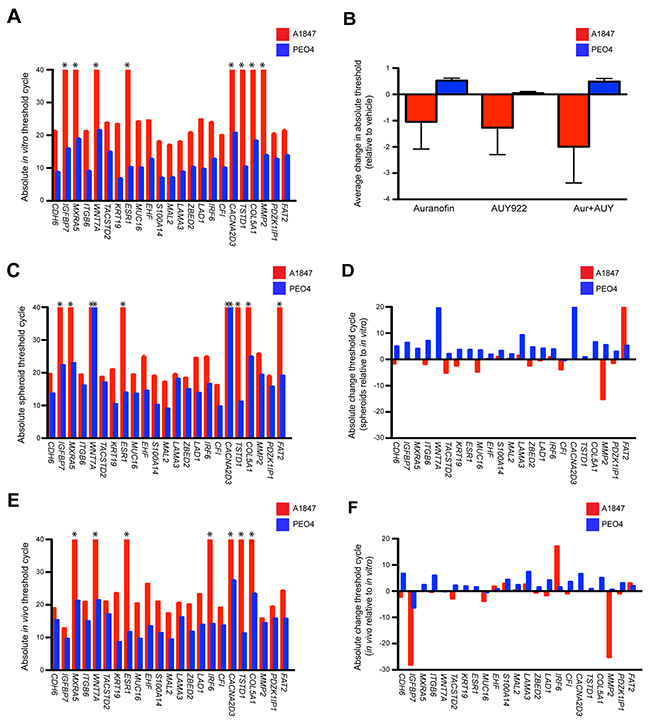
Figure 4: Expression of a 23-gene resistant signature using both in vitro and in vivo models. (A) The 23-gene resistant profiles of A1847 and PEO4 cultured cells were evaluated utilizing TaqMan assays on the Biomark high-density qPCR system. Absolute cycle threshold values ± standard error of the mean from triplicate reactions of two independent experiments are graphed. Asterisks designate lack of amplification curves within 40 cycles. (B) Average variation of cycle thresholds for A1847 and PEO4 cultured cells treated with the indicated compounds, both alone and in combination (Aur + AUY). Data are displayed as bar graphs representing the difference of absolute threshold cycle ± standard error of the mean as compared to basal transcription from triplicate reactions of two independent experiments. Positive and negative columns signify higher and lower Ct values, respectively. (C, E) The 23-gene resistant profile was evaluated in A1847 and PEO4 spheroids and in vivo xenografts utilizing TaqMan assays on the Biomark high-density qPCR system. Absolute cycle threshold values ± standard error of the mean from triplicate reactions of two independent experiments are graphed. Asterisks designate lack of amplification curves within 40 cycles. (D, F) Absolute variation of cycle threshold for A1847 and PEO4 spheroids and in vivo xenografts compared to cultured cells. Data are displayed as bar graphs representing the difference between absolute threshold cycles using triplicate reactions of two independent experiments. Positive and negative columns signify higher and lower Ct values, respectively.
We next wanted to examine alterations in signature expression during the evolution towards a 3D tumor. To that end we forced the A1847 and PEO4 cultured cells into spheroid formation by culturing them in agarose-coated wells then extracted mRNA and compared Ct values for the resistant signature and reference controls from these spheroids (Figure 4C & Supplementary Figure 7F). Similar results were seen using mRNA from in vivo xenografts grown in mice (Figure 4E & Supplementary Figure 7G). Notable exceptions of genes displaying disparate Ct values as compared to the in vitro data are decreased expression of WNT7A and CACNA2D3 in PEO4 spheroids as well as decreased expression of FAT2 paired with increased expression of MMP2 in A1847 spheroids (Figure 4D). Significant changes for in vivo xenografts as compared to in vitro cultured cells are an increase in IGFBP7 and MMP2 expression alongside a decrease in IRF6 within the A1847 tumors (Figure 4F). Altogether, these results imply that the genetic machinery responsible for robust expression inherent to a given cell line may not be remarkably affected during the transformation from 2D to 3D models.
Investigation of publicly available datasets for prevalence of genetic signatures
In order to determine whether EOC clinical samples are best represented by the resistant or sensitive signatures, we sought out the prevalence of these genes in publicly available databases. To substantiate the results produced from cell lines grown in the laboratory to those found in online resources, we first utilized the Cellminer database that queries molecular datasets focused on NCI-60 cell lines [57, 58]. Using this portal, we were able to extract average z-scores for our genes of interest from three of the cell lines used in our studies (OVCAR8, OVCAR4 & SKOV3) that reflected similar expression trends for both signatures (Supplementary Figure 9A & 9B). OVCAR8 displayed an average z-score of -0.5 for resistant genes and +0.6 for sensitive. Alternatively, OVCAR4 and SKOV3 show a +1.4 and +1.0 for resistant genes and -0.5 and -0.7 for sensitive, respectively. These results validate both the integrity of our cell lines as well as the robustness of the in silico data.
Recent interest in targeting the PRKCI pathway using auranofin as a treatment for ovarian cancer patients led us to investigate expression of this molecule in cell line models and to see if any correlation exists with our viability data. Using Cellminer, we determined the combined NCI-60 ovarian lines exhibited both the highest average z-score and protein RPLA levels relative to the other eight cancer types (Supplementary Figure 10A & 10B). We then performed copy number analysis on our sensitive and resistant cell line models that showed a modest trend toward increased PRKCI (the gene encoding protein kinase C iota) copy number in our resistant group (OVCAR4, PEO4 and SKOV3), though this difference was not significant (Supplementary Figure 10C). Finally, we analyzed if the log gene counts of our RNAseq data correlated with auranofin IC50 values across ten of our ovarian lines (Supplementary Figure 10D). The log gene count was elevated across all lines tested; further indicating that high expression of PRKCI is a common feature in ovarian cancer signaling. Although there is a significant Pearson correlation (0.66, p-value=0.036), this predictive value may be limited by the small dynamic range and high expression across all samples. Therefore, further investigation into the synergistic effects of PRKCI inhibition is warranted, but overall these data suggest that PRKCI is an attractive molecular target with enhanced specificity to ovarian cancer signaling.
To investigate if genes from our signatures are endemic in clinical EOC expression studies, we mapped TCGA Agilent probe IDs to our HGNC genes of interest. We then extracted gene expression data from 518 TCGA tumor samples and 8 normal fallopian tissues. Eight of the 23 genes in our resistant signature displayed average expression in tumor samples greater than 2-fold normal controls (CDH6, IRF6, MXRA5, WNT7A, MUC16, MAL2, ZBED2 and S100A14) (Figure 5A & Supplementary Table 6). Alternatively, the sensitive signature showed only a single gene with significantly increased expression in tumors (COL3A1) (Supplementary Figure 9C & Supplementary Table 6), implying that these genes are less likely to be detected in large tumor panels compared to our selections based on resistance. Likewise, only a single gene from the resistant panel had higher expression in fallopian tissue compared to tumors (IGFBP7) (Supplementary Figure 9D, Supplementary Table 6), while 7 genes from the sensitive panel were shown to be expressed at significantly greater values in normal versus control tissue (PLAC8, STAG3, DDR2, SERPINF1, BAHCC1, CCND2, TBX2) (Figure 5B & Supplementary Table 6). This provides evidence that genes affiliated with resistance to our drug combination are more prevalent in tumor biology compared to those linked to sensitivity. Next, we determined the percentage of tumors that expressed individual Agilent probes greater than 2-fold of fallopian tissue (Supplementary Figure 9E & 9F). Again, expression of resistance genes was more common in the patients’ tumors (6 of the genes upregulated in > 50% of all tumor samples and 9 genes upregulated in < 20%) compared to those from the sensitive panel (2 of the genes upregulated in > 50% of all tumor samples with 18 genes upregulated in < 20%).
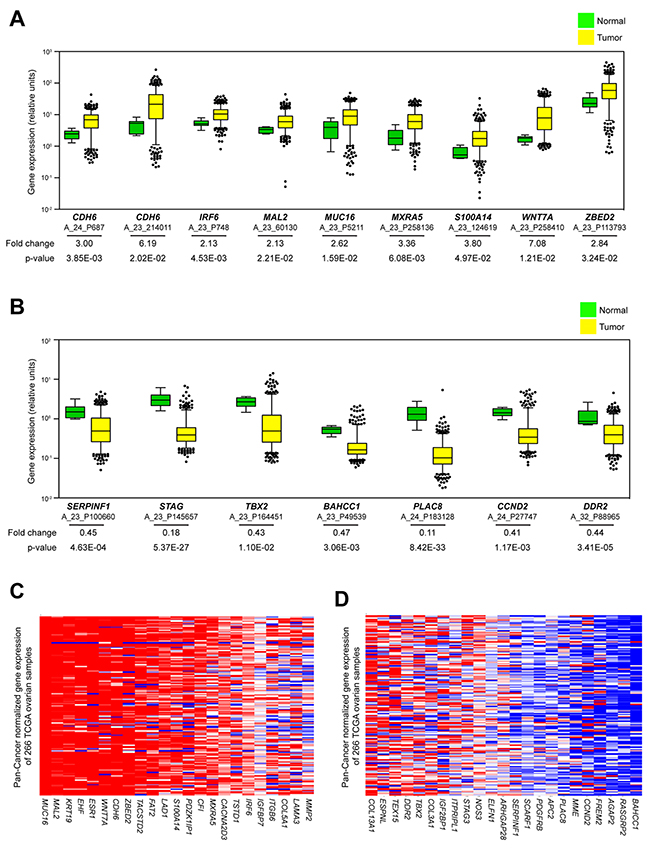
Figure 5: Investigation of publicly available datasets for prevalence of genetic signatures. (A) Average expression values of Agilent probes related to an increase in the resistant signature from 518 TCGA tumors relative to 8 fallopian control samples. Data are displayed as box plots representing 8 genes (derived from 9 unique probes) that showed average increase of expression in tumors (yellow) greater than 2-fold increase over fallopian (green). (B) Average expression values of Agilent probes related to a decrease in the sensitive signature from 518 TCGA tumors relative to 8 fallopian control samples. Data are displayed as box plots representing 7 genes (derived from 7 unique probes) that showed average decrease of expression in tumors (yellow) greater than 2-fold increase over fallopian (green). The whiskers of each box plot represent expression values at 5th and 95th percentiles. Average fold change expression and p-values are indicated for each probe. (C, D) Heat map data of mRNA expression related to resistant and sensitive signatures from 266 TCGA serous ovarian patient samples sequenced using Illumina technology. All samples are mean-normalized per gene to 19 tumor types using Pan-Cancer analysis. Red and blue indicate increased and decreased mRNA expression, respectively.
Finally, we wanted to investigate the relationship between our cell line signatures and the Pan-Cancer datasets that compile genomic information from TCGA studies across a multitude of cancer types [59, 60]. Assembling this mean-normalized RNA sequencing data provides the opportunity to evaluate genes of interest across a spectrum of cancer cohorts and is possible using the UCSC Cancer Genomics Browser (https://genome-cancer-ucsc.edu) [61]. Again, genes pertaining to our resistant signature appear much more likely to be detected within the 266 curated serous ovarian TCGA tumors than those from the sensitive list as compared to the sensitive signature (Figure 5C & 5D). Altogether, these studies provide justification that the cell lines displaying inherent resistance to the combination treatment of auranofin and AUY922 are superior models than the sensitive group for recapitulating the transcriptional profile of clinical EOC samples.
DISCUSSION
Our motivation for this study was to determine if we could garner reliable information from 384-well high-throughput drug screening all the way through to existing clinical databases. The therapeutic potential provided would be feasible novel treatment options. We focused on the development of high-throughput viability screens of EOC cell lines paired alongside RNA sequencing technology to provide linkage between global gene expression and specific drug activity. To that end, we performed large-scale drug screening experiments with multiple ovarian cancer lines tested against a panel of clinically relevant compounds. Although we saw considerable potency from auranofin or AUY922 alone against several EOC cell lines, we focused on combining due to the inherent resistance displayed by other EOC lines, similar to what is seen among clinical responses using current chemotherapeutic protocols. We then investigated pathways downstream of these compounds and created multi-gene signatures linked to sensitivity or resistance. The availability of publically available genomic data through collections such as the TCGA allowed us to visualize the proclivity of our resistance signature within the patient population. Taken together, this study provides a platform to logically develop personalized treatments for patients with ovarian cancer.
By using a broad screening panel and correlating the response to genomic signatures, it may be possible to circumvent the diverse genetic complexity preventing successful treatment of late-stage EOC. Aberrant p53 and DNA repair functions in HGS tumors result in widespread genomic variance [2]. Relying solely on tissue of origin to determine treatment protocols is imprecise, instead the focus needs to shift to specific vulnerabilities inherent to individual tumors. Other tumor types, such as pancreatic ductal adenocarcinoma, demonstrate marked heterogeneity and have also proven difficult to treat successfully [62]. Even well characterized tumor types with dependable molecular biomarkers can be stratified into a spectrum of classifications previously unavailable using histologic or single-gene criteria. Therefore, the historical method of elucidating communal drivers intrinsic to certain tumor types to gauge effective therapeutic response may be better utilized by cataloging the efficacy of all available compounds against families of gene signatures. New and repurposed drug combinations could then be best matched to individual patients. The correlation between in vitro or clinical sequencing information to sensitivity data for the vast collection of FDA-cleared drugs can provide a system for therapeutic discovery.
Although randomized clinical trials have led to substantial advancement in understanding numerous disease processes, they have also resulted in needless treatment for patients who receive no benefit, which in turn leads to statistical insignificance of potentially effective compounds. In certain instances, targeted therapies have demonstrated improved response rates due to increased activity in subsets of tumors. The tyrosine kinase inhibitor imatinib mesylate (Gleevec®), for the treatment of Philadelphia chromosome-positive chronic myelogenous leukemia and KIT-positive gastrointestinal stromal tumors [63, 64], as well as the monoclonal antibody trastuzumab (Herceptin®) directed against HER2-positive breast cancer and gastroespohageal cancer [65], are two notable examples of targeted therapies with high activity in subsets of tumors. However, acquired resistance to single agent targeted therapy is commonplace and poses a substantial challenge to the management of aggressive cancers. Additionally, the cost and time commitment related to developing new therapies is prohibitive [66]. One potential explanation for the disparity between positive results in preclinical studies and negative results during human trials is a reliance on “disease-specific” cell culture models. Historically, a subset of cellular models has been utilized to recapitulate a wide spectrum of patient tumors resulting in unreliable activity during trials. As our studies show, a broad panel of mechanistic assays in ovarian cell lines demonstrated little commonality for signaling markers between the cell lines of the sensitive and resistant groups. Realistically, in vitro genomic alterations occur due to frequent passaging, variance in culturing techniques and/or extended cryopreservation. Therefore, performing preclinical studies using 2D cells that once demonstrated histological similarities to a given tumor type is an outdated and inefficient use of resources. Though dominant pathways may continue to drive proliferation among particular tumor cell line models, a more widespread molecular profile is warranted to determine the extent of genetic evolution and its usefulness as a clinical surrogate [67]. Researchers may find it best to first determine expression profiles from a tumor of interest and then screen for relevant cell lines that exhibit comparable signatures, even if that results in the use of atypical cell line models for the tumor type being evaluated. In our studies, the gene expression signatures from our resistant cell lines were more similar to clinical samples in the TCGA database than were the signatures of the sensitive group, thereby strengthening the importance of the resistant lines as the relevant tumor models.
It may prove more practical to investigate therapeutic intervention with existing FDA-approved compounds generated for other indications [68, 69]. However, one potential pitfall with a repurposing approach for existing compounds is achieving the clinically effective dosing needed in order for them to be used as chemotherapeutic agents. For example, although auranofin is helpful in reducing inflammation for arthritic patients, it has poor bioavailability when taken orally, with only 15-20% detected in plasma after dosing [25]. Two recent trials assessing auranofin as a monotherapy concluded with mixed results, possibly reflecting inefficient pharmacokinetics [36, 70]. Our recent studies of Ewing sarcoma further suggested that gold levels obtained via oral delivery of auranofin might be insufficient to achieve optimal anti-cancer effects [69]. Therefore, reformulation of the active gold component using intravenous or intraperitoneal delivery could potentially enhance the anti-tumoral activity of auranofin in ovarian cancer patients through both spatial targeting of the tumor and avoidance of the myriad of physiological factors affecting drug absorption via the gastrointestinal tract. Additionally, evaluating synergistic effects between repurposed classes of drugs may prove useful in circumventing resistant phenotypes through complementary blockade of discrete signaling pathways [71, 72]. Whereas auranofin as a single-agent has shown limited usefulness, multiple independent studies are investigating its benefit as a cooperative agent [28, 38–42, 73]. It is possible that the value of auranofin lies in contributing specific insults alongside other classes of chemotherapeutics. Heightened levels of ROS paired with inhibition of the proteasome ubiquitin system could overstress an adaptive tumor cell towards apoptosis. In our study, the use of auranofin in combination with an HSP90 inhibitor increased the effectiveness of the drug at lower concentrations, which could be beneficial to overcoming the clinical pitfalls seen with patient toxicities.
In order to make truly informed treatment decisions, a broader clinical evaluation of tumoral heterogeneity beyond single-pathway analysis is warranted. Cataloging genetic signatures could prove to be a sensible method for stratifying EOC patients into relevant targeted clinical trials [3, 74]. Microfluidic chips, RNAseq and digital multiplexed gene expression analysis have all demonstrated robustness and versatility using nucleic acid screening technologies [19, 75–77]. Global expression within individual tumors can now be generated using instrumentation available in clinical laboratories. Although the amount of raw sequencing data produced is abundant, it can be packaged into practical information using available bioinformatical toolboxes. Collective portals containing metadata of in vitro and in vivo metadata such as genetic signatures, isoform specificity and drug sensitivity information can be utilized by researchers to seek out pattern recognition across a milieu of cellular and tumor types, a process unfeasible using conventional detection methods. Resources such as the Pan-Cancer prognostic signatures utilized in this study will allow access to ~11,000 human tumors encompassing 33 malignances from the TCGA data sets [78]. Additional inclusion of alternate molecular information, such as epigenomic and proteomic data, will lead to greater understanding of both tumor biology and pharmacogenomic influences. Burgeoning fields of study such as lncRNA activity allow for ample opportunity to detect patterns of expression in large, publically accessible datasets. lncRNA is a broad term denoting non-coding RNA greater than 200 nucleotides in length linked to various cancer types due to tissue-specific expression of 28,000 distinct transcripts mediating gene regulation and chromatin modification [79]. HOTAIR, an lncRNA originating in the HOXC cluster targets PRC2 complexes across chromosomes in the HOXD locus, has been linked to tumor progression in ovarian cancer. Recent studies involving both meta-analyses and gene signature construction are further gleaning the importance of lncRNAs, including HOTAIR, as biomarkers in this disease [80–82].
In conclusion, this study provides a platform to guide therapy based on widespread genomic signatures instead of single pathway inhibition. This is a promising approach to help tackle the treatment of ovarian cancer that lacks the common driver mutations necessary for targeted therapy. Instead, selection of drug combinations directed towards multiple cellular pathways associated with ovarian cancer progression may provide a platform for preselection based on genetic signatures.
MATERIALS AND METHODS
Compounds
Auranofin, AUY922 and ganetespib were purchased from Selleckchem. Upon receipt, dimethyl sulfoxide (DMSO) was used to prepare 10 mM stock solutions for all compounds except auranofin, which was prepared at 5 mM concentration due to reduced solubility. Single-use aliquots of stock solution were stored at -80°C.
Cell culture
All cell lines used in this study were obtained or derived at the Fox Chase Cancer Center (Philadelphia, PA). Details of the origin of the EOC cell lines (A1847, A2780, C30, CP70, OVCAR4, OVCAR5, OVCAR8, OVCAR10, PEO4 and SKOV3) have been previously reported [83, 84]. All cell lines were grown in RPMI 1640 media (Corning Cellgro) containing 2 mM L-glutamine and supplemented with 10% FBS (Gibco), 100 U/mL penicillin (Corning Cellgro), 100 μg/mL streptomycin (Corning Cellgro), and 7.5 μg/mL insulin (Gibco) and maintained at 37°C in a humidified atmosphere with 5% CO2. Spheroids were formed using the liquid-overlay method with agarose coated 96-well plates. Briefly, 96-well flat bottom plates were coated with 50 μL 1.5% agarose (Sigma Aldrich). Agarose was dried for 30 minutes then 3,000 cells (A1847 or PEO4) were plated in media to commence spheroid formation. Fresh media was overlaid after four days and spheroids were collected after seven total days growth.
Drug screening and cell viability measurements
The six EOC cell lines were grown to 80% confluency, harvested and seeded into 96-well plates at concentrations of 2000 to 4000 cells per well in a total volume of 95 μL. Twenty-four hours after seeding, drug compounds were prepared using cell growth media and 5 μL of each were added to the seeded cells of the 96-well plates. A Microlab Nimbus 96 pipetting robot (Hamilton) was used to prepare serial dilutions and drug addition to the cell lines. The final drug solutions consisted of eight concentrations ranging from 20 to 0.0012 μmol/L (serial four-fold dilutions). Vehicle-only wells were included on each plate to serve as interplate normalization controls. Seventy-two hours following drug addition, CellTiter Blue reagent (Promega) was added directly to each well using a Matrix WellMate (Thermo Scientific). The plates were incubated at 37 °C for 150 minutes and the fluorescent signal was measured using an Infinite® M200 Pro microplate reader (Tecan). The ratio of fluorescent signal in drug treated wells to that of average fluorescent signal from vehicle treated wells on each plate multiplied by 100 was calculated to yield percent cell viability for each drug treated well. A minimum of two biological replicates was performed for each cell line. Data analysis calculated IC50 values using Prism 5 software (GraphPad). All data in the viability curves are reported as mean ± standard error of the mean (SEM).
Drug combination studies
In order to determine synergistic effects of the two compounds, EOC cells were seeded into 96-well plates as described above. Twenty-four hours after seeding, serial dilutions of auranofin, AUY922 or both were freshly prepared in DMSO/media and added to the wells either as single agent or a combination. Assays were performed as biological duplicates using triplicate wells within each experiment. Cell viability following 72 hours of treatment was evaluated using CTB as described above and CalcuSyn (Biosoft) software was used based on the Chou-Talalay method [50, 85]. The CalcuSyn software generates combination index (CI) values that determine the effect of the drug combination in comparison to the single compounds. A CI of <0.3 indicates strong synergistic effect between the two compounds, whereas a CI of 0.3 - 0.8 and >0.8 indicates synergistic and non-synergistic effect, respectively.
Apoptosis
Annexin V labeling was performed using the Guava Nexin assay kit (Millipore) that contains a premixed cocktail of phycoerythrin-conjugated Annexin V and a cell impermeant dye (7-AAD). Cells in log phase of growth were grown to subconfluency, detached and seeded into 6-well plates at a concentration of 1×10⁵ - 2×10⁵ cells per well. Cells were allowed to attach overnight then treated with or without compound at the indicated concentrations. After 48 hours, cells were diluted to 5×10⁵ cells/mL and incubated with Guava Nexin reagent for 30 minutes. The assay was performed three independent times with three technical replicates each. Results were analyzed using a Guava easyCyte HT instrument (Millipore) and expressed as fold change of gated cells that are positive for Annexin V staining compared to vehicle control.
Western blot
Cell lysates were prepared in M-PER Mammalian Protein Extraction Reagent (Thermo Scientific) with Mini protease and Halt phosphatase inhibitor cocktails (Thermo Scientific) and protein concentration was determined using the BCA assay (Thermo Scientific). 25 μg of total cellular protein was separated on SDS/PAGE gels and transferred to nitrocellulose membrane that was blocked for 1 hour at room temperature in 5% nonfat milk. Primary antibodies were added overnight at 4°C with gentle shaking. The primary antibodies used were: anti-TP53 (Sigma), anti-CDKN1A (Cell Signaling), anti-NRF2 (Abcam), anti-KEAP1 (Abcam), anti-ubiquitin (Cell Signaling), anti-HSP70 (Enzo), anti-HSP90 (Cell Signaling), anti-pAKTThr308 (Cell Signaling), anti-pAKTSer473 (Cell Signaling) and anti-AKT (Cell Signaling). After incubation with the appropriate secondary antibody, signals were detected using ECL Western Blotting Substrate (Thermo Scientific). Equal protein loading in each lane was confirmed with β-actin antibody (Sigma). Densitometry analysis was performed using the freely available image-processing program ImageJ (NIH).
Thioredoxin reductase assay
Cells in log phase of growth were grown to subconfluency, detached and seeded into 6-well plates at a concentration of 5×10⁵ cells per well. Cells were allowed to attach overnight then treated with or without compound at indicated concentrations for 6 hours. Cells were lysed and 40 μg of total protein was used to measure TrxR activity using the TrxR Reductase Assay Kit (Abcam) according to manufacturer protocol.
ROS activity measurement
Cells in log phase of growth were grown to subconfluency, detached and seeded into 96-well plates at a concentration of 2.5x10⁴ cells per well. ROS activity was measured using the Cellular Reactive Oxygen Species Detection Assay Kit (Abcam) according to manufacturer protocol. Briefly, cells were allowed to attach overnight, washed then treated with or without compound at indicated concentrations and timepoints. Cells were then exposed to 2’,7’-dichlorodihydrofluorescin diacetate (DCFH-DA) for 40 minutes and fluorescence was measured at 485/535 nm on a Tecan microplate reader.
Copy number calculation
Total DNA was isolated from cultured cells using the JetFlex Genomic DNA Purification Kit (Invitrogen). Cells were lysed and subjected to Proteinase K prior to ethanol precipitation of DNA. An input concentration of 5 ng/μL was processed with a TaqMan® Copy Number Assay (Applied Biosystems). Results from a real-time PCR reaction were imported into CopyCaller™ Software (Applied Biosystems, version 2.1) that performs a Δ ΔCT analysis which determines the relative copy number of the PRKCI gene normalized to the known copy number of RNAaseP.
Real-time RT-PCR
Total RNA was extracted from EOC cell lines and spheroids using Trizol (Invitrogen) in Phase Lock Gel Heavy tubes (5Prime) then transitioned to RNeasy (Qiagen) columns with subsequent DNase treatment. For in vivo xenograft studies, A1847 and PEO4 cells were implanted intraperitoneally into female NOD.Cg-PrkdcscidIl2rgtm1Wjl/SzJ mice (Jackson). Mice were housed in our approved University Animal Facility with 12-hour light cycles, food/water were provided ad libitum. Institutional approval was granted for all experiments via an Animal Care and Use Protocol. Solid tumors were collected and tissue homogenized in Trizol using a Bullet Blender (Next Advance) followed by RNA isolation as above. cDNA was created from pooled RNA of three technical replicates using SuperScript III (Invitrogen) and amplification was performed on a CFX96 Real-Time System (Bio-Rad) using Maxima SYBR Master Mix (Thermo Scientific). All amplification reactions were performed at least twice using three technical replicates each and melting curve analyses were performed to ensure amplification specificity. Relative mRNA levels for each gene were assessed following normalization to an internal reference control (RC) PPIA. Threshold cycle (Ct) values were determined using amplification curves then normalized to RC expression to calculate ΔCt for each sample as follows: ΔCtgene of interest = Ctgene of interest – CtRC. The amount of mRNA in drug treated cells relative to vehicle treated cells was calculated as follows: 2-ΔΔCt, where ΔΔCt = ΔCtdrug treated gene of interest – ΔCtvehicle treated gene of interest. Due to large disparities in Ct values between A1847 and PEO4 in signature validation and high-density RT-qPCR studies, the customary 2-ΔΔCt method for comparing relative mRNA expression was abandoned and absolute Ct values provided. Bio-Rad CFX Manager and GraphPad Prism software were used for statistical analyses and graphs. Primer sequences are described in Supplementary Methods.
Generation of the dual genetic signatures
Total RNA was extracted as described above and prepared for paired end sequencing on a HiSeq 2500 using a stranded library prep kit (Illumina). Initial analyses were prepared using RSEM expected gene counts. First, data were filtered to remove non/low-expressed genes. This resulted in a total of ~14,000 genes that were examined for differential expression between the grouped sensitive versus resistant cell lines. Next, normalization factors were calculated to scale the library sizes followed by estimation of tag wise negative binomial dispersion values. An exact test was implemented for differences in gene wise mean expression values between resistance and sensitivity phenotypes. Genes were then ranked according to both log fold change and multiple testing adjusted false discovery rate (FDR) q-values. Expected isoform counts of corresponding genes were matched to RefSeq IDs and tabulated for each cell line. lncRNA quantification was extracted from RNAseq data by RefSeq IDs using the statistical software R, then pair-wise comparison between sensitive and resistant cell line groups was conducted using the edgeR bioconductor package.
High-density RT-PCR
The Fluidigm BioMark™ HD system was used to run 48x48 dynamic arrays to measure basal mRNA expression levels in EOC cell lines, spheroids and xenografts. Total RNA was extracted as described above and three biological replicates were pooled for analysis. 250 ng of mRNA were reverse transcribed and the resulting cDNA was pre-amplified using a multiplexed specific target amplification protocol with gene specific TaqMan assays (Applied Biosystems). The targeted cDNA was diluted 5-fold and used as input cDNA for qPCR arrays on the BioMark following manufacturer recommended protocols. Absolute Ct values were determined using amplification curves and equality of amplifiable mRNA was assessed by comparing geometric means of three internal reference controls; GUSB, PPIA and TBP. GraphPad Prism software was used for statistical analyses and graphs.
In silico interrogation of publicly available databases
The CellMiner™ analysis tool (http://discover.nci.nih.gov/cellminer/analysis.do) was used to query NCI-60 cell line signatures. It provides average z-scores and RPLA protein levels from genes of interest for the available lines. Analysis of the TCGA microarray gene expression dataset was performed using the log2 transformed Agilent values for the genes of interest from 518 serous cystadenocarcinoma patients and 8 organ-specific healthy control samples (http://tcga-data.nci.nih.gov/tcga/tcgaHome2.jsp). Anti-log values were determined and mean expression values for all samples were calculated. The fold-change of average expression in the tumors relative to controls was constructed and a Student’s two-tailed t-test was performed. A fold-change of ≥ 2 with an associated p-value < 0.05 was set as a significant difference in expression between groups. The UCSC Cancer Genome Browser portal was used for investigation of direct RNA sequencing comparisons (https://genome-cancer.ucsc.edu/). It enables heat map construction using level 3 TCGA ovarian data from 266 samples that is mean normalized to 19 tumor types from the Pan-Cancer datasets.
ACKNOWLEDGMENTS
We would like to thank Brooke Fridley and Junqiang Dai for assistance in gene signature analysis, Erin Hayes for her work on the high-throughput drug screen and Thuy-Vy Do for guidance in the combination index studies. The authors also gratefully acknowledge the support of the Biospecimen Repository Core Facility and the Biostatistics and Informatics Shared Resource funded in part by the National Cancer Institute Cancer Center Support Grant (P30 CA168524). Statistical genomics and bioinformatics related analyses presented in this manuscript were performed by the K-INBRE Bioinformatics Core that is supported in part by the National Institute of General Medical Science award (P20 GM1034180).
CONFLICTS OF INTEREST
The authors declare no conflicts of interest.
FUNDING
This work was supported in part by the Lied Basic Sciences Program (KUMC) to SH, the Madison and Lila Self Graduate Fellowship to JH and the Interdisciplinary Women’s Health Research Scholarship through the BIRCWH K12 Program (KUMC) to HP sponsored by a grant from the National Institute of Child Health and Human Development (K12 HD052027). In addition, a grant from the Kansas Bioscience Authority Eminent Scholar Program to AKG and grants from the National Cancer Institute (R01 CA140323 and R01 CA214545) to AKG. AKG is the Chancellors Distinguished Chair in Biomedical Sciences endowed Professor. The funders had no role in study design, data collection and analysis, decision to publish or preparation of the manuscript.
REFERENCES
1. Jemal A, Bray F, Center MM, Ferlay J, Ward E, Forman D. Global cancer statistics. CA Cancer J Clin. 2011; 61:69–90.
2. Cancer Genome Atlas Research Network. Integrated genomic analyses of ovarian carcinoma. Nature. 2011; 474:609–615.
3. Leong HS, Galletta L, Etemadmoghadam D, George J, Kobel M, Ramus SJ, Bowtell D, Australian Ovarian Cancer Study. Efficient molecular subtype classification of high-grade serous ovarian cancer. J Pathol. 2015; 236:272–277.
4. Chan J, Kinsella MT, Willis JE, Hu H, Reynolds H Jr, Delaney C, McCulla A, Deharo S, Ahdesmaki M, Allen WL, Johnston PG, Kinsella TJ. A predictive genetic signature for response to fluoropyrimidine-based neoadjuvant chemoradiation in clinical stage II and III rectal cancer. Front Oncol. 2013; 3:288.
5. Fiebig HH, Schuler J, Bausch N, Hofmann M, Metz T, Korrat A. Gene signatures developed from patient tumor explants grown in nude mice to predict tumor response to 11 cytotoxic drugs. Cancer Genomics Proteomics. 2007; 4:197–209.
6. Mintz MB, Sowers R, Brown KM, Hilmer SC, Mazza B, Huvos AG, Meyers PA, Lafleur B, McDonough WS, Henry MM, Ramsey KE, Antonescu CR, Chen W, et al. An expression signature classifies chemotherapy-resistant pediatric osteosarcoma. Cancer Res. 2005; 65:1748–1754.
7. Sorlie T, Perou CM, Tibshirani R, Aas T, Geisler S, Johnsen H, Hastie T, Eisen MB, van de Rijn M, Jeffrey SS, Thorsen T, Quist H, Matese JC, et al. Gene expression patterns of breast carcinomas distinguish tumor subclasses with clinical implications. Proc Natl Acad Sci U S A. 2001; 98:10869–10874.
8. Kim HS, Mendiratta S, Kim J, Pecot CV, Larsen JE, Zubovych I, Seo BY, Kim J, Eskiocak B, Chung H, McMillan E, Wu S, De Brabander J, et al. Systematic identification of molecular subtype-selective vulnerabilities in non-small-cell lung cancer. Cell. 2013; 155:552–566.
9. Li X, Wu WK, Xing R, Wong SH, Liu Y, Fang X, Zhang Y, Wang M, Wang J, Li L, Zhou Y, Tang S, Peng S, et al. Distinct subtypes of gastric cancer defined by molecular characterization include novel mutational signatures with prognostic capability. Cancer Res. 2016; 76:1724–1732.
10. Tang H, Xiao G, Behrens C, Schiller J, Allen J, Chow CW, Suraokar M, Corvalan A, Mao J, White MA, Wistuba II, Minna JD, Xie Y. A 12-gene set predicts survival benefits from adjuvant chemotherapy in non-small cell lung cancer patients. Clin Cancer Res. 2013; 19:1577–1586.
11. Barretina J, Caponigro G, Stransky N, Venkatesan K, Margolin AA, Kim S, Wilson CJ, Lehar J, Kryukov GV, Sonkin D, Reddy A, Liu M, Murray L, et al. The cancer cell line encyclopedia enables predictive modelling of anticancer drug sensitivity. Nature. 2012; 483:603–607.
12. Lamb J, Crawford ED, Peck D, Modell JW, Blat IC, Wrobel MJ, Lerner J, Brunet JP, Subramanian A, Ross KN, Reich M, Hieronymus H, Wei G, et al. The connectivity map: using gene-expression signatures to connect small molecules, genes, and disease. Science. 2006; 313:1929–1935.
13. Liu H, D’Andrade P, Fulmer-Smentek S, Lorenzi P, Kohn KW, Weinstein JN, Pommier Y, Reinhold WC. mRNA and microRNA expression profiles of the NCI-60 integrated with drug activities. Mol Cancer Ther. 2010; 9:1080–1091.
14. Mahadevan B, Snyder RD, Waters MD, Benz RD, Kemper RA, Tice RR, Richard AM. Genetic toxicology in the 21st century: reflections and future directions. Environ Mol Mutagen. 2011; 52:339–354.
15. Lehmann BD, Ding Y, Viox DJ, Jiang M, Zheng Y, Liao W, Chen X, Xiang W, Yi Y. Evaluation of public cancer datasets and signatures identifies TP53 mutant signatures with robust prognostic and predictive value. BMC Cancer. 2015; 15:179.
16. Lopes-Ramos C, Koyama FC, Habr-Gama A, Salim AC, Bettoni F, Asprino PF, Franca GS, Gama-Rodrigues J, Parmigiani RB, Perez RO, Galante PA, Camargo AA. Comprehensive evaluation of the effectiveness of gene expression signatures to predict complete response to neoadjuvant chemoradiotherapy and guide surgical intervention in rectal cancer. Cancer Genet. 2015; 208:319–326.
17. Starmans MH, Krishnapuram B, Steck H, Horlings H, Nuyten DS, van de Vijver MJ, Seigneuric R, Buffa FM, Harris AL, Wouters BG, Lambin P. Robust prognostic value of a knowledge-based proliferation signature across large patient microarray studies spanning different cancer types. Br J Cancer. 2008; 99:1884–1890.
18. Nielsen T, Wallden B, Schaper C, Ferree S, Liu S, Gao D, Barry G, Dowidar N, Maysuria M, Storhoff J. Analytical validation of the PAM50-based prosigna breast cancer prognostic gene signature assay and ncounter analysis system using formalin-fixed paraffin-embedded breast tumor specimens. BMC Cancer. 2014; 14:177.
19. Wallden B, Storhoff J, Nielsen T, Dowidar N, Schaper C, Ferree S, Liu S, Leung S, Geiss G, Snider J, Vickery T, Davies SR, Mardis ER, et al. Development and verification of the PAM50-based prosigna breast cancer gene signature assay. BMC Med Genomics. 2015; 8:54.
20. Chen P, Huhtinen K, Kaipio K, Mikkonen P, Aittomaki V, Lindell R, Hynninen J, Auranen A, Grenman S, Lehtonen R, Carpen O, Hautaniemi S. Identification of prognostic groups in high-grade serous ovarian cancer treated with platinum-taxane chemotherapy. Cancer Res. 2015; 75:2987–2998.
21. Ow GS, Ivshina AV, Fuentes G, Kuznetsov VA. identification of two poorly prognosed ovarian carcinoma subtypes associated with CHEK2 germ-line mutation and non-CHEK2 somatic mutation gene signatures. Cell Cycle. 2014; 13:2262–2280.
22. Chen F, Liu N. A 10-gene expression signature of notch pathway predicts recurrence in ovarian carcinoma. Oncol Lett. 2015; 10:1704–1708.
23. Lloyd KL, Cree IA, Savage RS. Prediction of resistance to chemotherapy in ovarian cancer: a systematic review. BMC Cancer. 2015; 15:117.
24. Finkelstein AE, Walz DT, Batista V, Mizraji M, Roisman F, Misher A. Auranofin. New oral gold compound for treatment of rheumatoid arthritis. Ann Rheum Dis. 1976; 35:251–257.
25. Roder C, Thomson MJ. Auranofin: repurposing an old drug for a golden new age. Drugs R D. 2015; 15:13–20.
26. U.S. National Institutes of Health. Phase I and II Study of Auranofin in Chronic Lymphocytic Leukemia (CLL), 2016.
27. Weir SJ, DeGennaro LJ, Austin CP. Repurposing approved and abandoned drugs for the treatment and prevention of cancer through public-private partnership. Cancer Res. 2012; 72:1055–1058.
28. Fiskus W, Saba N, Shen M, Ghias M, Liu J, Gupta SD, Chauhan L, Rao R, Gunewardena S, Schorno K, Austin CP, Maddocks K, Byrd J, et al. Auranofin induces lethal oxidative and endoplasmic reticulum stress and exerts potent preclinical activity against chronic lymphocytic leukemia. Cancer Res. 2014; 74:2520–2532.
29. Pessetto ZY, Weir SJ, Sethi G, Broward MA, Godwin AK. Drug repurposing for gastrointestinal stromal tumor. Mol Cancer Ther. 2013; 12:1299–1309.
30. Liu N, Li X, Huang H, Zhao C, Liao S, Yang C, Liu S, Song W, Lu X, Lan X, Chen X, Yi S, Xu L, et al. Clinically used antirheumatic agent auranofin is a proteasomal deubiquitinase inhibitor and inhibits tumor growth. Oncotarget. 2014; 5:5453–5471. https://doi.org/10.18632/oncotarget.2113.
31. Kim NH, Park HJ, Oh MK, Kim IS. Antiproliferative effect of gold(I) compound auranofin through inhibition of STAT3 and telomerase activity in MDA-MB 231 human breast cancer cells. BMB Rep. 2013; 46:59–64.
32. Nakaya A, Sagawa M, Muto A, Uchida H, Ikeda Y, Kizaki M. The gold compound auranofin induces apoptosis of human multiple myeloma cells through both down-regulation of STAT3 and inhibition of NF-kappaB activity. Leuk Res. 2011; 35:243–249.
33. Marzano C, Gandin V, Folda A, Scutari G, Bindoli A, Rigobello MP. Inhibition of thioredoxin reductase by auranofin induces apoptosis in cisplatin-resistant human ovarian cancer cells. Free Radic Biol Med. 2007; 42:872–881.
34. Park SH, Lee JH, Berek JS, Hu MC. Auranofin displays anticancer activity against ovarian cancer cells through FOXO3 activation independent of p53. Int J Oncol. 2014; 45:1691–1698.
35. Wang Y, Hill KS, Fields AP. PKCiota maintains a tumor-initiating cell phenotype that is required for ovarian tumorigenesis. Mol Cancer Res. 2013; 11:1624–1635.
36. Jatoi A, Radecki Breitkopf C, Foster NR, Block MS, Grudem M, Wahner Hendrickson A, Carlson RE, Barrette B, Karlin N, Fields AP. A mixed-methods feasibility trial of protein kinase C iota inhibition with auranofin in asymptomatic ovarian cancer patients. Oncology. 2015; 88:208–213.
37. Oommen D, Yiannakis D, Jha AN. BRCA1 deficiency increases the sensitivity of ovarian cancer cells to auranofin. Mutat Res. 2015; 784-785:8–15.
38. Fan C, Zheng W, Fu X, Li X, Wong YS, Chen T. Enhancement of auranofin-induced lung cancer cell apoptosis by selenocystine, a natural inhibitor of TrxR1 in vitro and in vivo. Cell Death Dis. 2014; 5:e1191.
39. Fath MA, Ahmad IM, Smith CJ, Spence J, Spitz DR. Enhancement of carboplatin-mediated lung cancer cell killing by simultaneous disruption of glutathione and thioredoxin metabolism. Clin Cancer Res. 2011; 17:6206–6217.
40. Harris IS, Treloar AE, Inoue S, Sasaki M, Gorrini C, Lee KC, Yung KY, Brenner D, Knobbe-Thomsen CB, Cox MA, Elia A, Berger T, Cescon DW, et al. Glutathione and thioredoxin antioxidant pathways synergize to drive cancer initiation and progression. Cancer Cell. 2015; 27:211–222.
41. Huang H, Liao Y, Liu N, Hua X, Cai J, Yang C, Long H, Zhao C, Chen X, Lan X, Zang D, Wu J, Li X, et al. Two clinical drugs deubiquitinase inhibitor auranofin and aldehyde dehydrogenase inhibitor disulfiram trigger synergistic anti-tumor effects in vitro and in vivo. Oncotarget. 2016; 7:2796–2808. https://doi.org/10.18632/oncotarget.6425.
42. Lee JE, Kwon YJ, Baek HS, Ye DJ, Cho E, Choi HK, Oh KS, Chun YJ. Synergistic induction of apoptosis by combination treatment with mesupron and auranofin in human breast cancer cells. Arch Pharm Res. 2017; 40:746–759.
43. Neckers L, Workman P. Hsp90 molecular chaperone inhibitors: are we there yet? Clin Cancer Res. 2012; 18:64–76.
44. Eccles SA, Massey A, Raynaud FI, Sharp SY, Box G, Valenti M, Patterson L, de Haven Brandon A, Gowan S, Boxall F, Aherne W, Rowlands M, Hayes A, et al. NVP-AUY922: a novel heat shock protein 90 inhibitor active against xenograft tumor growth, angiogenesis, and metastasis. Cancer Res. 2008; 68:2850–2860.
45. Sessa C, Shapiro GI, Bhalla KN, Britten C, Jacks KS, Mita M, Papadimitrakopoulou V, Pluard T, Samuel TA, Akimov M, Quadt C, Fernandez-Ibarra C, Lu H, et al. First-in-human phase I dose-escalation study of the HSP90 inhibitor AUY922 in patients with advanced solid tumors. Clin Cancer Res. 2013; 19:3671–3680.
46. Ying W, Du Z, Sun L, Foley KP, Proia DA, Blackman RK, Zhou D, Inoue T, Tatsuta N, Sang J, Ye S, Acquaviva J, Ogawa LS, et al. Ganetespib, a unique triazolone-containing Hsp90 inhibitor, exhibits potent antitumor activity and a superior safety profile for cancer therapy. Mol Cancer Ther. 2012; 11:475–484.
47. Liu H, Xiao F, Serebriiskii IG, O’Brien SW, Maglaty MA, Astsaturov I, Litwin S, Martin LP, Proia DA, Golemis EA, Connolly DC. Network analysis identifies an HSP90-central hub susceptible in ovarian cancer. Clin Cancer Res. 2013; 19:5053–5067.
48. Jiao Y, Ou W, Meng F, Zhou H, Wang A. Targeting HSP90 in ovarian cancers with multiple receptor tyrosine kinase coactivation. Mol Cancer. 2011; 10:125.
49. Nagengast WB, de Korte MA, Oude Munnink TH, Timmer-Bosscha H, den Dunnen WF, Hollema H, de Jong JR, Jensen MR, Quadt C, Garcia-Echeverria C, van Dongen GA, Lub-de Hooge MN, Schroder CP, de Vries EG. 89Zr-bevacizumab PET of early antiangiogenic tumor response to treatment with HSP90 inhibitor NVP-AUY922. J Nucl Med. 2010; 51:761–767.
50. Chou TC. Drug combination studies and their synergy quantification using the chou-talalay method. Cancer Res. 2010; 70:440–446.
51. Khalil HS, Goltsov A, Langdon SP, Harrison DJ, Bown J, Deeni Y. Quantitative analysis of NRF2 pathway reveals key elements of the regulatory circuits underlying antioxidant response and proliferation of ovarian cancer cells. J Biotechnol. 2015; 202:12–30.
52. van der Wijst MG, Brown R, Rots MG. Nrf2, the master redox switch: the achilles’ heel of ovarian cancer? Biochim Biophys Acta. 2014; 1846:494–509.
53. Dai B, Yoo SY, Bartholomeusz G, Graham RA, Majidi M, Yan S, Meng J, Ji L, Coombes K, Minna JD, Fang B, Roth JA. KEAP1-dependent synthetic lethality induced by AKT and TXNRD1 inhibitors in lung cancer. Cancer Res. 2013; 73:5532–5543.
54. Kim NH, Oh MK, Park HJ, Kim IS. Auranofin, a gold(I)-containing antirheumatic compound, activates Keap1/Nrf2 signaling via Rac1/iNOS signal and mitogen-activated protein kinase activation. J Pharmacol Sci. 2010; 113:246–254.
55. Saggioro D, Rigobello MP, Paloschi L, Folda A, Moggach SA, Parsons S, Ronconi L, Fregona D, Bindoli A. Gold(III)-dithiocarbamato complexes induce cancer cell death triggered by thioredoxin redox system inhibition and activation of ERK pathway. Chem Biol. 2007; 14:1128–1139.
56. Powers MV, Clarke PA, Workman P. Dual targeting of HSC70 and HSP72 inhibits HSP90 function and induces tumor-specific apoptosis. Cancer Cell. 2008; 14:250–262.
57. Reinhold WC, Sunshine M, Liu H, Varma S, Kohn KW, Morris J, Doroshow J, Pommier Y. Cellminer: a web-based suite of genomic and pharmacologic tools to explore transcript and drug patterns in the NCI-60 cell line set. Cancer Res. 2012; 72:3499–3511.
58. Shankavaram UT, Varma S, Kane D, Sunshine M, Chary KK, Reinhold WC, Pommier Y, Weinstein JN. Cellminer: a relational database and query tool for the NCI-60 cancer cell lines. BMC Genomics. 2009; 10:277.
59. Weinstein JN, Collisson EA, Mills GB, Shaw KR, Ozenberger BA, Ellrott K, Shmulevich I, Sander C, Stuart JM, Cancer Genome Atlas Research Network. The cancer genome atlas pan-cancer analysis project. Nat Genet. 2013; 45:1113–1120.
60. Hoadley KA, Yau C, Wolf DM, Cherniack AD, Tamborero D, Ng S, Leiserson MD, Niu B, McLellan MD, Uzunangelov V, Zhang J, Kandoth C, Akbani R, et al. Multiplatform analysis of 12 cancer types reveals molecular classification within and across tissues of origin. Cell. 2014; 158:929–944.
61. Cline MS, Craft B, Swatloski T, Goldman M, Ma S, Haussler D, Zhu J. Exploring TCGA pan-cancer data at the UCSC cancer genomics browser. Sci Rep. 2013; 3:2652.
62. Samuel N, Hudson TJ. The molecular and cellular heterogeneity of pancreatic ductal adenocarcinoma. Nat Rev Gastroenterol Hepatol. 2012; 9:77–87.
63. Demetri GD, von Mehren M, Blanke CD, Van den Abbeele AD, Eisenberg B, Roberts PJ, Heinrich MC, Tuveson DA, Singer S, Janicek M, Fletcher JA, Silverman SG, Silberman SL, et al. Efficacy and safety of imatinib mesylate in advanced gastrointestinal stromal tumors. N Engl J Med. 2002; 347:472–480.
64. Savage DG, Antman KH. Imatinib mesylate--a new oral targeted therapy. N Engl J Med. 2002; 346:683–693.
65. Garnock-Jones KP, Keating GM, Scott LJ. Trastuzumab: a review of its use as adjuvant treatment in human epidermal growth factor receptor 2 (HER2)-positive early breast cancer. Drugs. 2010; 70:215–239.
66. Paul SM, Mytelka DS, Dunwiddie CT, Persinger CC, Munos BH, Lindborg SR, Schacht AL. How to improve R&D productivity: the pharmaceutical industry’s grand challenge. Nat Rev Drug Discov. 2010; 9:203–214.
67. Domcke S, Sinha R, Levine DA, Sander C, Schultz N. Evaluating cell lines as tumour models by comparison of genomic profiles. Nat Commun. 2013; 4:2126.
68. Pessetto ZY, Ma Y, Hirst JJ, von Mehren M, Weir SJ, Godwin AK. Drug repurposing identifies a synergistic combination therapy with imatinib mesylate for gastrointestinal stromal tumor. Mol Cancer Ther. 2014; 13:2276–2287.
69. Pessetto ZY, Chen B, Alturkmani H, Hyter S, Flynn CA, Baltezor M, Ma Y, Rosenthal HG, Neville KA, Weir SJ, Butte AJ, Godwin AK. In silico and in vitro drug screening identifies new therapeutic approaches for ewing sarcoma. Oncotarget. 2017; 8:4079–4095. https://doi.org/10.18632/oncotarget.13385.
70. Jatoi A, Grudem ME, Dockter TJ, Block MS, Villasboas JC, Tan A, Deering E, Kasi PM, Mansfield AS, Botero JP, Okuno SH, Smith DR, Fields AP. A proof-of-concept trial of protein kinase C iota inhibition with auranofin for the paclitaxel-induced acute pain syndrome. Support Care Cancer. 2017; 25:833–838.
71. Pathak HB, Zhou Y, Sethi G, Hirst J, Schilder RJ, Golemis EA, Godwin AK. A synthetic lethality screen using a focused siRNA library to identify sensitizers to dasatinib therapy for the treatment of epithelial ovarian cancer. PLoS One. 2015; 10:e0144126.
72. Do TV, Hirst J, Hyter S, Roby KF, Godwin AK. Aurora a kinase regulates non-homologous end-joining and poly(ADP-ribose) polymerase function in ovarian carcinoma cells. Oncotarget. 2017; 8:50376–50392. https://doi.org/10.18632/oncotarget.18970.
73. Kast RE, Boockvar JA, Bruning A, Cappello F, Chang WW, Cvek B, Dou QP, Duenas-Gonzalez A, Efferth T, Focosi D, Ghaffari SH, Karpel-Massler G, Ketola K, et al. A conceptually new treatment approach for relapsed glioblastoma: coordinated undermining of survival paths with nine repurposed drugs (CUSP9) by the international initiative for accelerated improvement of glioblastoma care. Oncotarget. 2013; 4:502–530. https://doi.org/10.18632/oncotarget.969.
74. Tothill RW, Tinker AV, George J, Brown R, Fox SB, Lade S, Johnson DS, Trivett MK, Etemadmoghadam D, Locandro B, Traficante N, Fereday S, Hung JA, et al. Novel molecular subtypes of serous and endometrioid ovarian cancer linked to clinical outcome. Clin Cancer Res. 2008; 14:5198–5208.
75. Byron SA, Van Keuren-Jensen KR, Engelthaler DM, Carpten JD, Craig DW. Translating RNA sequencing into clinical diagnostics: opportunities and challenges. Nat Rev Genet. 2016; 17:257–271.
76. Kimmerling RJ, Lee Szeto G, Li JW, Genshaft AS, Kazer SW, Payer KR, de Riba Borrajo J, Blainey PC, Irvine DJ, Shalek AK, Manalis SR. A microfluidic platform enabling single-cell RNA-seq of multigenerational lineages. Nat Commun. 2016; 7:10220.
77. Shao H, Chung J, Lee K, Balaj L, Min C, Carter BS, Hochberg FH, Breakefield XO, Lee H, Weissleder R. Chip-based analysis of exosomal mRNA mediating drug resistance in glioblastoma. Nat Commun. 2015; 6:6999.
78. Xu X, Huang L, Hei Chan C, Yu T, Miao R, Liu C. Assessing the clinical utility of genomic expression data across human cancers. Oncotarget. 2016; 7:45926–45936. https://doi.org/10.18632/oncotarget.10002.
79. Huarte M. The emerging role of lncRNAs in cancer. Nat Med. 2015; 21:1253–1261.
80. Zhou M, Sun Y, Sun Y, Xu W, Zhang Z, Zhao H, Zhong Z, Sun J. Comprehensive analysis of lncRNA expression profiles reveals a novel lncRNA signature to discriminate nonequivalent outcomes in patients with ovarian cancer. Oncotarget. 2016; 7:32433–32448. https://doi.org/10.18632/oncotarget.10002.
81. Yang K, Hou Y, Li A, Li Z, Wang W, Xie H, Rong Z, Lou G, Li K. Identification of a six-lncRNA signature associated with recurrence of ovarian cancer. Sci Rep. 2017; 7:752.
82. Luo P, Liu XF, Wang YC, Li ND, Liao SJ, Yu MX, Liang CZ, Tu JC. Prognostic value of abnormally expressed lncRNAs in ovarian carcinoma: a systematic review and meta-analysis. Oncotarget. 2017; 8:23927–23936. https://doi.org/10.18632/oncotarget.14760.
83. Fogh J, Trempe G. (1975). New human tumor cell lines. Human tumor cells in vitro: Springer US, pp. 115–159.
84. Godwin AK, Meister A, O’Dwyer PJ, Huang CS, Hamilton TC, Anderson ME. High resistance to cisplatin in human ovarian cancer cell lines is associated with marked increase of glutathione synthesis. Proc Natl Acad Sci U S A. 1992; 89:3070–3074.
85. Chou TC, Talalay P. Quantitative analysis of dose-effect relationships: the combined effects of multiple drugs or enzyme inhibitors. Adv Enzyme Regul. 1984; 22:27–55.