
Introduction
Novel disease targets are necessary so as to improve acute myeloid leukemia (AML) patient outcomes, and epigenetic pathways are a focus.[1-3] We identified an oncogenic (Flt3ITD) pathway to epigenetic repression for the tumor suppressor DAPK1, by interaction of p52NF-κB and histone deacetylases (HDACs) on the promoter.[4] Suboptimal efficacy of single Flt3-selective tyrosine kinase inhibitors (TKI) is thought to involve such epigenetic collaboration.[4-6]
Wnt antagonist RUNX3 is a consequential epigenetically-repressed tumor suppressor gene in AML, especially normal karyotype (+/-Flt3ITD).[6-8] By such RUNX3 repression, its function in interruption of Wnt/β-catenin/TCF4-mediated transcription is prevented,[9] which allows β-catenin to promote leukemia stem cells,[10] by affecting HOXA10/9/CDX4 transcription.[11] RUNX3 was a prominent methylation-sensitive repression target of dual Flt3ITD/TET2 mutations in a murine AML model, and was repressed alongside BCL11b, another Wnt-β-catenin antagonist.[6] ID1 hyperexpression was also prominent in the signature along with HOXA9, and Id1 has been demonstrated a Wnt agonist.[6, 12]
Poor-risk AML phenotypes, including Flt3ITD+ve, also express transcriptionally-active phospho-c-jun, affecting distinct gene activation.[13-18] C-jun acts with Stat5, in activation of transcriptional targets PIM1, relB, and MEIS1 (a prognostic gene functioning in leukemic stem cells).[15, 17, 18] Further, c-jun and β-catenin, reciprocally and cooperatively, bind the others promoter consensus, thus conveying cooperative transactivation, involving TCF4 elements such as regulate HOXAs.[11, 19, 20]
If not prevented by an epigenetic influence, the AP-1 family of proteins can also block cell cycle and promote senescence and apoptosis through transcriptional up-regulation of both DAPK1 and RUNX3, as well as p16INK4A/CDKN2A.[4, 7, 21, 22] Epigenetically repressed p16INK4A/CDKN2A promotes leukemia stem cell upregulation,[23] which is observed in normal karyotype Flt3ITD+ve and complex karyotype AMLs.[23] However, p16INK4A/CDKN2A repression is not observed in good-risk [eg. core-binding factor-associated (CBF+ve)] AMLs.[23-25]
We considered these tandem repressed tumor suppressor genes as candidates, among a group of prognostic genes, to form a signature for poor-risk AML vulnerable to an epigenetic targeting agent combination. We chose the Flt3/raf-selective tyrosine kinase inhibitor, Sorafenib, along with HDAC inhibitor, Vorinostat, given together as a doublet, or, additionally, in combination with epigenetically-active Bortezomib.[26-28]
We postulated that reversal, early during therapy, of such a blast cell gene expression signature, may predict an emerging remission, and may reflect an epigenetic reprogramming of poor-risk/refractory AML toward enhanced sensitivity, associated with non-expression of HOXA, which mimics core-binding factor translocation-associated (CBF+ve) AML.[29]
While demonstrating the safety of two consecutive regimens, we compared the response rates and depth, as well as mechanistic attributes regulating responses. We found mechanistic signatures regulating achievement of remissions were uniform, but that Bortezomib addition had a dramatic impact on depth and rapidity of responses in Flt3ITD+ve, where early reversal of gene expression signature was predictive.
Results
Response
Patient characteristics are summarized in Supplementary Information: Supplementary Tables 1-2. A total of 15 patients were enrolled in trial 1 with intent to treat (Supplementary Table 1). In the second trial, 18 patients were enrolled (Supplementary Table 2).
With the first cycle of treatment in trial 1 (Sor/Vor), six/fourteen (43%) patients demonstrated partial remission (PR) and 1/14 (7%) achieved a complete remission (CR) (Supplemental Table 1). The patient (#8) with complex karyotype who achieved a CR with one treatment cycle remained disease-free for 5 months (Supplementary Table 1).
Three/six very good partial responders (# 5, 7, 14) and one marrow inevaluable patient (#9) had Flt3-ITD, with pre-treatment peripheral absolute blast counts as high as 50,000-85,000/uL, and all demonstrated complete clearance of peripheral blood blasts within 1 week of initiation of treatment (Supplementary Table 1). Following completion of 2 cycles, one responder in this group had reduction of marrow blasts to 10% accomanying a profound reduction of background cellularity.
Responses in the second trial (Sor/Vor/Bor), were generally more rapid, and complete morphologic eradication of blast cells occurred by 1-2 cycles in a significant fraction of patients with Flt3ITD, irrespective of the dose level beyond the run-in dosing of cohort 1-where suboptimal Sorafenib was used to ensure safety (Supplementary Table 2). CR rate approximated 59% in that optimal Sorafenib dosing group (Supplementary Table 2).
Initial gene expression analysis defines repressed tumor suppressor signature in AML blasts
Poor prognosis occurs in AML patients whose blasts exhibit repressed expressions of p16INK4A/CDKN2A and DAPK1, on a background of HOXA9/MEIS1 over-expression (HS Boswell, unpublished data).[4, 23] These features coincide with ID1 hyperexpression, which overlaps with these repressed genes, and repressed RUNX3.[30] Therefore, we performed focused gene expression analysis on available pretreatment blasts from patients on the first trial, as test cohort (Figure 1).
Compared with the good-risk (CBF+ve) gene expression control panel, where p16INK4A/CDKN2A is not repressed [23] (Figure 1; data not shown), all these patients’ blasts demonstrated strong over-expression of HOXA9/MEIS1 on the heat-map, accompanying CDKN2A repression. In addition, ID1 hyper-expression was noted in a subgroup of patients (#6, 7, 8, 11, 13, and 14), where its hyper-expression overlapped with repressed CDKN2A/DAPK1, and in most cases, repressed RUNX3 (Figure 1).
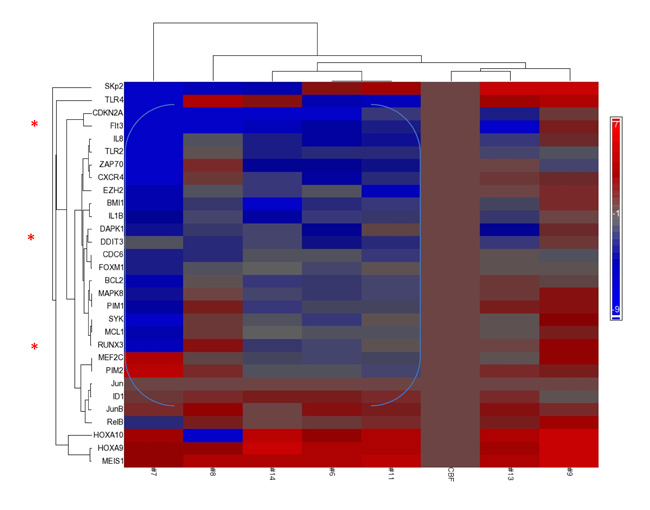
Figure 1: Repression of Tumor Suppressor genes accompanies overexpression of HOXA/MEIS1. Focused GSA (gene set array) expression profile prior to therapy (day 0) of patients treated on first (IUCRO-0234) protocol identifies a group with repression of DAPK1/CDKN2A/RUNX3 and co-existing ID1 hyperexpression (note blue bracket) as compared with a control CBF+ve AML with good prognosis. Presented on the horizontal axis, left-to-right, are patients # 7, 8, 14, 6, 11, CBF+ve control, 13, and 9, respectively. Patient #5 had insufficient blast content to perform gene expression analysis prior to therapy, but upon discontinuation of protocol therapy, with disease progression, demonstrated the same phenotype of repression as the bracketed group (data not shown).
In trial 1, Sorafenib/Vorinostat promoted changes in Flt3ITD+ve blasts for expression of genes and effector proteins leading to ER stress apoptosis
Because of the slower/lower depth of/ response to the initial regimen (Sor/Vor), an association of changes between gene expression with phosphoprotein signaling intermediates upstream was possible. Immunoblot analysis was performed on pre-treatment blasts with sufficient content: normal karyotype Flt3-ITD+ve patients #7 vs. #9, which accurately demonstrated the heterogeneity expected for activity and subcellular localization of phospho-intermediates based on the gene expression analysis (Figure 2a vs. Figure 1).
Upon initiation of therapy in patient #7 at day #3, where the marrow was still replete with blasts, strong reductions within lysates of nuclear phospho-c-jun (70% reduction by densitometry: Figure 2a and 2d), p52NF-κB (70% reduction: Figure 2a and 2d), and phospho-stat5 (80% reduction: Figure 2c) occurred, and re-localization of stat5 and p52 NF-κB into the inactive cytoplasmic pool was observed (Figure 2a and 2c). However, neither DAPK1 nor CDKN2A mRNAs were de-repressed (Figure 2e); nevertheless, the multi-responsive p52NF-κB/stat5/c-jun-dependent PIM1 and PIM2 genes were diminished (p<0.08 and *p<0.05, respectively), and the stat5/c-jun-dependent ID1 transcripts were reduced by almost 2 logs (Figure 2e, ***p<0.0002). [A day 3 protein analyte was not available from patient #9.] We also observed relocalization of Flt3 to a surface/inactive pool, associated with manifestations expected of ER stress apoptosis upon PIM kinase loss (and 4EBP1 reregulation) in patient #7 lysates [31] (Figure 2b).
The genes whose expression was most significantly decreased in the early-phase of therapy in the marrow blasts of patient #7 were JUN, MEIS1 and ID1 (***p< 0.00002, ***p<0.00003, and ***p<0.0002, respectively) (Figure 2e). Interestingly, the strong reduction of peripheral blood and bone marrow blasts that followed (Supplementary Table 1) was also preceded by sharp HOXA9/10 downregulation in day #3 blasts (**p<0.05, ***p<0.005, respectively) (Figure 2e). RUNX3 (not shown) was not de-repressed in this patient’s blasts, perhaps because c-jun/JUN (a transactivator of RUNX3, DAPK1, and HOXA10) was so strongly expressed initially, and then extinguished by treatment.
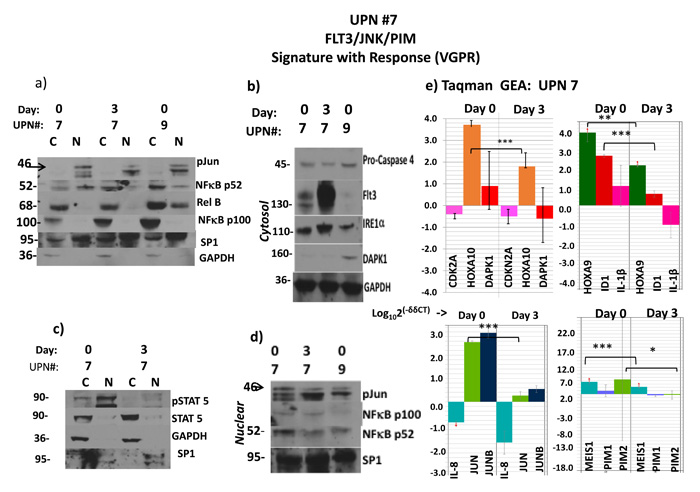
Figure 2: Flt3ITD AML responds to Sor/Vor with strong downmodulation of HOXA’s and MEIS1 accompanying profile of ER stress apoptosis. Activity by starting levels: intranuclear p52 NFkB in #7 and #9, 59% and 26%, respectively; phospho-stat5, 78% in #7. These corresponded to higher level of immuno-detected p-jun in #7 and also a lower DAPK1 protein in #7, which would be expected of a cause-and-effect relationship with p52 NFkB- a known DAPK1 repressor. (a to d) Sorafenib and vorinostat-induced remission in patient #7 is associated with induction of ER stress apoptosis pathway (Flt3 relocalization, elevated IRE1α, cleavage (70% densitometric) of procaspase 4) despite failure to upregulate low-level expression of DAPK1. However, both p52NFkB and phospho-stat5, which also drive transcriptional expression of PIM1/2 were severely depleted, leading to an alternative route to ER stress apoptosis. C stands for cytosolic fraction and N stands for nuclear fraction. Molecular weights in the immunoblots are indicated. (e) The remission in patient #7 was also associated with severe reduction of JUN and ID1 transcripts, as well as MEIS1 and PIM2 transcripts, and significant depletion of HOXA10/9 transcripts. However, CDKN2A transcripts were not augmented in this case. Molecular weights in the immunoblots are indicated.
Normal karyotype Flt3ITD+ve patient #14, whose blast gene expression heat-map similarly revealed the triple-repressed tumor suppressor gene signature noted above (Figure 1), was pharmacodynamically monitored with therapy, which demonstrated a different mechanistic complement and a distinct route to an ER stress apoptotic outcome in blasts, independent of PIMs (Figure 3). A dramatic response to Sor/Vor therapy ensued (Supplementary Table 1). Pre-treatment marrow blasts demonstrated significant, but more limiting, intranuclear levels (vs. #7 (Figure 2)) of phospho-stat5 and p52NF-κB (Figure 3a, left panel). At treatment day #4, nuclear lysates of blasts revealed total loss of p-stat5, and significant reduction of p52NF-κB (65% reduction by densitometry). This occurred in the setting of 5-fold up-regulation of DAPK1 transcripts by real-time qRT-PCR (*p<0.04) and stable DAPK1 protein levels, along with 3-fold up-regulation of CHOP (Figure 3a, left panel). Expected ER stress apoptosis evolution in blasts was further evidenced by Caspase 4 cleavage (>80% by densitometry) (Figure 3a, right panel). Indeed, this apoptotic process occurred in the absence of downregulation for PIMs, whose starting expression was quite low in context of low starting levels of p-jun and p52NF-κB vs. patient #7 (Figure 2 and data not shown).
In addition, the starting expression of HOXA’s was much lower here, in keeping with modest levels of JUN (<200-fold less JUN than patient #7) as driver, affecting an absent p-jun band visible by immunoblot (data not shown). The 8-fold up-regulation of RUNX3 transcripts observed by real-time qRT-PCR (**p<0.006) (Figure 3b) was not associated with any change in putative target. There was derepression in CDKN2A transcripts of borderline significance (p=0.07), and no change in ID1 expression (Figure 3b; and data not shown).
Thus, the mechanism to effect apoptosis in these Flt3ITD+ blasts was distinct from those Flt3ITD+ blasts patient #7, and the de-repression of DAPK1 observed here appears to result from the inhibition of the repressive influence of p52NF-κB with HDACs.[4]
On the other hand, patient #6 without Flt3ITD, enrolled into dose-level 2 with optimal Sorafenib dosing and proven Vorinostat pharmacodynamics,[32] did not respond (Supplementary Table 1). We found failure to reduce baseline nuclear p52NF-κB levels, rising p65NF-κB levels, and rising, extremely high HOXA9/MEIS1 at day 4 (data not shown), supporting the importance of the predictive findings.
Evidence for activity of the Sor/Vor drug combination was also present among cases with complex/poor-risk cytogenetics (Supplementary Table 1), where CDKN2A repression is well described.[23, 33] Pretreatment blasts patient #8 demonstrated strong CDKN2A repression and ID1 hyperexpression (Figure 1), and early with therapy an early 3-fold log-reduction of ID1 transcripts (**p<0.01) and an elevation of CDKN2A transcripts of at least 2-logarithms (***p<0.003) occurred (data not shown).
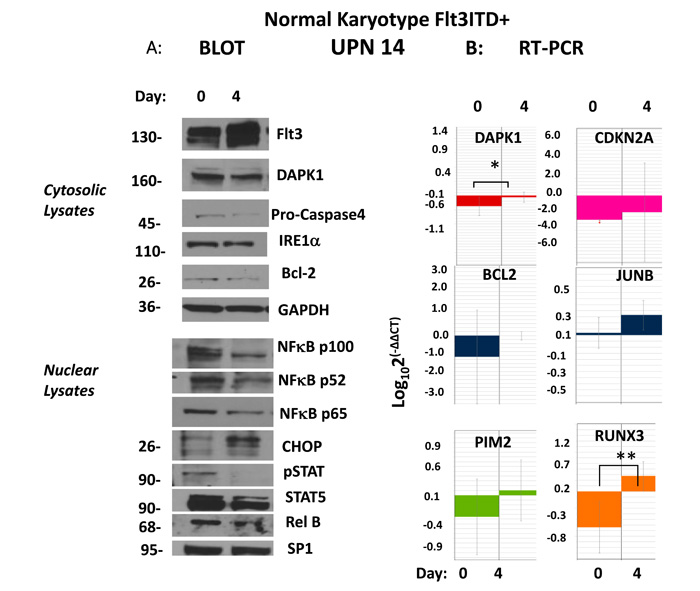
Figure 3: Upregulation of DAPK1/RUNX3/CDKN2A presages remission following evolution of ER stress apoptosis. (a) A patient with normal karyotype, Flt3ITD (#14) at pretreatment evaluation demonstrated by immunoblot strong activation of phospho-active stat5 and p52NFkB as well as having strong repression (compared to CBF+ve control AML) CDKN2A, and DAPK1, as well as lesser repression of RUNX3. Early evidence for evolving remission after 3 days demonstrated by immunoblot involved strong upregulation of CHOP, cleavage of caspase 4 (80% densitometric) evidencing ER stress apoptosis occuring in context of strong depletion of stat5/p52NFkB activation. Molecular weights in the immunoblots are indicated. (b) In addition, upregulation of transcripts for DAPK1, CDKN2A and RUNX3 were demonstrated.
Dramatic increase occurs in depth and rapidity of responses in Flt3ITD+ve disease by addition of Bortezomib, involving ID1/RUNX3/HOXA axis.
In the second trial including Bortezomib, responses were seen beginning at cohort 2 (which involved resumption of Sorafenib at efficacious single-agent dosing and schedule) (Supplementary Table 2). These responses demonstrated no association to level of Bortezmib escalation in dose or schedule. Nor did responses relate to resumption of the full schedule of Vorinostat, as achieved in the prior protocol (Supplementary Tables 1, 2). However, responses were limited to Flt3ITD+ve patients (Supplementary Table 2).
Eradication of peripheral blasts was hastened, and marrow cellularity at day 4 was too limiting to allow immunoblotting analyses. However, gene expression from marrow blasts (day0/4) was quite informative, and relayed the previous trends, particularly in the HOXA/RUNX3/ID1 axis (Figure 4).
Among patients in cohort 2 (dose-level 1) (Supplementary Table 2), strong HOXA9 and HOXA10 expressions in the pretreatment blasts were sharply log-reduced or extinguished early into therapy at day 4, when a subsequent CRi later evolved (HOXA9: patient #5, **p<0.01; patient #6, *p<0.05; HOXA10: pt#5, *p<0.05, pt#6, **p<0.01) (Figure 4). On the other hand, no such reductions occurred in non-responding patients, or in patient #12 with a PR achieved with the 1st cycle that did not improve with cycle #2 (Figure 4a). In the CRi responders (#13 and #17) in cohorts 4 and 5, HOXA expression and MEIS1 expression were limiting to begin with (Figure 4a), perhaps related to the much lower c-jun activity capable of driving HOXAs/MEIS1 than in the aforementioned cases, similar to the situation that obtained with patient #14 in trial 1 (Supplementary Table 1, Figure 3).
In the CRi responders, response was heralded in blasts by early sharp downregulation of ID1 (pt #5, ***p<0.005; pt #6,**p<0.005; pt# 13, **p<0.005, pt# 17, *p<0.05) (Figure 4b). In all of the blasts of CR/CRi responders, including the CR from the first trial (5/5), ID1 was sharply downregulated early by therapy (Figure 4b and Supplementary Table 3) (p<0.002 compared with PR/nonresponders). In all but two of patients with CR/CRi/VGPR achieved across both trials, early RUNX3 upregulation in blasts (5/7) was associated with that response (Figure 4b, Figures 2-4, Supplementary Table 3), and in those outlier cases, sharp downregulation of JUN/cjun, a HOX/MEIS1 transactivator, occurred as an alternate route to the endpoint (#7, trial 1, #6, trial 2[data not shown]). In the latter example (trial 2, patient #6), absent RUNX3 upregulation, PIM1 downregulation as well as ID1 downregulation was noted in association with response (Figure 4). None of the patients’ blasts attaining CRi in the second trial demonstrated significant CDKN2A upregulation, whereas both the VGPR#14 and CR#8 in trial #1, upregulation of CDKN2A occurred (Supplementary Table 3).
Induced ID1 hypo-expression occurred in 4/4 CR/CRi’s and 5/6 VGPR/CR/CRi and was associated with both RUNX3 de-repression/upregulation, HOXA diminution and CDKN2A de-repression. However, absent VGPR/CR/CRi, ID1 depletion did not occur (p<0.002).
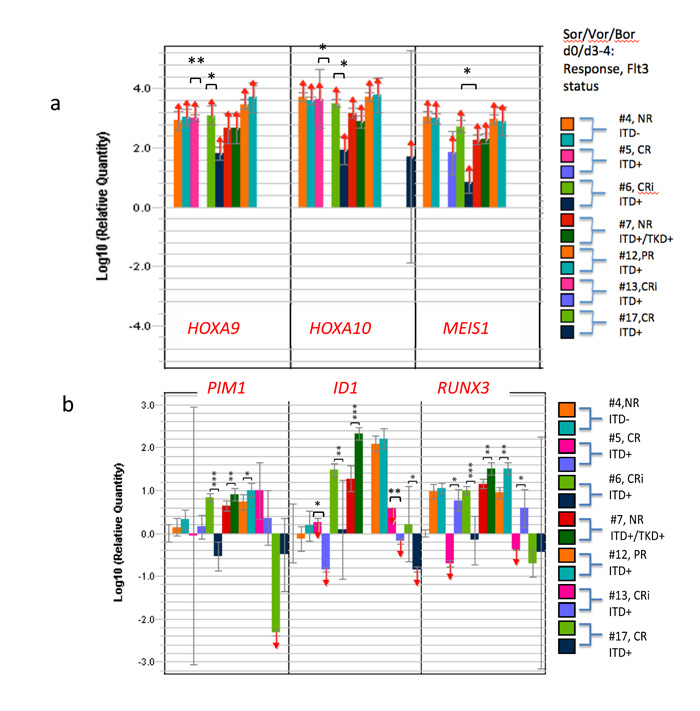
Figure 4: Coupling of RUNX3 upregulation and/or ID1 downregulation along with HOXA reductions early after Sor/Vor/Bor leading to remissions. Transcriptional changes induced by combination of Sor/Vor/Bor regimen in patients, comparing pretreatment marrow blasts with day3/4. Patient #5 had total reduction of ID1 transcripts and significant upregulation of RUNX3 following initiation of therapy. The same outcome was seen in patient #13. Patient #6 had severe reduction of PIM1 as well as ID1 transcripts upon initiation of therapy. The most common result for responses was severe depletion of ID1 and upregulation of RUNX3, associated with HOXA9/10 depletion. TET2 transcript hypomorphy was strongly associated with these outcomes (Supplementary Table 3).
Vulnerability of Flt3ITD+ve AML with TET2 loss and heightened HOXA’s
Haploinsufficient mutations of TET2 gene, as well as miRNAs targeting 5’-3’ destruction of its mRNA, affect epigenetic functions.[34-36] In either case, functional transcript reduction ≥35% yields a hypomorphic phenotype; affecting repression of Wnt pathway antagonists, which are WT1 target genes. [1, 6, 13, 25, 37, 38] Poor clinical outcomes result.[39]
We postulated poor outcome might be linked to RUNX3 repression, in part, through heightened HOXA signaling (as consequence of unrestrained β-catenin[9]). Available blast cells from our two trials were analyzed for existence of truncated/mutant TET2 mRNAs (failed elongation/detection occurs with common nonsense/frameshift mutation) as well as reduction of complete transcripts by antagonistic miRNA’s (Figure 5, Supplementary Table 3). We stratified samples in comparison to the same CBF+ve controls as before (because TET2 mutation is not associated with inv(16) CBF AML:(4) TCGA database <2%), and placed a distinction between samples with more or less than 65% of the high-expressor controls for TET2 transcripts to distinguish a hypomorphic phenotype.
TET2 transcript deficiency of starting blasts signaled enhanced activity of the combinations, especially Sor/Vor/Bor (Figure 5). This was noted by severe reduction (or ablation) of the 3’/5’ transcript ratio (corresponding mutation) in the pretreatment blasts of majority responders, especially in the second trial (Figure 5). Proper assignment was confirmed with independent primers in the TaqMan plate (data not shown). In addition, preexisting blast TET2 hypomorphy most commonly associated with RUNX3 derepression upon initiation of therapy (Supplementary Table 3). Among 15 samples across both trials available for multigene molecular analysis, early relief of RUNX3 repression occurred in 8/10 responders (5/7 CR/CRi/VGPR), whereas 2/3 non-responders with samples available for analysis failed to demonstrate RUNX3 de-repression (p=0.03, Chi square).
RUNX3 de-repression and/or JUN/c-jun downregulation was linked to early treatment-induced diminution of HOXA9/10 expression in blasts and subsequent hematologic response (Supplementary Table 3). As noted above, this was also associated with early ID1 hypo-expression, while induced along with HOXA diminution. Thus, a pathway of epigenetic repression was alleviated by the combination therapy involving signature ID1-TET2-RUNX3, and HOXA depletion was linked to modulation of this pathway and JUN/c-jun.
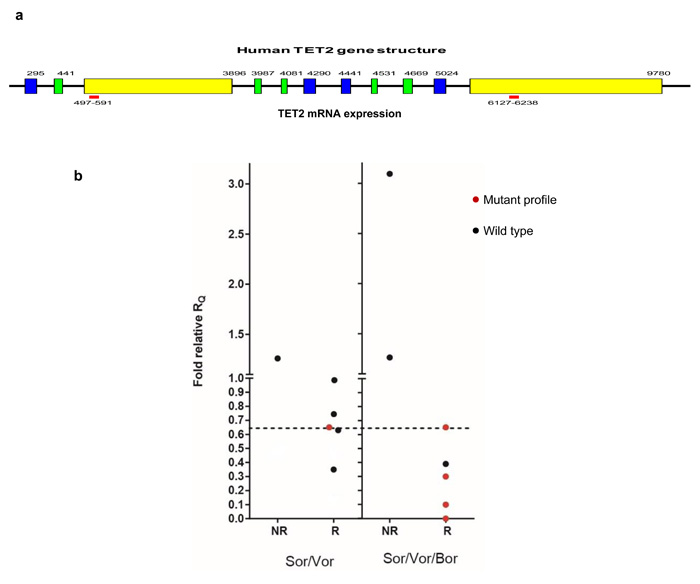
Figure 5: Mutant TET2 marks response to Sor/Vor or Sor/Vor/Bor. TET2 transcript relative quantity was plotted in comparison to CBF+ve control for the two trials, distinguishing responders vs. nonresponders. Mutant transcript profile was defined as quantity of 3’/5’ transcript quantity equal to or less than 0.65x control, whereas non-mutant transcript quantities were defined based on conventional detection methods.
Discussion
AML relapse/resistance after therapy may be epigenetically determined. Mutant epigenetic modifiers that may persist in remission and contribute to relapse are mDNMT3A, mASXL1, mTET2. As a consequence, at least in the first two genes, hypomethylation on HOXA alleles, and resultant HOXA hyperexpression occurs.[40-42] By contrast, good risk CBF +ve AMLs, which display highly durable induction/consolidation chemotherapy outcomes, display severe HOXA/B hypoexpression within bulk and CD34+ cells, in association with leukemic stem cell content of limited depth.[24, 29] Thus, modulation of chemosensitivity may require diminution of the chemoresistance effector and LSC driving factor HOXA9. [11, 24, 43]
Here, we investigated the impact of TET2 hypomorphy on a putative pathway to affect unrestrained HOXA overexpression, which may be a consequence of repression in RUNX3- an inhibitor of HOXA driver β-catenin. We postulated AMLs with this signature might be affected by an epigenetically-active targeting combination given to patients. In addition, we postulated recognized positive regulators of the pathway to HOXAs: c-jun and Id1, may be sensitive to the combination.[11, 19, 20]
Combined administration of Sorafenib and Vorinostat, especially along with Bortezomib, induced rapid and deep remissions in patients Flt3ITD+ve, commonly characterized by early limitation of blast HOXA’s expression. Such induced remissions were accompanied in 80% cases with upregulation of repressed RUNX3, and were also strictly linked to ID1 downregulation. Reversal of the epigenetic signature by the targeting combination appears to signal mutual involvement of members in leukemic genesis as observed in a mouse model,[6] and signature reversal was a descriptor of subsequent remission. However, because RNAseq and/or protein interaction studies were not performed here, conclusive assignment of a direct converging pathway cannot be made.
Introduction of Bortezomib within the regimen sharply increased rapidity and depth of response to the combination in Flt3ITD+ve cases, and Bortezomib has demonstrated effect on transcriptional and posttranscriptional inactivation of Flt3.[26-28] Bortezomib was also found by others to downregulate HOXA9 in human Flt3ITD AML cells, while sensitizing the cells to chemotherapies and TKIs, which involved an induced repression of HOXA9, by rescue from proteasomal destruction of histone H3 K27 methylator- EZH2, the enzymatic effector of polycomb repressive complex 2.[43] In the Flt3ITD+ve cohort treated with the Bortezomib combination, there were insufficient blast cells at day ¾ to address these issues fully, as a direct result of the activity of the combination. However, we previously tested Bortezomib with and without TKI in vitro on other genotypically similar Flt3ITD+ve AMLs, and demonstrated sharp Flt3 protein loss within cell lysates with short treatment. On the other hand, in our trial we did analyze EZH2 mRNA before and at day ¾ of treatment in situ without a clear predictive level of EZH2 transcripts at these timepoints for determining subsequent response.
Thus, Sor/Vor/Bor is a novel combination with promise for priming poor-risk AMLs with this gene expression signature, particularly Flt3ITD+ve with TET2 mutation, for subsequent therapeutic sensitization (Supplementary Table 3). Indeed, the capacity for this regimen to be a bridge-to-transplant with prolonged subsequent disease-free survival was demonstrated, and additionally another patient with reversal of this gene signature anticipating the induced remission, had a 5-month unmaintained remission.
We found no evidence for an influence on responsiveness for one accompanying gene mutation frequently occurring with Flt3ITD: mutant NPM1 (data not shown). Recently, patient blasts, documented by NGS as bearing complements of Flt3ITD with IDH2/WT1/TET2/DNMT3A mutations (when alone or in mutually nonexclusive pairs), were also tested in vitro for proliferative silencing /apoptosis by Bortezomib with Flt3 inhibitor, and we found efficacy and synergy of the combination in these mutational binary- or ternary-defined subgroups in Flt3ITD+ve AML (HS Boswell, in preparation). In fact, because of the strict association at diagnosis, and stability upon relapse, of essentially all Flt3mutant AML’s with accompanying epigenetic mutations within IDH2/TET2/WT1 pathway or, additionally, with DNMT3A or ASXL1 mutations, this regimen, or a very similar one, may have broad applicability for sensitivity “priming” [43, 44].
Our study performed in-depth examination of the early changed protein/gene signature achieved in situ within blast cells toward crucial downstream effectors, which revealed significant differences from the mechanism anticipated from Flt3-selective TKI alone. [4, 45, 46] Our data demonstrated, for at least Flt3ITD+ve/TET2mut/hypomorphic AML, a more complex and cooperative remission-inducing mitigation, by epigenetic combinations causing de-repression/upregulation of Wnt antagonist RUNX3, and affecting severe ID1 and JUN/c-jun depletion, which were associated with HOXA depletion.[6, 9, 12, 20] By contrast, mechanistic linkage to CDKN2A/DAPK1 de-repression was infrequent.
Patients and Methods
Patient selection
In the first trial, all adult patients with a diagnosis of relapsed or refractory AML, and those older than 70 with newly diagnosed disease, were eligible upon informed consent (Supplemental Information), adequate performance status and hepatic/renal function. In the second trial (Supp. Inf.), patient selection was restricted to Flt3ITD+ve, or complex karyotype or monosomy 5/7, from relapsed/refractory patients across the age spectrum, or additionally, from newly diagnosed elderly. All patients had a baseline bone marrow aspiration for staging/diagnosis and pharmacodynamic studies (baseline) as well as cytogenetics and Flt3 mutation analysis.
Trial designs and treatment
A conventional 3+3 dose-escalation schedule was followed with 3-6 patients per cohort. The dose-escalation schemes for trial 1 are noted under Supplementary Table 1. Sorafenib was given orally at a dose of 400 mg twice daily, and oral vorinostat was given with dose escalation in successive cohorts. Each cycle consisted of 14 days of treatment followed by 7 days of break, 21 days total. A bone marrow exam for response evaluation was performed on day 15 of each cycle. Response was assessed as reported by Cheson.[47] Patients who achieved at least 50% reduction of bone marrow blasts to 5-25%, but not a complete morphologic remission, were eligible to receive the second cycle. Patients, who achieved at least 10% reduction of bone marrow blasts, but not a complete remission with the second cycle, were eligible for a third cycle. Patients received a maximum of 3 cycles in this first trial. No further treatment would be given beyond a complete remission (CR). The dose-limiting toxicity (DLT) was defined as any grade 3 or 4 non-hematologic toxicity using the National Cancer Institute NCI’s Common Terminology Criteria for Adverse Events (CTCAEv3.0).
In the second trial a similar 3+3 design was used (Supplementary Table 2), but the initial schedule involved dose-reduction of Sorafenib to 200mg po bid to avoid possible toxicity associated with addition of a third drug-Bortezomib. This dose level assigned within cohort 1 was deemed run-in (-1) dosing. Also, dosing with Vorinostat was initially reduced in schedule, but not in dose, from optimal schedule in protocol I, to days 1-4, and 8-12, to avoid potential toxicities associated with initiation of the 3rd drug-Bortezomib. No such toxicities were observed, and a 5th dosing level including Sorafenib and Vorinostat, at the full schedule from the first trial, were still compatible with the optimal dose-schedule of Bortezomib (Supplementary Table 2).
Cells
Bone marrow blast cells were obtained from patients within 7 days prior to treatment and at the end of 3-4 days of therapy, and processed as previously described.[4]
Real-time RT PCR analysis in a focused gene-set array panel
This was as described.[4] qRT-PCR for 30 AML related genes and one housekeeping gene were performed at low-density array (LDA) format according to the manufacturer’s protocol (TaqMan Gene Expression Micro Fluidic card, 4346799, Applied Biosystems/Life Technologies). 18S rRNA was chosen from TaqMan Human Endogenous Control Plate (Applied Biosystems) as internal control. Relative expression was calculated using RQ manager Ver 1.2 (Applied Biosystems) using one-patient volunteer as a calibrator sample (fusion core-binding factor-positive (CBF+ve[inv(16)]), negative for Flt3ITD, and very low c-jun and Meis-1 expression). In addition, the CBF+ve control had high expression of TET2 mRNA, as expected based on the rarity of TET2 mutation within this good-risk AML subgroup (see below). Copy number or fold-change in expression was calculated using the 2-∆∆Ct method.[48] For initial definition of a tumor suppressor gene “repression cohort” among the group of patients accrued to the trial with intention-to-treat, baseline expression data of 29 test genes was normalized to expression of c-jun, which is a known trans-activator of the core tumor suppressor target gene cohort (CDKN2A, DAPK1, RUNX3), and MEIS1.[4] Data were conveyed into heat-map format reporting ∆CT values and statistical analysis was applied to these values, using 18S RNA as control value.
Real-time RT-PCR analysis of TET2 expression
Two real-time PCR primer pairs were designed to amplify the 5’ (497-591bp) and 3’ (6127-6238bp) part of human TET2 mRNA respectively. The sequences are: TET2-5’ forward: 5-GATAGAACCAACCATGTTGAGGG, TET2-5’ reverse: 5-TGGAGCTTTGTAGCCAGAGGT, TET2-3’ forward: 5-GCATGCCACAACCCCTTTAA and TET2-3’ reverse: 5-CCAAAGAGCCAAGCCATGTT. Expression of the 5’ and 3’ part of TET2 mRNA was first normalized by GAPDH expression and then the expression ratio of 3’ mRNA to 5’ mRNA was calculated using 2-ddCt method. GAPDH primer sequences are: forward: 5-GACCACAGTCCATGCCATCACT and reverse: 5-GCTTCACCACCTTCTTGATGTCA. Data for transcripts detected with an updated microfluidic card including TET2 were obtained in the second cohort, and analyzed by the aforementioned protocol.
Immunoblot analysis
Cytosolic or nuclear proteins were subjected to Western blotting with indicated antibodies as described.[4]
Statistical analysis
Individual patient gene expression data within the defined cohorts was subjected to population analysis for statistical distinction using Mann- Whitney/Wilcox methodology and reported as p value for null hypothesis at 95% confidence interval. Additionally, t-test methodology was also used for comparison of individual patient samples for distinction of gene expression change upon patient treatment.
Author contributions
HS designed the clinical trial, treated patients, analyzed data and wrote the manuscript. YL designed laboratory experiments, analyzed the data, and wrote the manuscript. RG designed and performed laboratory experiments and analyzed data. MAZ analyzed clinical trial data and wrote the manuscript. LDC designed the clinical trial, treated patients and reviewed the manuscript. JW recruited patients, recorded datasets and reviewed the manuscript. KJS recruited patients and reviewed the manuscript. MN analyzed patient materials and revised the manuscript. LL performed data analysis and reviewed the manuscript. HK treated patients and revised the manuscript. AS analyzed data and reviewed the manuscript. FP performed experiments and reviewed the manuscript. RS designed and performed experiments and reviewed the manuscript. CG performed statistical analysis of data and reviewed the manuscript. RK performed experiments and wrote and revised the manuscript. MX designed experiments and reviewed/revised the manuscript. HSB designed the trial, performed experiments, recruited patients, treated patients, analyzed data and wrote the manuscript.
ACKNOWLEDGMENTS AND FUNDING
This work was supported in part by Department of Veterans Affairs Merit Review Award (HSB), the Wendy Will Case fund (HS), a research grant from Bayer/Onyx (HS), stipend in memory of Dr. Gary D. Tollefson (HSB), an Department of Defense Career Development Award CA120373 (YL) and a research grant from the Elsa Pardee Foundation (YL). We would like to thank Mrs. Marilyn Wales for helping in the preparation of the manuscript.
Conflicts of Interest
Hamid Sayar received research funding from Bayer/Onyx. Other authors declare no conflict of interests.
Editorial note
This paper has been accepted based in part on peer-review conducted by another journal and the authors’ response and revisions as well as expedited peer-review in Oncotarget.
References
1. Figueroa ME, Abdel-Wahab O, Lu C, Ward PS, Patel J, Shih A, Li Y, Bhagwat N, Vasanthakumar A, Fernandez HF, Tallman MS, Sun Z, Wolniak K, et al. Leukemic IDH1 and IDH2 mutations result in a hypermethylation phenotype, disrupt TET2 function, and impair hematopoietic differentiation. Cancer Cell. 2010; 18: 553-67. doi: 10.1016/j.ccr.2010.11.015.
2. Ley TJ, Ding L, Walter MJ, McLellan MD, Lamprecht T, Larson DE, Kandoth C, Payton JE, Baty J, Welch J, Harris CC, Lichti CF, Townsend RR, et al. DNMT3A mutations in acute myeloid leukemia. N Engl J Med. 2010; 363: 2424-33. doi: 10.1056/NEJMoa1005143.
3. Patel JP, Gonen M, Figueroa ME, Fernandez H, Sun Z, Racevskis J, Van Vlierberghe P, Dolgalev I, Thomas S, Aminova O, Huberman K, Cheng J, Viale A, et al. Prognostic relevance of integrated genetic profiling in acute myeloid leukemia. N Engl J Med. 2012; 366: 1079-89. doi: 10.1056/NEJMoa1112304.
4. Shanmugam R, Gade P, Wilson-Weekes A, Sayar H, Suvannasankha A, Goswami C, Li L, Gupta S, Cardoso AA, Al Baghdadi T, Sargent KJ, Cripe LD, Kalvakolanu DV, et al. A noncanonical Flt3ITD/NF-kappaB signaling pathway represses DAPK1 in acute myeloid leukemia. Clin Cancer Res. 2012; 18: 360-9. doi: 10.1158/1078-0432.ccr-10-3022.
5. Levis M, Ravandi F, Wang ES, Baer MR, Perl A, Coutre S, Erba H, Stuart RK, Baccarani M, Cripe LD, Tallman MS, Meloni G, Godley LA, et al. Results from a randomized trial of salvage chemotherapy followed by lestaurtinib for patients with FLT3 mutant AML in first relapse. Blood. 2011; 117: 3294-301. doi: 10.1182/blood-2010-08-301796.
6. Shih AH, Jiang Y, Meydan C, Shank K, Pandey S, Barreyro L, Antony-Debre I, Viale A, Socci N, Sun Y, Robertson A, Cavatore M, de Stanchina E, et al. Mutational cooperativity linked to combinatorial epigenetic gain of function in acute myeloid leukemia. Cancer Cell. 2015; 27: 502-15. doi: 10.1016/j.ccell.2015.03.009.
7. Griffiths EA, Gore SD, Hooker C, McDevitt MA, Karp JE, Smith BD, Mohammad HP, Ye Y, Herman JG, Carraway HE. Acute myeloid leukemia is characterized by Wnt pathway inhibitor promoter hypermethylation. Leuk Lymphoma. 2010; 51: 1711-9. doi: 10.3109/10428194.2010.496505.
8. Wang CQ, Krishnan V, Tay LS, Chin DW, Koh CP, Chooi JY, Nah GS, Du L, Jacob B, Yamashita N, Lai SK, Tan TZ, Mori S, et al. Disruption of Runx1 and Runx3 leads to bone marrow failure and leukemia predisposition due to transcriptional and DNA repair defects. Cell Rep. 2014; 8: 767-82. doi: 10.1016/j.celrep.2014.06.046.
9. Ito K, Lim AC, Salto-Tellez M, Motoda L, Osato M, Chuang LS, Lee CW, Voon DC, Koo JK, Wang H, Fukamachi H, Ito Y. RUNX3 attenuates beta-catenin/T cell factors in intestinal tumorigenesis. Cancer Cell. 2008; 14: 226-37. doi: 10.1016/j.ccr.2008.08.004.
10. Wang Y, Krivtsov AV, Sinha AU, North TE, Goessling W, Feng Z, Zon LI, Armstrong SA. The Wnt/beta-catenin pathway is required for the development of leukemia stem cells in AML. Science. 2010; 327: 1650-3. doi: 10.1126/science.1186624.
11. Bei L, Shah C, Wang H, Huang W, Roy R, Eklund EA. beta-Catenin activates the HOXA10 and CDX4 genes in myeloid progenitor cells. J Biol Chem. 2012; 287: 39589-601. doi: 10.1074/jbc.M112.402172.
12. Jin X, Jeon HM, Jin X, Kim EJ, Yin J, Jeon HY, Sohn YW, Oh SY, Kim JK, Kim SH, Jung JE, Kwak S, Tang KF, et al. The ID1-CULLIN3 Axis Regulates Intracellular SHH and WNT Signaling in Glioblastoma Stem Cells. Cell Rep. 2016; 16: 1629-41. doi: 10.1016/j.celrep.2016.06.092.
13. Cauchy P, James SR, Zacarias-Cabeza J, Ptasinska A, Imperato MR, Assi SA, Piper J, Canestraro M, Hoogenkamp M, Raghavan M, Loke J, Akiki S, Clokie SJ, et al. Chronic FLT3-ITD Signaling in Acute Myeloid Leukemia Is Connected to a Specific Chromatin Signature. Cell Rep. 2015; 12: 821-36. doi: 10.1016/j.celrep.2015.06.069.
14. Hartman AD, Wilson-Weekes A, Suvannasankha A, Burgess GS, Phillips CA, Hincher KJ, Cripe LD, Boswell HS. Constitutive c-jun N-terminal kinase activity in acute myeloid leukemia derives from Flt3 and affects survival and proliferation. Exp Hematol. 2006; 34: 1360-76. doi: 10.1016/j.exphem.2006.05.019.
15. Park JE, Yuen HF, Zhou JB, Al-Aidaroos AQ, Guo K, Valk PJ, Zhang SD, Chng WJ, Hong CW, Mills K, Zeng Q. Oncogenic roles of PRL-3 in FLT3-ITD induced acute myeloid leukaemia. EMBO Mol Med. 2013; 5: 1351-66. doi: 10.1002/emmm.201202183.
16. Rangatia J, Vangala RK, Singh SM, Peer Zada AA, Elsasser A, Kohlmann A, Haferlach T, Tenen DG, Hiddemann W, Behre G. Elevated c-Jun expression in acute myeloid leukemias inhibits C/EBPalpha DNA binding via leucine zipper domain interaction. Oncogene. 2003; 22: 4760-4. doi: 10.1038/sj.onc.1206664.
17. Hayakawa J, Mittal S, Wang Y, Korkmaz KS, Adamson E, English C, Ohmichi M, McClelland M, Mercola D. Identification of promoters bound by c-Jun/ATF2 during rapid large-scale gene activation following genotoxic stress. Mol Cell. 2004; 16: 521-35. doi: 10.1016/j.molcel.2004.10.024.
18. Ruppert SM, Chehtane M, Zhang G, Hu H, Li X, Khaled AR. JunD/AP-1-mediated gene expression promotes lymphocyte growth dependent on interleukin-7 signal transduction. PLoS One. 2012; 7: e32262. doi: 10.1371/journal.pone.0032262.
19. Nateri AS, Spencer-Dene B, Behrens A. Interaction of phosphorylated c-Jun with TCF4 regulates intestinal cancer development. Nature. 2005; 437: 281-5. doi: 10.1038/nature03914.
20. Gan XQ, Wang JY, Xi Y, Wu ZL, Li YP, Li L. Nuclear Dvl, c-Jun, beta-catenin, and TCF form a complex leading to stabilization of beta-catenin-TCF interaction. J Cell Biol. 2008; 180: 1087-100. doi: 10.1083/jcb.200710050.
21. Rayess H, Wang MB, Srivatsan ES. Cellular senescence and tumor suppressor gene p16. Int J Cancer. 2012; 130: 1715-25. doi: 10.1002/ijc.27316.
22. Lacayo NJ, Meshinchi S, Kinnunen P, Yu R, Wang Y, Stuber CM, Douglas L, Wahab R, Becton DL, Weinstein H, Chang MN, Willman CL, Radich JP, et al. Gene expression profiles at diagnosis in de novo childhood AML patients identify FLT3 mutations with good clinical outcomes. Blood. 2004; 104: 2646-54. doi: 10.1182/blood-2003-12-4449.
23. de Jonge HJ, de Bont ES, Valk PJ, Schuringa JJ, Kies M, Woolthuis CM, Delwel R, Veeger NJ, Vellenga E, Lowenberg B, Huls G. AML at older age: age-related gene expression profiles reveal a paradoxical down-regulation of p16INK4A mRNA with prognostic significance. Blood. 2009; 114: 2869-77. doi: 10.1182/blood-2009-03-212688.
24. Eppert K, Takenaka K, Lechman ER, Waldron L, Nilsson B, van Galen P, Metzeler KH, Poeppl A, Ling V, Beyene J, Canty AJ, Danska JS, Bohlander SK, et al. Stem cell gene expression programs influence clinical outcome in human leukemia. Nat Med. 2011; 17: 1086-93. doi: 10.1038/nm.2415.
25. de Jonge HJ, Woolthuis CM, Vos AZ, Mulder A, van den Berg E, Kluin PM, van der Weide K, de Bont ES, Huls G, Vellenga E, Schuringa JJ. Gene expression profiling in the leukemic stem cell-enriched CD34+ fraction identifies target genes that predict prognosis in normal karyotype AML. Leukemia. 2011; 25: 1825-33. doi: 10.1038/leu.2011.172.
26. Liu S, Liu Z, Xie Z, Pang J, Yu J, Lehmann E, Huynh L, Vukosavljevic T, Takeki M, Klisovic RB, Baiocchi RA, Blum W, Porcu P, et al. Bortezomib induces DNA hypomethylation and silenced gene transcription by interfering with Sp1/NF-kappaB-dependent DNA methyltransferase activity in acute myeloid leukemia. Blood. 2008; 111: 2364-73. doi: 10.1182/blood-2007-08-110171.
27. Larrue C, Saland E, Boutzen H, Vergez F, David M, Joffre C, Hospital MA, Tamburini J, Delabesse E, Manenti S, Sarry JE, Recher C. Proteasome inhibitors induce FLT3-ITD degradation through autophagy in AML cells. Blood. 2016; 127: 882-92. doi: 10.1182/blood-2015-05-646497.
28. Bernot KM, Nemer JS, Santhanam R, Liu S, Zorko NA, Whitman SP, Dickerson KE, Zhang M, Yang X, McConnell KK, Ahmed EH, Munoz MR, Siebenaler RF, et al. Eradicating acute myeloid leukemia in a Mll(PTD/wt):Flt3(ITD/wt) murine model: a path to novel therapeutic approaches for human disease. Blood. 2013; 122: 3778-83. doi: 10.1182/blood-2013-06-507426.
29. Andreeff M, Ruvolo V, Gadgil S, Zeng C, Coombes K, Chen W, Kornblau S, Baron AE, Drabkin HA. HOX expression patterns identify a common signature for favorable AML. Leukemia. 2008; 22: 2041-7. doi: 10.1038/leu.2008.198.
30. Tang R, Hirsch P, Fava F, Lapusan S, Marzac C, Teyssandier I, Pardo J, Marie JP, Legrand O. High Id1 expression is associated with poor prognosis in 237 patients with acute myeloid leukemia. Blood. 2009; 114: 2993-3000. doi: 10.1182/blood-2009-05-223115.
31. Choudhary C, Olsen JV, Brandts C, Cox J, Reddy PN, Bohmer FD, Gerke V, Schmidt-Arras DE, Berdel WE, Muller-Tidow C, Mann M, Serve H. Mislocalized activation of oncogenic RTKs switches downstream signaling outcomes. Mol Cell. 2009; 36: 326-39. doi: 10.1016/j.molcel.2009.09.019.
32. Garcia-Manero G, Yang H, Bueso-Ramos C, Ferrajoli A, Cortes J, Wierda WG, Faderl S, Koller C, Morris G, Rosner G, Loboda A, Fantin VR, Randolph SS, et al. Phase 1 study of the histone deacetylase inhibitor vorinostat (suberoylanilide hydroxamic acid [SAHA]) in patients with advanced leukemias and myelodysplastic syndromes. Blood. 2008; 111: 1060-6. doi: 10.1182/blood-2007-06-098061.
33. Rucker FG, Schlenk RF, Bullinger L, Kayser S, Teleanu V, Kett H, Habdank M, Kugler CM, Holzmann K, Gaidzik VI, Paschka P, Held G, von Lilienfeld-Toal M, et al. TP53 alterations in acute myeloid leukemia with complex karyotype correlate with specific copy number alterations, monosomal karyotype, and dismal outcome. Blood. 2012; 119: 2114-21. doi: 10.1182/blood-2011-08-375758.
34. Cheng J, Guo S, Chen S, Mastriano SJ, Liu C, D’Alessio AC, Hysolli E, Guo Y, Yao H, Megyola CM, Li D, Liu J, Pan W, et al. An extensive network of TET2-targeting MicroRNAs regulates malignant hematopoiesis. Cell Rep. 2013;5(2):471-481. doi:10.1016/j.celrep.2013.08.050.
35. Song SJ, Ito K, Ala U, Kats L, Webster K, Sun SM, Jongen-Lavrencic M, Manova-Todorova K, Teruya-Feldstein J, Avigan DE, Delwel R, Pandolfi PP. The oncogenic microRNA miR-22 targets the TET2 tumor suppressor to promote hematopoietic stem cell self-renewal and transformation. Cell Stem Cell. 2013;13(1):87-101. doi: 10.1016/j.stem.2013.06.003.
36. Eichhorn SW, Guo H, McGeary SE, Rodriguez-Mias RA, Shin C, Baek D, Hsu SH, Ghoshal K, Villén J, Bartel DP. mRNA destabilization is the dominant effect of mammalian microRNAs by the time substantial repression ensues. Mol Cell. 2014;56(1):104-115. doi: 10.1016/j.molcel.2014.08.028.
37. Li Z, Cai X, Cai CL, Wang J, Zhang W, Petersen BE, Yang FC, Xu M. Deletion of Tet2 in mice leads to dysregulated hematopoietic stem cells and subsequent development of myeloid malignancies. Blood. 2011; 118: 4509-18. doi: 10.1182/blood-2010-12-325241.
38. Wang Y, Xiao M, Chen X, Chen L, Xu Y, Lv L, Wang P, Yang H, Ma S, Lin H, Jiao B, Ren R, Ye D, et al. WT1 recruits TET2 to regulate its target gene expression and suppress leukemia cell proliferation. Mol Cell. 2015; 57: 662-73. doi: 10.1016/j.molcel.2014.12.023.
39. Aslanyan MG, Kroeze LI, Langemeijer SM, Koorenhof-Scheele TN, Massop M, van Hoogen P, Stevens-Linders E, van de Locht LT, Tonnissen E, van der Heijden A, da Silva-Coelho P, Cilloni D, Saglio G, et al. Clinical and biological impact of TET2 mutations and expression in younger adult AML patients treated within the EORTC/GIMEMA AML-12 clinical trial. Ann Hematol. 2014; 93: 1401-12. doi: 10.1007/s00277-014-2055-7.
40. Jeong M, Sun D, Luo M, Huang Y, Challen GA, Rodriguez B, Zhang X, Chavez L, Wang H, Hannah R, Kim SB, Yang L, Ko M, et al. Large conserved domains of low DNA methylation maintained by Dnmt3a. Nat Genet. 2014; 46: 17-23. doi: 10.1038/ng.2836.
41. Abdel-Wahab O, Adli M, LaFave LM, Gao J, Hricik T, Shih AH, Pandey S, Patel JP, Chung YR, Koche R, Perna F, Zhao X, Taylor JE, et al. ASXL1 mutations promote myeloid transformation through loss of PRC2-mediated gene repression. Cancer Cell. 2012; 22: 180-93. doi: 10.1016/j.ccr.2012.06.032.
42. Tan YT, Sun Y, Zhu SH, Ye L, Zhao CJ, Zhao WL, Chen Z, Chen SJ, Liu H. Deregulation of HOX genes by DNMT3A and MLL mutations converges on BMI1. Leukemia. 2016; 30: 1609-12. doi: 10.1038/leu.2016.15.
43. Gollner S, Oellerich T, Agrawal-Singh S, Schenk T, Klein HU, Rohde C, Pabst C, Sauer T, Lerdrup M, Tavor S, Stolzel F, Herold S, Ehninger G, et al. Loss of the histone methyltransferase EZH2 induces resistance to multiple drugs in acute myeloid leukemia. Nat Med. 2017; 23: 69-78. doi: 10.1038/nm.4247.
44. Garg M, Nagata Y, Kanojia D, Mayakonda A, Yoshida K, Haridas Keloth S, Zang ZJ, Okuno Y, Shiraishi Y, Chiba K, Tanaka H, Miyano S, Ding LW, et al. Profiling of somatic mutations in acute myeloid leukemia with FLT3-ITD at diagnosis and relapse. Blood. 2015; 126: 2491-501. doi: 10.1182/blood-2015-05-646240.
45. Inaba H, Rubnitz JE, Coustan-Smith E, Li L, Furmanski BD, Mascara GP, Heym KM, Christensen R, Onciu M, Shurtleff SA, Pounds SB, Pui CH, Ribeiro RC, et al. Phase I pharmacokinetic and pharmacodynamic study of the multikinase inhibitor sorafenib in combination with clofarabine and cytarabine in pediatric relapsed/refractory leukemia. J Clin Oncol. 2011; 29: 3293-300. doi: 10.1200/jco.2011.34.7427.
46. Schaab C, Oppermann FS, Klammer M, Pfeifer H, Tebbe A, Oellerich T, Krauter J, Levis M, Perl AE, Daub H, Steffen B, Godl K, Serve H. Global phosphoproteome analysis of human bone marrow reveals predictive phosphorylation markers for the treatment of acute myeloid leukemia with quizartinib. Leukemia. 2014; 28: 716-9. doi: 10.1038/leu.2013.347.
47. Cheson BD, Bennett JM, Kopecky KJ, Buchner T, Willman CL, Estey EH, Schiffer CA, Doehner H, Tallman MS, Lister TA, Lo-Coco F, Willemze R, Biondi A, et al. Revised recommendations of the International Working Group for Diagnosis, Standardization of Response Criteria, Treatment Outcomes, and Reporting Standards for Therapeutic Trials in Acute Myeloid Leukemia. J Clin Oncol. 2003; 21: 4642-9. doi: 10.1200/jco.2003.04.036.
48. Livak KJ, Schmittgen TD. Analysis of relative gene expression data using real-time quantitative PCR and the 2(-Delta Delta C(T)) Method. Methods. 2001; 25: 402-8. doi: 10.1006/meth.2001.1262.