
INTRODUCTION
Prostate cancer (PCa) is second-most commonly diagnosed malignancy in males, and thought to be one of the leading causes of cancer-related death around the world. In 2014, approximately 233,000 newly diagnosed cases and 30,000 PCa-related deaths was reported in America [1]. Furthermore, the global incidence is rising rapidly. By 2030, the number of new PCa and PCa-related deaths annually will climb to 1,853,391 and 544,209, respectively [2]. The etiology of PCa has remained unclear. Several factors are considered to significant increase the risk of PCa, including ethnicity, hormonal status, environment, diet, aging, and genetic factors [3].
Low serum levels of vitamin D might be one of the risk factors for PCa [4]. Laboratory investigation demonstrated that vitamin D inhibits the growth and differentiation of PCa cells, decreases the invasion, metabolism and angiogenesis of tumor cell. It can also promote tumor cell apoptosis [4]. In 2007, a clinical trial suggested that calcitriol, a kind of analogue of vitamin D can significantly improve patients’ survival rate by decreasing serum level of prostate special antigen (PSA) [5]. The antineoplastic effect of vitamin D is activated when binding to vitamin D receptor (VDR) [6]. 1,25-Dihydroxy vitamin D3(1,25(OH)2D3) is the hormonally active form of vitamin D. It binds to VDR and forms a heterodimer complex, which subsequently binds to the vitamin D response element and reduces the transcription levels of many genes that stimulating the cell growth and differentiation [7, 8].
Recently, the relationship of several single nucleotide polymorphisms (SNPs) of VDR gene and PCa risk has been the focus of research attention [8, 9]. Taq I polymorphism (rs731236) is one of the most widely-studied SNPs. It is a synonymous mutation located in exon 9 of VDR gene [10]. This mutation could reduce the mRNA stability and therefore decrease the mRNA levels of VDR gene [11]. Recently, some studies have suggested that Taq I variation might increase the susceptibility of PCa [12, 13]. However, these results are debatable and inconsistent in the effect of Taq I polymorphism on PCa risk. Numerous studies in favor of the association of Taq I polymorphisms and PCa risk [14–19]. Meanwhile, some studies disapprove of the relationship [20–22]. The difference might be due to under-power for individual study. Moreover, previous meta-analyses [10, 23, 24] seem to be outdated since new data appeared [17, 25–27]. Therefore, we conduct this meta-analysis to get more accurate results.
RESULTS
Characteristics of studies
We identified 288 potentially relevant studies following the retrieval strategy. Based on the inclusion criteria, 36 studies [3, 7, 9, 12, 14–19, 22, 25–49] between 1996 to 2017 were finally included (Figure 1). The number of cases and controls varied from 28 to 1,617, and 41 to 1,072, respectively (Table 1). The genotype distribution frequency in the control groups was consistent with Hardy-Weinberg equilibrium (HWE) for most studies, except for four studies [12, 19, 25, 49]. Each individual study scored more than 4 by Newcastle-Ottawa Scale (NOS), and was considered to be of high quality (Table 1). The percentages of tt, Tt and TT genotype in case group and control group were 11.9%, 40.4%, 47.7% and 12.1%, 41.3%, 46.6%, respectively in overall population.
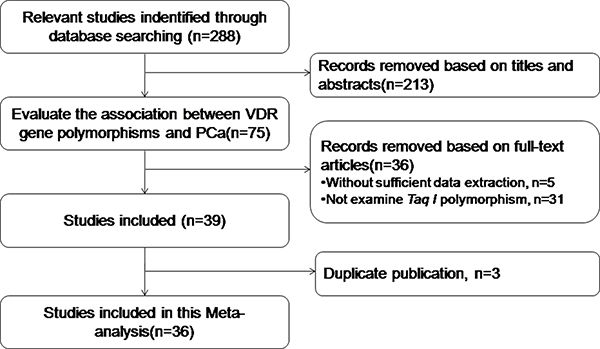
Figure 1: Study flowchart for the process of selecting the final 36 studies.
Table 1: Characteristics and quality assessment of the studies included in this meta-analysis
Author |
Year |
Country |
Ethnicity |
Genotyping method |
Sample size (cases/controls) |
Source of Controls |
HWE |
NOS |
|---|---|---|---|---|---|---|---|---|
Andersson |
2006 |
Sweden |
Caucasian |
PCR-RFLP |
137/176 |
PB |
Y |
6 |
Bai |
2009 |
China |
Asian |
PCR-RFLP |
122/130 |
HB |
Y |
6 |
Blazer |
2000 |
USA |
Caucasian |
PCR-RFLP |
77/183 |
PB |
Y |
6 |
Bodiwala |
2004 |
UK |
Caucasian |
PCR-RFLP |
368/243 |
BPH |
N |
6 |
Chaimuangraj |
2006 |
Thailand |
Asian |
PCR-RFLP |
28/30/44 |
HB/BPH |
Y |
5 |
Cicek |
2006 |
USA |
Mixed |
PCR-RFLP |
439/478 |
PB |
Y |
6 |
Correa-Cerro |
1999 |
Germany/France |
Caucasian |
PCR-RFLP |
106/95 |
HB |
Y |
6 |
Forrest |
2005 |
UK |
Caucasian |
PCR-RFLP |
262/444 |
HB |
Y |
6 |
Furuya |
1999 |
Japan |
Asian |
PCR-RFLP |
66/60 |
HB |
Y |
5 |
Gsur |
2002 |
Austria |
Caucasian |
PCR-RFLP |
190/190 |
BPH |
Y |
6 |
Habuchi |
2000 |
Japan |
Asian |
PCR-RFLP |
222/128/209 |
HB/BPH |
Y |
6 |
Hamasaki |
2001 |
Japan |
Asian |
PCR-RFLP |
115/133 |
HB |
Y |
6 |
Hamasaki |
2002 |
Japan |
Asian |
PCR-RFLP |
110/90/83 |
HB/BPH |
Y |
6 |
Holick |
2007 |
USA |
Caucasian |
SNPlex |
586/541 |
PB |
Y |
6 |
Holt |
2009 |
USA |
Caucasian |
SNPlex |
697/697 |
PB |
Y |
6 |
Hu |
2014 |
China |
Asian |
TaqMan |
108/242 |
PB |
Y |
6 |
Huang |
2004 |
China |
Asian |
PCR-RFLP |
160/205 |
PB |
Y |
6 |
Jingwi |
2015 |
USA |
African |
TaqMan |
306/251 |
PB |
Y |
6 |
John |
2005 |
USA |
African/Asian |
TaqMan |
424/436 |
PB |
Y |
6 |
Kambale |
2017 |
India |
Asian |
PCR-RFLP |
120/240 |
PB |
N |
5 |
Kibel |
1998 |
USA |
Mixed |
PCR-RFLP |
41/41 |
PB |
Y |
5 |
Luscombe |
2001 |
UK |
Caucasian |
PCR-RFLP |
209/154 |
BPH |
Y |
6 |
Ma |
1998 |
USA |
Caucasian |
PCR-RFLP |
354/589 |
HB |
Y |
7 |
Maistro |
2004 |
Brazil |
African |
PCR-RFLP |
165/200 |
HB |
Y |
6 |
Medeiros |
2002 |
Portugal |
Caucasian |
PCR-RFLP |
162/206 |
PB |
Y |
6 |
Oakley-Grivan |
2004 |
USA |
Mixed |
PCR-RFLP |
345/292 |
PB |
Y |
6 |
Oh |
2013 |
Korea |
Asian |
IGGGS |
272/173 |
BPH |
Y |
6 |
Onen |
2008 |
Turkey |
Caucasian |
PCR-RFLP |
133/157 |
PB |
Y |
6 |
Onsory |
2008 |
India |
Asian |
PCR-RFLP |
100/100 |
PB |
Y |
6 |
Rowland |
2013 |
USA |
Mixed |
TaqMan |
1617/1072 |
PB |
Y |
7 |
Suzuki |
2003 |
Japan |
Asian |
PCR-RFLP |
81/105 |
HB |
Y |
5 |
Tayeb |
2003 |
UK |
Caucasian |
PCR-RFLP |
21/379 |
BPH |
Y |
5 |
Tayeb |
2004 |
UK |
Caucasian |
PCR-RFLP |
28/56 |
BPH |
Y |
5 |
Taylor |
1996 |
USA |
Mixed |
PCR-RFLP |
108/170 |
BPH |
Y |
6 |
Watanabe |
1999 |
Japan |
Asian |
PCR-RFLP |
100/202 |
BPH |
N |
5 |
Yousaf |
2014 |
Pakistani |
Asian |
PCR-RFLP |
44/119 |
HB |
N |
5 |
Abbreviations: HWE, Hardy-Weinberg equilibrium; PB, population-based; HB, hospital-based; BPH, Benign Prostate Hyperplasia; RFLP, restriction fragment length polymorphism; NOS, Newcastle-Ottawa Scale.
Pooled results
As shown in Figure 2 and Table 2. Our results indicated that Taq I polymorphism marginally increase the PCa risk in the overall populations carrying TT genotype or T allele genotype (tt/Tt vs. TT: OR = 0.89, 95% CI = 0.80–1.00, p = 0.05; t vs. T allele: OR = 0.91, 95% CI = 0.84–0.99, p = 0.003), but not in other comparison models (tt vs. TT: OR = 0.86, 95% CI = 0.73−1.01, p = 0.069; Tt vs. TT: OR = 0.92, 95% CI = 0.81–1.10, p = 1.04; tt vs. TT/Tt: OR = 0.90, 95% CI = 0.76−1.06, p = 0.197) (Table 2).
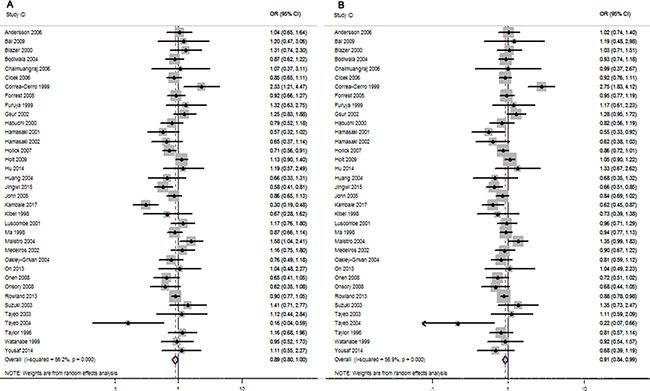
Figure 2: Forest plots to estimate the association of VDR Taq I polymorphism with PCa in the overall analysis. (A) Dominant model (tt/Tt vs. TT). (B) Allelic frequency model (t vs. T allele).
Table 2: Results of the association between Taq I polymorphism and PCa risk in the whole population
Comparison |
Studies |
Overall effect |
Heterogeneity |
Publication bias |
||||||
|---|---|---|---|---|---|---|---|---|---|---|
OR |
Z-score |
p-value |
I2 |
P-value |
Begg’s test |
Egger’s test |
||||
tt vs TT |
36 |
0.86 [0.73–1.01] |
1.82 |
0.069 |
44.10% |
0.004 |
0.382 |
0.363 |
||
Tt vs TT |
36 |
0.92 [0.81–1.04] |
1.35 |
0.176 |
60% |
0.000 |
0.955 |
0.891 |
||
tt/Tt vs TT |
36 |
0.89 [0.80–1.00] |
1.96 |
0.05 |
56.20% |
0.000 |
0.808 |
0.914 |
||
tt vs TT/Tt |
36 |
0.90 [0.76–1.06] |
1.29 |
0.197 |
54.20% |
0.000 |
0.318 |
0.496 |
||
t vs T |
36 |
0.91 [0.84–0.99] |
2.18 |
0.03 |
56.90% |
0.000 |
0.465 |
0.472 |
||
For the stratified analysis of different ethnicities, significantly increased risk was found in Asians in T allele genotype carriers (t vs. T: OR = 0.79, 95% CI = 0.68–0.91, p = 0.002) (Table 3 and Figure 2). However, when 15 studies performed in Caucasians and 3 studies in Africans were analyzed, no significant associations were found in any comparison models (Table 3).
Table 3: Results of the association between Taq I polymorphism and PCa risk in different ethnicities
Comparison |
Studies |
Overall effect |
Heterogeneity |
Publication bias |
||||||
|---|---|---|---|---|---|---|---|---|---|---|
OR |
Z-score |
p-value |
I2 |
P-value |
Begg’s test |
Egger’s test |
||||
Asian |
||||||||||
tt vs TT |
14 |
0.63 [0.41–0.95] |
2.18 |
0.029 |
0% |
0.504 |
0.312 |
0.981 |
||
Tt vs TT |
14 |
0.87 [0.63–1.21] |
0.82 |
0.413 |
69% |
0.000 |
0.033 |
0.022 |
||
tt/Tt vs TT |
14 |
0.80 [0.63–1.03] |
1.71 |
0.087 |
53% |
0.010 |
0.055 |
0.023 |
||
tt vs TT/Tt |
14 |
0.73 [0.38–1.39] |
0.95 |
0.34 |
46% |
0.046 |
0.243 |
0.414 |
||
t vs T |
14 |
0.78 [0.67-0.90] |
3.14 |
0.002 |
7% |
0.373 |
0.033 |
0.026 |
||
Caucasian |
||||||||||
tt vs TT |
15 |
0.99 [0.86–1.14] |
0.08 |
0.935 |
56% |
0.005 |
0.961 |
0.688 |
||
Tt vs TT |
15 |
0.99 [0.85–1.16] |
0.08 |
0.933 |
50% |
0.014 |
0.961 |
0.878 |
||
tt/Tt vs TT |
15 |
1.00 [0.85–1.17] |
0.03 |
0.974 |
55% |
0.05 |
0.961 |
0.762 |
||
tt vs TT/Tt |
15 |
1.01 [0.81–1.26] |
0.08 |
0.938 |
62% |
0.001 |
0.656 |
0.913 |
||
t vs T |
15 |
1.01 [0.89–1.14] |
0.12 |
0.905 |
67% |
0.000 |
0.729 |
0.884 |
||
African |
||||||||||
tt vs TT |
3 |
0.96 [0.45–2.08] |
0.1 |
0.922 |
72% |
0.027 |
0.602 |
0.603 |
||
Tt vs TT |
3 |
0.94 [0.51–1.72] |
0.22 |
0.829 |
82% |
0.004 |
0.602 |
0.632 |
||
tt/Tt vs TT |
3 |
0.94 [0.50–1.78] |
0.18 |
0.855 |
85% |
0.001 |
0.602 |
0.581 |
||
tt vs TT/Tt |
3 |
0.96 [0.59–1.56] |
0.17 |
0.86 |
40% |
0.189 |
0.602 |
0.515 |
||
t vs T |
3 |
0.96 [0.61–1.52] |
0.18 |
0.86 |
85% |
0.002 |
0.602 |
0.597 |
||
Taq I polymorphism could significantly increase PCa risk in the subgroup of population-based controls when patients carrying TT genotype or T allele genotype in all the genetic models (tt vs. TT: OR = 0.83, 95% CI = 0.73–0.94, p = 0.004; Tt vs. TT: OR = 0.83, 95% CI = 0.69–1.00, p = 0.049; tt/Tt vs. TT: OR = 0.82, 95% CI = 0.70–0.96, p = 0.016; tt vs. TT/Tt: OR = 0.88, 95% CI = 0.78–0.98, p = 0.023; t vs. T allele: OR = 0.89, 95% CI = 0.84–0.95, p = 0.000) (Table 4 and Figure 3). Meanwhile, results for the subgroups of hospital-based and BPH controls revealed no significantly increased risk (Table 4).
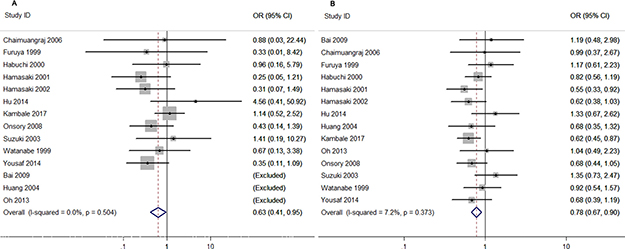
Figure 3: Forest plots to estimate the association of VDR Taq I polymorphism with PCa in Asians. (A) Homozygote model (tt vs. TT). (B) Allelic frequency model (t vs. T allele).
Table 4: Results of the association between Taq I polymorphism and PCa risk in different source of controls
Comparison |
Studies |
Overall effect |
Heterogeneity |
Publication bias |
||||||
|---|---|---|---|---|---|---|---|---|---|---|
OR |
Z-score |
p-value |
I2 |
P-value |
Begg’s test |
Egger’s test |
||||
Population-based |
||||||||||
tt vs TT |
16 |
0.83 [0.73–0.94] |
2.98 |
0.003 |
2% |
0.429 |
0.882 |
0.843 |
||
Tt vs TT |
16 |
0.83 [0.69–1.00] |
1.97 |
0.049 |
73% |
0.000 |
0.471 |
0.437 |
||
tt/Tt vs TT |
16 |
0.82 [0.70–0.96] |
2.41 |
0.016 |
68% |
0.000 |
0.719 |
0.419 |
||
tt vs TT/Tt |
16 |
0.88 [0.78–0.98] |
2.28 |
0.023 |
27% |
0.155 |
0.961 |
0.862 |
||
t vs T |
16 |
0.89 [0.84–0.95] |
3.89 |
0.000 |
39% |
0.057 |
0.418 |
0.297 |
||
Hospital-based |
||||||||||
tt vs TT |
12 |
0.90 [0.51–1.59] |
0.37 |
0.710 |
70% |
0.000 |
0.815 |
0.481 |
||
Tt vs TT |
12 |
1.02 [0.81–1.30] |
0.19 |
0.851 |
50% |
0.025 |
0.411 |
0.406 |
||
tt/Tt vs TT |
12 |
0.99 [0.78–1.27] |
0.07 |
0.946 |
57% |
0.008 |
0.681 |
0.752 |
||
tt vs TT/Tt |
12 |
0.89 [0.51–1.54] |
0.42 |
0.675 |
72% |
0.000 |
0.484 |
0.390 |
||
t vs T |
12 |
0.97 [0.76–1.25] |
0.21 |
0.832 |
77% |
0.000 |
0.681 |
0.767 |
||
BPH |
||||||||||
tt vs TT |
11 |
0.90 [0.68–1.19] |
0.75 |
0.451 |
20% |
0.267 |
0.677 |
0.476 |
||
Tt vs TT |
11 |
1.01 [0.85–1.20] |
0.11 |
0.911 |
25% |
0.208 |
0.938 |
0.715 |
||
tt/Tt vs TT |
11 |
0.98 [0.83–1.16] |
0.22 |
0.823 |
17% |
0.282 |
0.586 |
0.586 |
||
tt vs TT/Tt |
11 |
0.85 [0.66–1.10] |
1.23 |
0.217 |
43% |
0.083 |
0.677 |
0.585 |
||
t vs T |
11 |
0.95 [0.85–1.08] |
0.76 |
0.447 |
24% |
0.219 |
0.586 |
0.501 |
||
Studies were stratified into TaqMan, PCR-RFLP, and SNPlex groups by genotyping methods. No significant association was found in almost subgroups, except TaqMan group in tt vs. TT/Tt comparison (Table 5). The pooled outcome indicated that the genotyping methods included in these studies are both available and did not alter the outcomes.
Table 5: Results of the association between Taq I polymorphism and PCa risk in different genotyping method
Comparison |
Studies |
Overall effect |
Heterogeneity |
Publication bias |
||||||
|---|---|---|---|---|---|---|---|---|---|---|
OR |
Z-score |
p-value |
I2 |
P-value |
Begg’s test |
Egger’s test |
||||
PCR-RFLP |
||||||||||
tt vs TT |
29 |
0.88 [0.71–1.01] |
1.13 |
0.258 |
46% |
0.006 |
0.393 |
0.283 |
||
Tt vs TT |
29 |
0.94 [0.80–1.10] |
0.77 |
0.441 |
62% |
0.000 |
0.970 |
0.702 |
||
tt/Tt vs TT |
29 |
0.91 [0.79–1.05] |
1.31 |
0.19 |
57% |
0.000 |
0.851 |
0.995 |
||
tt vs TT/Tt |
29 |
0.90 [0.71–1.13] |
0.93 |
0.35 |
58% |
0.000 |
0.307 |
0.277 |
||
t vs T |
29 |
0.92 [0.82–1.03] |
1.51 |
0.13 |
59% |
0.000 |
0.476 |
0.424 |
||
TaqMan |
||||||||||
tt vs TT |
4 |
0.71 [0.53–0.94] |
2.38 |
0.017 |
32% |
0.219 |
1.000 |
0.794 |
||
Tt vs TT |
4 |
0.85 [0.69–1.05] |
1.50 |
0.134 |
44% |
0.147 |
0.174 |
0.691 |
||
tt/Tt vs TT |
4 |
0.82 [0.65–1.02] |
1.79 |
0.074 |
53% |
0.093 |
0.497 |
0.812 |
||
tt vs TT/Tt |
4 |
0.77 [0.64–0.93] |
2.68 |
0.007 |
3% |
0.378 |
1.000 |
0.618 |
||
t vs T |
4 |
0.83 [0.71–0.97] |
2.36 |
0.018 |
49% |
0.117 |
1.000 |
0.995 |
||
SNPlex |
||||||||||
tt vs TT |
3 |
0.95 [0.75–1.20] |
0.43 |
0.669 |
0% |
0.322 |
0.317 |
- |
||
Tt vs TT |
3 |
0.91 [0.60–1.39] |
0.43 |
0.664 |
78% |
0.010 |
0.602 |
0.999 |
||
tt/Tt vs TT |
3 |
0.92 [0.64–1.33] |
0.45 |
0.656 |
74% |
0.022 |
0.602 |
0.997 |
||
tt vs TT/Tt |
3 |
1.01 [0.81–1.25] |
0.05 |
0.961 |
0% |
0.783 |
0.317 |
- |
||
t vs T |
3 |
0.96 [0.82–1.23] |
0.52 |
0.603 |
37% |
0.203 |
0.602 |
0.987 |
||
As shown in Figure 4 and Table 6, we also performed a stratified analysis based on the clinical stages by Gleason Score to describe the relationship in more detail. The pooled results from 9 studies for advanced tumor group and 8 studies for localized tumor group did not reveal any association of Taq I polymorphism with the PCa risk in various genetic models. When 4 studies deviated from HWE in the controls were excluded, similar results were obtained (The results were not given).
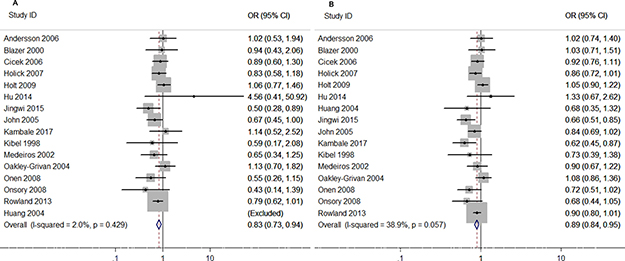
Figure 4: Forest plots to estimate the association of VDR Taq I polymorphism with PCa in the subgroup of population-Based controls. (A) Homozygote model (tt vs. TT). (B) Allelic frequency model (t vs. T allele).
Table 6: Results of the association between Taq I polymorphism and PCa risk in different tumor stage
Comparison |
Studies |
Overall effect |
Heterogeneity |
Publication bias |
||||||
|---|---|---|---|---|---|---|---|---|---|---|
OR |
Z-score |
p-value |
I2 |
P-value |
Begg’s test |
Egger’s test |
||||
Advanced |
||||||||||
tt vs TT |
9 |
0.87 [0.66–1.14] |
1.02 |
0.307 |
23% |
0.243 |
0.621 |
0.763 |
||
Tt vs TT |
9 |
0.85 [0.65–1.11] |
1.18 |
0.237 |
53% |
0.030 |
0.404 |
0.357 |
||
tt/Tt vs TT |
9 |
0.84 [0.64–1.10] |
1.28 |
0.200 |
59% |
0.012 |
0.532 |
0.347 |
||
tt vs TT/Tt |
9 |
0.92 [0.69–1.22] |
0.59 |
0.552 |
34% |
0.155 |
0.621 |
0.686 |
||
t vs T |
9 |
0.88 [0.70–1.10] |
1.14 |
0.252 |
66% |
0.003 |
0.211 |
0.301 |
||
Localized |
||||||||||
tt vs TT |
8 |
0.63 [0.27–1.45] |
1.10 |
0.273 |
85% |
0.000 |
0.453 |
0.966 |
||
Tt vs TT |
8 |
0.90 [0.66–1.24] |
0.63 |
0.531 |
61% |
0.013 |
0.458 |
0.901 |
||
tt/Tt vs TT |
8 |
0.84 [0.56–1.27] |
0.83 |
0.406 |
79% |
0.000 |
0.458 |
0.933 |
||
tt vs TT/Tt |
8 |
0.66 [0.35–1.22] |
1.33 |
0.182 |
76% |
0.000 |
0.652 |
0.891 |
||
tvs T |
8 |
0.84 [0.69–1.01] |
0.95 |
0.344 |
86% |
0.000 |
0.621 |
0.903 |
||
Heterogeneity
Significant between-study heterogeneity was detected in the overall analysis for all the comparison models (tt vs. TT: p = 0.004, I2 = 44%) Tt vs. TT: p = 0.000, I2 = 60%; tt/Tt vs. TT: p = 0.000, I2 = 56%; t vs. TT/Tt: p = 0.000, I2 = 54%; and t vs. T allele: p = 0.000, I2 = 57%) (Table 2). Therefore, random-effects estimates would be more suitable for data analysis. In the subgroup analyses of ethnicity, no heterogeneity was detected in homozygosis genetic model (p = 0.504, I2 = 0%) or allele-frequency model (p = 0.373, I2 = 7%) (Table 3). Similarly, subgroup analysis of population-based controls reported no heterogeneity in homozygosis model, recessive model or allele-frequency model (Table 4). Fix-effect model was applied in these comparison models.
Publication bias and sensitivity analysis
As shown in Figure 5, funnel plots did not reveal any obvious asymmetry. Moreover, the Egger’s test also showed that there was no publication bias in the overall analysis (Table 2) and almost the subgroup analyses (Table 3-6). Sensitivity analyses suggested that the pooled results had not changed significantly by omitting each individual study from all the analyses (Figure 6).
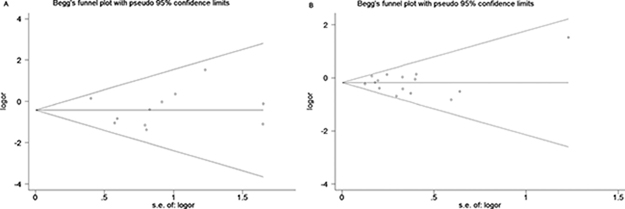
Figure 5: Begg’s funnel plots to examine publication bias for reported comparisons of VDR gene Taq I polymorphism for the homozygote in (A) Subgroup of Asians. (B) Subgroup of Population-Based controls.
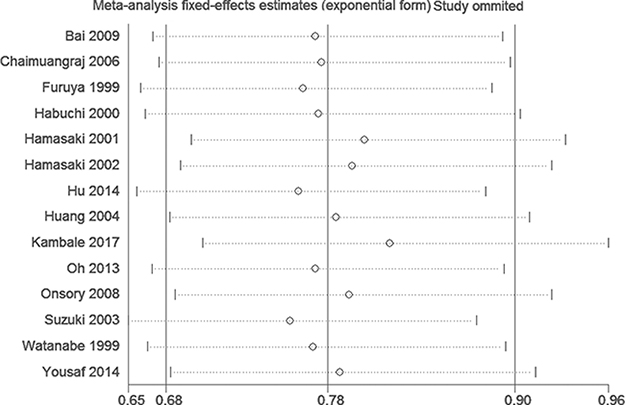
Figure 6: Sensitivity analysis of the comparison in Allelic frequency model (t vs. T allele) in Asians.
DISCUSSION
In recent years, polymorphism of VDR gene has drawn great attention, because more and more studies have shown that the mutations of VDR gene were related to the PCa risk [14–19]. However, these results have been disputable [20–22]. Previous meta-analyses were reported by Yin et al. in 2009, Fei et al. in 2016 and Liu et al. in 2017 [10, 23, 24], in which the number of included studies was 23, 27 and 8, respectively. However, some new data was reported, which is not consistent with the results of the former three studies [17, 25–27]. 8,423 cases and 8,867 controls were included in our analysis from 36 independent studies. The cases included were much more than the previous meta-analyses. Therefore, our results might be more convincing and stringent.
Our meta-analysis showed that Taq I polymorphism might increase the PCa risk in overall population in recessive genetic model and allele-frequency genetic model. It is not consistent with the results of previous report by Liu et al. [10]. But for the stratified analysis of ethnicity, significant increased risk was found to be associated with Taq I polymorphism in Asians, which is consistent with the results of the report of Fei et al [24]. Ethnicity is an important biological factor for the decline of VDR function [50]. The difference in outcome among ethnicities might result from racial backgrounds and geographic discrepancies [51]. In addition, different dietary patterns could also contribute to the difference [52]. Our results suggested that the Taq I variation might be one of the valuable biomarkers for predicting the susceptibility of PCa. Further studies of Caucasian and African are required.
For the subgroup analysis by the source of controls, increased risk of PCa was found to be associated with Taq I polymorphism in population-based controls in all the comparisons. Possibly some sick population were included in the groups of HBP or hospital-based controls, these groups were special and could not represent all the population [53]. Therefore, the results of these groups might be lack of credibility. Our results revealed some discrepancies between the genotyping methods. It suggested that Taq I polymorphism in the subgroup of TaqMan, Taq I was associated with PCa risk, which may be the cause of heterogeneity. According to a report in 2004, clinical tumor stage of PCa would be accelerated by VDR gene polymorphism [54]. Hence, we performed a subgroup analysis by clinical stage. Our results indicated no association between Taq I polymorphism and susceptibility of PCa, which were different from the previous meta-analyses [24].
Although the between-study heterogeneity was detected, sensitivity analysis did not reveal any significant change in our results by omitting the studies contribute to the heterogeneity. It suggested that our results were credible and statistically robust.
Some limitations should be acknowledged. First, several studies with too little number of patients were included in our analysis, they may introduce potential bias. Second, our results were based on unadjusted parameters, a more accurate analysis are needed, in which some related parameters should be included to adjust the outcome, including age, diet, and other important lifestyle factors.
In conclusion, our meta-analysis might be the largest meta-analysis to estimate the association of VDR gene Taq I polymorphism with the risk of PCa. Marginally increase of PCa risk was found to be related with Taq I polymorphism in overall population, especially in Asians and in population-based controls subgroup. In the future, large and well-designed researches are required to demonstrate the increased effect of Taq I polymorphism on PCa risk.
MATERIALS AND METHODS
Literature and search strategy
The PubMed, Embase, and Chinese National Knowledge Infrastructure (CNKI) database searches were carried out for all the eligible papers. The following search terms were included: “VDR/vitamin D receptor”, “prostate cancer/tumor/carcinoma” and “polymorphism/mutation/variant”. The literature search was updated to August, 2017. In addition, manually searching for the additional studies was conducted according to the references of the original and review reports.
Study selection
Retrieved studies were deemed eligible provided that they met all of the following criteria: (a) studies on human beings; (b) in a case-control or nested case-control design; (c) investigated the relationship of Taq I polymorphism with PCa risk; (d) distribution of genotype frequency for cases and controls could be obtained or calculated; (e) and received more than 4 points in the NOS, which was considered to be high quality; (f) the difference of baseline characters and clinical information was not significant between PCa patients and controls.
Data extraction
The studies meeting the inclusion criteria were read carefully by two investigators independently (Yansheng Zhao and Xiaofeng Liu). We collected the following information: author, year, country, ethnicity, genotyping methods, source of controls, sample size, and genotype and allele frequencies. The subjects were divided into different subgroups: Asians, Africans and Caucasians for ethnicity; hospital-based, population-based, and Benign Prostate Hyperplasia (BPH) for the source of controls; TaqMan, PCR-RFLP and SNPlex for genotyping method. The clinical stages were categorized as localized group (Gleason < 7) and advanced group (Gleason ≥ 7). In order to reach consensus on all of the items, any disagreement was resolved by a third reviewer (Lei Wang).
Statistical analysis
A χ2-test based on the Q statistic was conducted to evaluate the heterogeneity. The between-study heterogeneity was considered to be significant when I2 > 50% and p < 0.05, and the random effects model was used to combine values from studies [55]. Otherwise, for homogeneous studies, the fixed effects model was chosen.
The pooled odds ratios (ORs) together with its 95% confidence intervals (95% CIs) were calculated to evaluate the strength of the association. The statistical significance of ORs was determined with Z-test. To get a more reasonable result, five genetic models were adopted in our analysis: homozygote model (tt vs. TT), heterozygous model (Tt vs. TT), dominant model (tt vs. TT/Tt), recessive model (tt/Tt vs. TT) and allele genetic model (t vs. T).
To assess the potential publication bias, Begg’s Funnel plot was generated based on the analysis result and database size. The more asymmetry the funnel plot looked, the more publication bias was introduced. Meanwhile, Egger’s test was also performed for further investigation. For the Egger’s test, the significance level was set as p value < 0.05. Moreover, HWE of controls was recalculated with the goodness-of-fit χ2-test, P values of > 0.05 was considered as significant equilibrium.
For each outcome, we also performed subgroup analyses according to ethnicity, source of controls, genotyping method and clinic stages. Sensitivity analysis was performed to assess the stability of pooled results.
All analyses were performed using STATA package version 12.0 (Stata Corp, College Station, TX, USA). Two-sided P values of < 0.05 was considered to be statistically significant.
ACKNOWLEDGMENTS
Conceived and designed the experiments: Shaosan Kang and Yansheng Zhao. Extracted data: Yansheng Zhao, Xiaofeng Liu and Lei Wang. Performed the data analysis: Jian Liu, Xi Chen and Zhijie Shi. Wrote the paper: Weixing Gao and Fenghong Cao.
CONFLICTS OF INTEREST
The authors report no conflicts of interest.
GRANT SUPPORT
None.
REFERENCES
1. Bistulfi G, Affronti HC, Foster BA, Karasik E, Gillard B, Morrison C, Mohler J, Phillips JG, Smiraglia DJ. The essential role of methylthioadenosine phosphorylase in prostate cancer. Oncotarget. 2016; 7:14380–14393. https://doi.org/10.18632/oncotarget.7846.
2. Wang K, Wu G, Li J, Song W. Role of vitamin D receptor gene Cdx2 and Apa1 polymorphisms in prostate cancer susceptibility: a meta-analysis. BMC Cancer. 2016; 16:674.
3. Oh JJ, Byun SS, Lee SE, Hong SK, Jeong CW, Kim D, Kim HJ, Myung SC. Genetic variations in VDR associated with prostate cancer risk and progression in a Korean population. Gene. 2014; 533:86–93.
4. Galunska B, Gerova D, Kosev P, Anakievski D, Hinev A. Serum 25-hydroxy vitamin D levels in Bulgarian patients with prostate cancer: a pilot study. Clin Lab. 2015; 61:329–335.
5. Beer TM, Ryan CW, Venner PM, Petrylak DP, Chatta GS, Ruether JD, Redfern CH, Fehrenbacher L, Saleh MN, Waterhouse DM, Carducci MA, Vicario D, Dreicer R, et al. Double-blinded randomized study of high-dose calcitriol plus docetaxel compared with placebo plus docetaxel in androgen-independent prostate cancer: a report from the ASCENT Investigators. J Clin Oncol. 2007; 25:669–674.
6. Chakraborti CK. Vitamin D as a promising anticancer agent. Ind J Pharmacol. 2011; 43:113–120.
7. Tayeb MT, Clark C, Haites NE, Sharp L, Murray GI, McLeod HL. Vitamin D receptor, HER-2 polymorphisms and risk of prostate cancer in men with benign prostate hyperplasia. Saudi Med J. 2004; 25:447–451.
8. Kang S, Zhao Y, Liu J, Wang L, Zhao G, Chen X, Yao A, Zhang L, Zhang X, Li X. Association of Vitamin D receptor Fok I polymorphism with the risk of prostate cancer: a meta-analysis. Oncotarget. 2016; 7:77878–77889. https://doi.org/10.18632/oncotarget.12837.
9. Jingwi EY, Abbas M, Ricks-Santi L, Winchester D, Beyene D, Day A, Naab TJ, Kassim OO, Dunston GM, Copeland RL, Copela nd RL Jr, Kanaan YM. Vitamin D receptor genetic polymorphisms are associated with PSA level, Gleason score and prostate cancer risk in African-American men. Anticancer Res. 2015; 35:1549–1558.
10. Liu S, Cai H, Cheng W, Zhang H, Pan Z, Wang D. Association of VDR polymorphisms ( Taq I and Bsm I) with prostate cancer: a new meta-analysis. J Int Med Res. 2017; 45:3–10.
11. Morrison NA, Qi JC, Tokita A, Kelly PJ, Crofts L, Nguyen TV, Sambrook PN, Eisman JA. Prediction of bone density from vitamin D receptor alleles. Nature. 1994; 367:284–287.
12. Yousaf N, Afzal S, Hayat T, Shah J, Ahmad N, Abbasi R, Ramzan K, Jan R, Khan I, Ahmed J, Siraj S. Association of vitamin D receptor gene polymorphisms with prostate cancer risk in the Pakistani population. Asia Pac J Cancer Prevent. 2014; 15:10009–10013.
13. Li H, Stampfer MJ, Hollis JB, Mucci LA, Gaziano JM, Hunter D, Giovannucci EL, Ma J. A prospective study of plasma vitamin D metabolites, vitamin D receptor polymorphisms, and prostate cancer. PLoS Med. 2007; 4:e103.
14. Hamasaki T, Inatomi H, Katoh T, Ikuyama T, Matsumoto T. Clinical and pathological significance of vitamin D receptor gene polymorphism for prostate cancer which is associated with a higher mortality in Japanese. Endocrine J. 2001; 48:543–549.
15. Hamasaki T, Inatomi H, Katoh T, Ikuyama T, Matsumoto T. Significance of vitamin D receptor gene polymorphism for risk and disease severity of prostate cancer and benign prostatic hyperplasia in Japanese. Urologia Internationalis. 2002; 68:226–231.
16. Huang SP, Chou YH, Wayne Chang WS, Wu MT, Chen YY, Yu CC, Wu TT, Lee YH, Huang JK, Wu WJ, Huang CH. Association between vitamin D receptor polymorphisms and prostate cancer risk in a Taiwanese population. Cancer Lett. 2004; 207:69–77.
17. Bai Y, Yu Y, Yu B, Ge J, Ji J, Lu H, Wei J, Weng Z, Tao Z, Lu J. Association of vitamin D receptor polymorphisms with the risk of prostate cancer in the Han population of Southern China. BMC Med Genet. 2009; 10:125.
18. Blazer DG 3rd, Umbach DM, Bostick RM, Taylor JA. Vitamin D receptor polymorphisms and prostate cancer. Mol Carcinogen. 2000; 27:18–23.
19. Bodiwala D, Luscombe CJ, French ME, Liu S, Saxby MF, Jones PW, Fryer AA, Strange RC. Polymorphisms in the vitamin D receptor gene, ultraviolet radiation, and susceptibility to prostate cancer. Environ Mol Mutagen. 2004; 43:121–127.
20. Xu Y, He B, Pan Y, Deng Q, Sun H, Li R, Gao T, Song G, Wang S. Systematic review and meta-analysis on vitamin D receptor polymorphisms and cancer risk. Tumour Biol. 2014; 35:4153–4169.
21. Nelson SM, Batai K, Ahaghotu C, Agurs-Collins T, Kittles RA. Association between Serum 25-Hydroxy-Vitamin D, Aggressive Prostate Cancer in African American Men. Nutrients. 2016; 9.
22. Hu J, Qiu Z, Zhang L, Cui F. Kallikrein 3 and vitamin D receptor polymorphisms: potentials environmental risk factors for prostate cancer. Diagnost Pathol. 2014; 9:84.
23. Yin M, Wei S, Wei Q. Vitamin D Receptor Genetic Polymorphisms and Prostate Cancer Risk: A Meta-analysis of 36 Published Studies. Int J Clin Exp Med. 2009; 2:159–175.
24. Fei X, Liu N, Li H, Shen Y, Guo J, Wu Z. Polymorphisms of vitamin D receptor gene TaqI susceptibility of prostate cancer: a meta-analysis. Oncotargets Thera. 2016; 9:1033–1045.
25. Kambale PR, Haldar D, Kabi BC, Kambale KP. Study of Vitamin D Receptor Gene Polymorphism (FokI, TaqI, ApaI) Among Prostate Cancer Patients in North India. J Clin Diagnost Res. 2017; 11:BC05-BC08.
26. Forrest MS, Edwards SM, Houlston R, Kote-Jarai Z, Key T, Allen N, Knowles MA, Turner F, Ardern-Jones A, Murkin A, Williams S, Oram R, Bishop DT, et al. Association between hormonal genetic polymorphisms and early-onset prostate cancer. Pros Cancer Prostatic Dis. 2005; 8:95–102.
27. Holt SK, Kwon EM, Peters U, Ostrander EA, Stanford JL. Vitamin D pathway gene variants and prostate cancer risk. Cancer Epidem Biom Prevent. 2009; 18:1929–1933.
28. Andersson P, Varenhorst E, Soderkvist P. Androgen receptor and vitamin D receptor gene polymorphisms and prostate cancer risk. Eur J Cancer. 2006; 42:2833–2837.
29. Chaimuangraj S, Thammachoti R, Ongphiphadhanakul B, Thammavit W. Lack of association of VDR polymorphisms with Thai prostate cancer as compared with benign prostate hyperplasia and controls. Asian Pac J Cancer Prevent. 2006; 7:136–139.
30. Cicek MS, Liu X, Schumacher FR, Casey G, Witte JS. Vitamin D receptor genotypes/haplotypes and prostate cancer risk. Cancer Epidemiol Biom Prevent. 2006; 15:2549–2552.
31. Correa-Cerro L, Berthon P, Haussler J, Bochum S, Drelon E, Mangin P, Fournier G, Paiss T, Cussenot O, Vogel W. Vitamin D receptor polymorphisms as markers in prostate cancer. Hum Genet. 1999; 105:281–287.
32. Furuya Y, Akakura K, Masai M, Ito H. Vitamin D receptor gene polymorphism in Japanese patients with prostate cancer. Endo J. 1999; 46:467–470.
33. Gsur A, Madersbacher S, Haidinger G, Schatzl G, Marberger M, Vutuc C, Micksche M. Vitamin D receptor gene polymorphism and prostate cancer risk. Prostate. 2002; 51:30–34.
34. Habuchi T, Suzuki T, Sasaki R, Wang L, Sato K, Satoh S, Akao T, Tsuchiya N, Shimoda N, Wada Y, Koizumi A, Chihara J, Ogawa O, Kato T. Association of vitamin D receptor gene polymorphism with prostate cancer and benign prostatic hyperplasia in a Japanese population. Cancer Res. 2000; 60:305–308.
35. Holick CN, Stanford JL, Kwon EM, Ostrander EA, Nejentsev S, Peters U. Comprehensive association analysis of the vitamin D pathway genes, VDR, CYP27B1, and CYP24A1, in prostate cancer. Cancer Epidemiol Biom Prevent. 2007; 16:1990–1999.
36. John EM, Schwartz GG, Koo J, Van Den Berg D, Ingles SA. Sun exposure, vitamin D receptor gene polymorphisms, and risk of advanced prostate cancer. Cancer Res. 2005; 65:5470–5479.
37. Kibel AS, Isaacs SD, Isaacs WB, Bova GS. Vitamin D receptor polymorphisms and lethal prostate cancer. J Urol. 1998; 160:1405–1409.
38. Luscombe CJ, French ME, Liu S, Saxby MF, Jones PW, Fryer AA, Strange RC. Outcome in prostate cancer associations with skin type and polymorphism in pigmentation-related genes. Carcinogenesis. 2001; 22:1343–1347.
39. Ma J, Stampfer MJ, Gann PH, Hough HL, Giovannucci E, Kelsey KT, Hennekens CH, Hunter DJ. Vitamin D receptor polymorphisms, circulating vitamin D metabolites, and risk of prostate cancer in United States physicians. Cancer Epidemiol Biom Prev. 1998; 7:385–390.
40. Maistro S, Snitcovsky I, Sarkis AS, da Silva IA, Brentani MM. Vitamin D receptor polymorphisms and prostate cancer risk in Brazilian men. Int J Biol Mark. 2004; 19:245–249.
41. Medeiros R, Morais A, Vasconcelos A, Costa S, Pinto D, Oliveira J, Lopes C. The role of vitamin D receptor gene polymorphisms in the susceptibility to prostate cancer of a southern European population. J Hum Genet. 2002; 47:413–418.
42. Oakley-Girvan I, Feldman D, Eccleshall TR, Gallagher RP, Wu AH, Kolonel LN, Halpern J, Balise RR, West DW, Paffenbarger RS Jr, Whittemore AS. Risk of early-onset prostate cancer in relation to germ line polymorphisms of the vitamin D receptor. Cancer Epidemiol Biom Prev. 2004; 13:1325–1330.
43. Onen IH, Ekmekci A, Eroglu M, Konac E, Yesil S, Biri H. Association of genetic polymorphisms in vitamin D receptor gene and susceptibility to sporadic prostate cancer. Exp Biol Med. 2008; 233:1608–1614.
44. Onsory K, Sobti RC, Al-Badran AI, Watanabe M, Shiraishi T, Krishan A, Mohan H, Kaur P. Hormone receptor-related gene polymorphisms and prostate cancer risk in North Indian population. Mol Cell Biochem. 2008; 314:25–35.
45. Rowland GW, Schwartz GG, John EM, Ingles SA. Protective effects of low calcium intake and low calcium absorption vitamin D receptor genotype in the California Collaborative Prostate Cancer Study. Cancer Epidemiol Biom Prev. 2013; 22:16–24.
46. Suzuki K, Matsui H, Ohtake N, Nakata S, Takei T, Koike H, Nakazato H, Okugi H, Hasumi M, Fukabori Y, Kurokawa K, Yamanaka H. Vitamin D receptor gene polymorphism in familial prostate cancer in a Japanese population. Int J Urol. 2003; 10:261–266.
47. Tayeb MT, Clark C, Haites NE, Sharp L, Murray GI, McLeod HL. CYP3A4 and VDR gene polymorphisms and the risk of prostate cancer in men with benign prostate hyperplasia. Br J Cancer. 2003; 88:928–932.
48. Taylor JA, Hirvonen A, Watson M, Pittman G, Mohler JL, Bell DA. Association of prostate cancer with vitamin D receptor gene polymorphism. Cancer Res. 1996; 56:4108–4110.
49. Watanabe M, Fukutome K, Murata M, Uemura H, Kubota Y, Kawamura J, Yatani R. Significance of vitamin D receptor gene polymorphism for prostate cancer risk in Japanese. Anticancer Res. 1999; 19:4511–4514.
50. O'Neill V, Jeffery TJ, Saccone DS, Bornman L. Vitamin D Receptor Gene Expression and Function in a South African Population: Ethnicity, Vitamin D, FokI. PLoS One. 2013; 8:e67663.
51. Wang S, Alvero R. Racial and ethnic differences in physiology and clinical symptoms of polycystic ovary syndrome. Semin Reprod med. 2013; 31:365–369.
52. Rejnmark L, Jorgensen ME, Pedersen MB, Hansen JC, Heickendorff L, Lauridsen AL, Mulvad G, Siggaard C, Skjoldborg H, Sorensen TB, Pedersen EB, Mosekilde L. Vitamin D insufficiency in Greenlanders on a westernized fare: ethnic differences in calcitropic hormones between Greenlanders and Danes. Calc Tiss Int. 2004; 74:255–263.
53. Lunet N, Azevedo A. On the comparability of population-based and hospital-based case-control studies. Gaceta sanitaria. 2009; 23:564; author reply 565.
54. Chiang CH, Chen KK, Chang LS, Hong CJ. The impact of polymorphism on prostate specific antigen gene on the risk, tumor volume and pathological stage of prostate cancer. J Urol. 2004; 171:1529–1532.
55. Bohning D. Meta-analysis: a unifying meta-likelihood approach framing unobserved heterogeneity, study covariates, publication bias, and study quality. Methods Inf Med. 2005; 44:127–135.