
INTRODUCTION
Immune co-stimulatory and co-inhibitory receptors determined the functional outcome of T cell receptor (TCR) signaling and immune surveillance [1]. Tumors can modulate the interactions between inhibitory receptors and ligands to scape immune responses [2, 3]. For example, the co-inhibitory receptor programmed cell death 1 (PD-1) plays a key role in cancer immune, especially in the immune escape phase [4]. PD-1 can be expressed in activated CD4 + and CD8 + T cells, but also in some natural killer cells and B cells [5]. When PD-1 binds to the ligand PD-L1 (B7-H1) expressed on the surface of tumors, it strongly inhibits the production of T cells and cytokines [6, 7], promoting tumor cell growth and immune escape [8, 9].
PD-L1 also plays a key role in binding to PD-1 receptors expressed on activated T cells in T cell co-suppression and depletion [9–11]. PD-L1 expressed on tumor cells promotes tumor cell-specific T cell inactivation or apoptosis, leading to tumor cell growth and exacerbation of tumor immune escape [12]. PD-L1 is expressed in many types of human cancers, including in esophageal, gastrointestinal, pancreatic, breast, lung and kidney cancers [10–14]. Clinical trials suggest that blocking the PD-1/PD-L1 interaction using anti-PD-1 antibodies can be effective against several different malignancies, including melanoma, lung cancer, kidney cancer and bladder cancer [15–19].
In addition to serving as a therapeutic target, PD-L1 may also be useful as a prognostic biomarker [22]. However, whether PD-L1 expression is associated with worse prognosis for patients with primary solid tumors remains controversial [20–22]. Therefore we meta-analyzed all available evidence to address this question comprehensively.
RESULTS
A total of 1,258 records were retrieved from PUBMED, EMBASE, Web of Science and EBSCO (Figure 1). After excluding 825 duplicate publications, we reviewed the abstracts and titles of the remaining 433 articles. This led to the exclusion of another 288 records that were not original research articles published in English. The remaining articles were read in full, leading to the exclusion of 86 records because they did not deal with human patients or solid tumors, or because they failed to report adequate outcomes data. In the end, 59 articles were included in the meta-analysis.
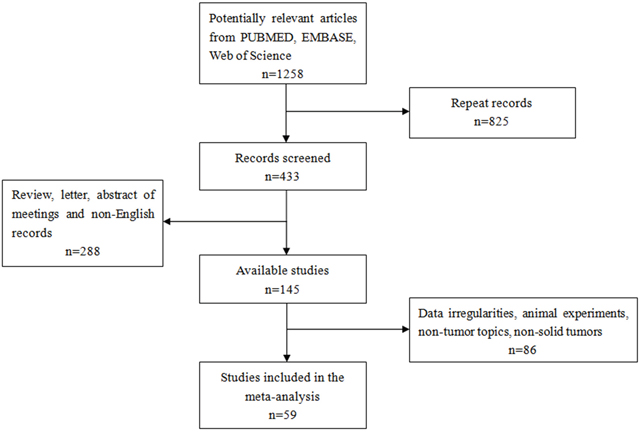
Figure 1: Flow chart of study selection.
Key features of the 59 studies are summarized in Table 1; 35 studies involved Asian populations and 24 involved non-Asian populations. The studies analyzed 20,004 patients from China [23–41], France [42], New Zealand [43, 44], Brazil [45], Australia [46], Canada [47, 48], Italy [49], Germany [50, 51], United States [52–65], Japan [66–74], South Korea [75–78], Switzerland [79] and Taiwan [80, 81]. PD-L1 expression, which was analyzed in similar ways across all studies, was characterized as positive in 6,028 patients and negative in the remaining 13,976. One third of the studies (19) involved gastrointestinal tumors, while the remaining 40 involved other types of tumors. Altogether 11 malignancies were represented in the patient population: breast cancer (5 studies), renal cell carcinoma (7), colorectal cancer (3), esophageal cancer (3), gastric cancer (7), hepatocellular carcinoma (7), Merkel cell carcinoma (3), small cell lung cancer (11), oral squamous cell carcinoma (5), pancreatic cancer (3), and urinary tract epithelial cell carcinoma (4).
Table 1: Characteristics of studies included in the meta-analysis
Study |
Country |
Tumor type |
Characteristic |
Age |
Gender |
No. patients positive/ negative for PD-L1 |
PD-L1-positive OS (%) |
PD-L1-negative OS (%) |
P |
||||
|---|---|---|---|---|---|---|---|---|---|---|---|---|---|
1-yr |
3-yr |
5-yr |
1-yr |
3-yr |
5-yr |
||||||||
Qin 2015 |
China |
Breast cancer |
Primary |
47(21-84) |
- |
189/681 |
100 |
85 |
81 |
100 |
98 |
92 |
<0.001 |
Sabatier 2015 |
France |
Breast cancer |
Primary |
≤50: 1288 |
- |
1076/4378 |
97 |
90 |
82 |
97 |
90 |
81 |
0.070 |
Muenst 2014 |
Switzerland |
Breast cancer |
Primary |
63.8 ± 14.2 |
- |
152/498 |
90 |
55 |
37 |
98 |
85 |
80 |
<0.001 |
Baptista 2016 |
Brazil |
Breast cancer |
Primary |
≤50: 176 |
107/82 |
98 |
90 |
85 |
100 |
96 |
93 |
0.030 |
|
Beckers 2016 |
Australia |
Breast cancer |
Primary |
- |
- |
123/38 |
96 |
92 |
81 |
96 |
73 |
65 |
0.035 |
Droeser 2013 |
Italy |
Colorectal cancer |
Primary |
69.9 (30–96) |
741/673 |
669/1420 |
84 |
71 |
61 |
72 |
48 |
37 |
<0.001 |
Shi SJ 2013 |
China |
Colorectal cancer |
Primary |
59.8 ± 12.5 |
91/116 |
64/143 |
75 |
54 |
42 |
90 |
72 |
61 |
0.017 |
Zhu 2014 |
China |
Colorectal cancer |
Primary |
≤50: 54 |
53/48 |
55/46 |
- |
- |
62 |
- |
- |
80 |
0.051 |
Krambeck 2007 |
USA |
Renal cell carcinoma |
Primary |
≤65: 54 |
150/148 |
70/228 |
78 |
62 |
48 |
91 |
83 |
76 |
<0.005 |
Thompson 2005 |
Canada |
Renal cell carcinoma |
Primary |
- |
- |
103/196 |
84 |
67 |
52 |
93 |
87 |
84 |
<0.001 |
Thompson 2007 |
Canada |
Renal cell carcinoma |
Primary |
≤65: 138 |
177/90 |
142/267 |
88 |
68 |
- |
94 |
85 |
- |
0.004 |
Abbas 2016 |
Germany |
Renal cell carcinoma |
Primary |
63 (31–88) |
116/61 |
37/140 |
85 |
57 |
47 |
92 |
75 |
66 |
0.005 |
Choueiri 2014 |
USA |
Renal cell carcinoma |
Primary |
59 (24–81) |
55/46 |
11/90 |
72 |
48 |
48 |
98 |
95 |
85 |
<0.001 |
Thompson 2004 |
USA |
Renal cell carcinoma |
Primary |
- |
- |
87/109 |
87 |
62 |
- |
95 |
92 |
- |
<0.001 |
Thompson 2006 |
USA |
Renal cell carcinoma |
Primary |
- |
- |
73/233 |
78 |
51 |
42 |
95 |
90 |
83 |
<0.001 |
Ohigashi 2005 |
Japan |
Esophageal cancer |
Primary |
≤65: 24 |
32/9 |
18/41 |
60 |
18 |
18 |
88 |
53 |
45 |
0.001 |
Tanaka 2016 |
Japan |
Esophageal cancer |
Primary |
62.6 ± 10.0 |
157/33 |
53/127 |
61 |
30 |
25 |
79 |
56 |
51 |
0.001 |
Chen 2014 |
China |
Esophageal cancer |
Primary |
≤65: 51 |
76/23 |
79/20 |
100 |
44 |
17 |
83 |
44 |
37 |
0.675 |
Loos 2011 |
Germany |
Esophageal cancer |
Primary |
- |
- |
37/64 |
79 |
51 |
32 |
96 |
82 |
69 |
<0.001 |
Shohei 2016 |
Japan |
Gastric carcinoma |
Primary |
67 ± 14 |
75/30 |
28/105 |
84 |
41 |
10 |
91 |
63 |
51 |
0.022 |
Geng 2015 |
China |
Gastric carcinoma |
Primary |
≤65: 65 |
61/39 |
65/100 |
72 |
41 |
29 |
87 |
61 |
37 |
0.026 |
Hou 2014 |
China |
Gastric carcinoma |
Primary |
≤58: 55 |
75/36 |
70/111 |
78 |
46 |
32 |
93 |
77 |
68 |
<0.001 |
Wu 2006 |
Sweden |
Gastric carcinoma |
Primary |
≤65: 64 |
75/27 |
43/102 |
75 |
38 |
30 |
98 |
71 |
64 |
0.001 |
Tamura 2015 |
Japan |
Gastric carcinoma |
Primary |
66.1 (17-89) |
305/126 |
128/303 |
90 |
65 |
49 |
94 |
78 |
64 |
0.001 |
Zheng 2014 |
China |
Gastric carcinoma |
Primary |
≤60: 42 |
62/18 |
33/47 |
86 |
65 |
52 |
91 |
69 |
53 |
0.636 |
Qing 2015 |
USA |
Gastric carcinoma |
Primary |
≤60: 42 |
72/35 |
54/107 |
81 |
28 |
18 |
93 |
47 |
27 |
0.004 |
Gao 2009 |
China |
Hepatocellular carcinoma |
Primary |
52 (18-81) |
204/36 |
60/180 |
70 |
42 |
39 |
83 |
57 |
49 |
0.029 |
Jung 2016 |
South Korea |
Hepatocellular carcinoma |
Primary |
≤53: 44 |
69/16 |
23/62 |
43 |
19 |
17 |
90 |
69 |
59 |
<0.001 |
Kan 2015 |
China |
Hepatocellular carcinoma |
Primary |
≤50: 56 |
108/20 |
105/23 |
30 |
5 |
0 |
50 |
15 |
10 |
0.001 |
Umemoto 2015 |
Japan |
Hepatocellular carcinoma |
Primary |
64 ± 10 |
71/9 |
37/43 |
74 |
51 |
40 |
80 |
73 |
71 |
0.051 |
Zeng 2011 |
China |
Hepatocellular carcinoma |
Primary |
53.1(35–68 |
109/32 |
31/32 |
38 |
- |
- |
85 |
- |
- |
0.000 |
Gabrielson 2016 |
USA |
Hepatocellular carcinoma |
Primary |
61 (30–86) |
50/15 |
30/35 |
85 |
85 |
- |
53 |
45 |
- |
0.029 |
Wu 2009 |
China |
Hepatocellular carcinoma |
Primary |
48, 23–75 |
65/6 |
35/36 |
81 |
54 |
40 |
97 |
83 |
71 |
0.014 |
Azuma 2014 |
Japan |
Lung cancer |
Primary |
66 (39-82) |
91/73 |
82/164 |
- |
- |
38 |
- |
- |
56 |
0.039 |
Chen 2012 |
China |
Lung cancer |
Primary |
≤54: 23 |
26/14 |
69/120 |
71 |
11 |
- |
85 |
48 |
- |
<0.001 |
Cooper 2015 |
USA |
Lung cancer |
Primary |
- |
477/201 |
628/678 |
95 |
73 |
62 |
84 |
54 |
44 |
0.023 |
Jiang 2015 |
China |
Lung cancer |
Primary |
≤60: 15 |
39/40 |
50/79 |
100 |
91 |
84 |
83 |
74 |
70 |
0.042 |
Kim 2015 |
South Korea |
Lung cancer |
Primary |
65 (45–81) |
33/8 |
89/331 |
65 |
38 |
27 |
78 |
49 |
49 |
0.570 |
Mu 2011 |
China |
Lung cancer |
Primary |
- |
- |
58/109 |
87 |
20 |
- |
95 |
38 |
- |
<0.005 |
Velcheti 2014 |
USA |
Lung cancer |
Primary |
≤70: 232 |
260/37 |
56/155 |
78 |
43 |
27 |
87 |
61 |
51 |
0.028 |
Yang 2014 |
Taiwan |
Lung cancer |
Primary |
≤70: 132 |
54/109 |
65/163 |
98 |
93 |
91 |
98 |
87 |
83 |
0.027 |
Zhang 2014 |
China |
Lung cancer |
Primary |
≤58: 73 |
84/59 |
70/143 |
84 |
71 |
53 |
97 |
89 |
77 |
0.002 |
Song 2016 |
China |
Lung cancer |
Primary |
<60: 207 |
198/187 |
186/199 |
99 |
71 |
40 |
99 |
79 |
52 |
0.069 |
Inamura 2016 |
Japan |
Lung cancer |
Primary |
<60: 96 |
142/126 |
43/225 |
85 |
69 |
55 |
95 |
81 |
71 |
0.019 |
Chen 2009 |
China |
Pancreatic cancer |
Primary |
<60: 61 |
76/23 |
18/40 |
32 |
8 |
- |
84 |
58 |
17 |
0.001 |
Nomi 2007 |
Japan |
Pancreatic cancer |
Primary |
- |
- |
20/51 |
48 |
12 |
- |
78 |
24 |
- |
0.016 |
Wang 2010 |
China |
Pancreatic cancer |
Primary |
- |
40/10 |
23/40 |
87 |
8 |
- |
100 |
33 |
- |
<0.001 |
Gadiot 2011 |
Netherlands |
Merkel cell carcinoma |
Primary |
- |
36/27 |
16/63 |
- |
51 |
37 |
- |
68 |
52 |
0.200 |
Hino 2010 |
Japan |
Merkel cell carcinoma |
Primary |
68.84 ± 2.85 |
38/21 |
34/59 |
- |
- |
52 |
- |
- |
81 |
0.040 |
Taube 2012 |
USA |
Merkel cell carcinoma |
Primary |
- |
76/74 |
57/150 |
- |
- |
84 |
- |
- |
61 |
0.330 |
Boorjian 2008 |
USA |
Urinary tract epithelial cell carcinoma |
Primary |
- |
259/59 |
39/314 |
58 |
51 |
43 |
91 |
82 |
67 |
0.005 |
Nakanishi 2006 |
Japan |
Urinary tract epithelial cell carcinoma |
Primary |
- |
47/18 |
46/65 |
86 |
68 |
57 |
100 |
100 |
100 |
0.021 |
Wang 2009 |
China |
Urinary tract epithelial cell carcinoma |
Primary |
- |
31/5 |
36/50 |
91 |
68 |
- |
100 |
100 |
- |
0.020 |
Xylinas 2014 |
USA |
Urinary tract epithelial cell carcinoma |
Primary |
65.9 (60.5e72.2) |
244/58 |
76/226 |
83 |
66 |
63 |
95 |
82 |
69 |
0.020 |
Kim 2016 |
South Korea |
Oral squamous cell cancer |
Primary |
65 (45–81) |
33/8 |
90/43 |
97 |
83 |
80 |
98 |
83 |
75 |
0.625 |
Lin 2015 |
Taiwan |
Oral squamous cell cancer |
Primary |
<56: 162 |
236/69 |
133/172 |
81 |
62 |
56 |
81 |
62 |
58 |
0.225 |
Cho 2011 |
South Korea |
Oral squamous cell cancer |
Primary |
<59: 20 |
32/13 |
26/45 |
72 |
51 |
43 |
72 |
63 |
63 |
0.012 |
Oliveira 2015 |
USA |
Oral squamous cell cancer |
Primary |
<60: 62 |
85/11 |
47/96 |
81 |
47 |
- |
61 |
18 |
- |
0.044 |
Ukpo 2013 |
USA |
Oral squamous cell cancer |
Primary |
55.8 ± 9.4 |
186/23 |
84/181 |
89 |
74 |
62 |
97 |
76 |
64 |
0.730 |
PD-L1 expression and OS across all studies
Meta-analysis of data from all 59 studies showed that the median OS rate was significantly lower in PD-L1-positive patients than in PD-L1-negative patients at 1 year (P = 0.039), 3 years (P < 0.001) and 5 years (P < 0.001; Figure 2). The RR for OS at the three time points (and associated 95% confidence intervals [CIs]) were 2.02 (1.56-2.60), 1.57 (1.34-1.83) and 1.43 (1.24-1.64) (Table 2 and Figure 2).
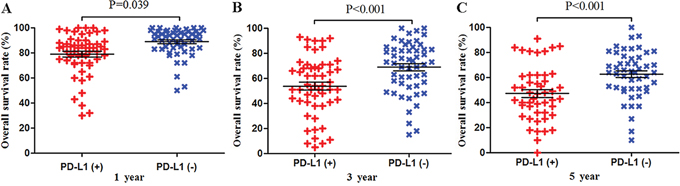
Figure 2: Scatter plot of OS at 1, 3 and 5 years for patients positive or negative for PD-L1 expression. Data come from the entire patient population.
Table 2: Meta-analysis of possible associations between PD-L1 expression and overall survival in patients with solid tumors
Group or subgroup |
N |
PD-L1(+/-) |
1 year OS |
3 year OS |
5 year OS |
||||||
|---|---|---|---|---|---|---|---|---|---|---|---|
RR (95 % CI) |
P |
I2 |
RR (95 % CI) |
P |
I2 |
RR (95 % CI) |
P |
I2 |
|||
All studies |
59 |
6028/13976 |
2.02 (1.56-2.60) |
<0.001 |
84 |
1.57 (1.34-1.83) |
<0.001 |
91 |
1.43 (1.24-1.64) |
<0.001 |
92 |
Ethnic subgroups |
|||||||||||
Asian |
35 |
2211/4126 |
1.83 (1.61-2.08)* |
<0.001 |
49 |
1.57 (1.39-1.77) |
<0.001 |
74 |
1.44 (1.31-1.58) |
<0.001 |
92 |
Non-Asian |
24 |
3817/9850 |
1.98 (1.27-3.09) |
0.003 |
90 |
1.60 |
0.003 |
95 |
1.39 |
0.009 |
95 |
Tumor origin |
|||||||||||
Gastrointestinal tumors |
24 |
1778/3206 |
2.12 |
<0.001 |
86 |
1.52 (1.23-1.89) |
<0.001 |
91 |
1.40 (1.17-1.67) |
<0.001 |
91 |
Other tumors |
35 |
4250/10770 |
1.79 (1.33-2.40) |
<0.001 |
86 |
1.61 (1.30-1.98) |
<0.001 |
92 |
1.47 (1.23-1.75) |
<0.001 |
91 |
Tumor type |
|||||||||||
Breast cancer |
5 |
1647/5677 |
1.80 (0.60-5.42) |
0.30 |
79 |
1.79 (0.77-4.19) |
<0.18 |
95 |
1.80 (0.68-4.73) |
<0.24 |
96 |
Esophageal cancer |
4 |
187/252 |
1.90 (0.69-5.21) |
0.21 |
70 |
2.77 (1.78-4.30)* |
<0.001 |
48 |
3.55 (2.63-5.65)* |
<0.001 |
0 |
Gastric carcinoma |
7 |
421/875 |
2.48 (1.80-3.41)* |
<0.001 |
18 |
1.63 |
<0.001 |
32 |
1.45 |
<0.001 |
79 |
Hepatocellular carcinoma |
7 |
321/339 |
1.87 |
0.04 |
78 |
1.40 (0.92-2.15) |
0.12 |
84 |
1.58 |
0.01 |
83 |
Lung cancer |
11 |
1396/2366 |
1.39 (0.69-2.81) |
0.36 |
88 |
1.17 (0.84-1.63) |
0.35 |
92 |
1.16 (0.86-1.57) |
0.32 |
93 |
Pancreatic cancer |
3 |
61/131 |
3.43 (2.06-5.73)* |
<0.001 |
15 |
1.48 (1.06-2.06)* |
0.02 |
0 |
- |
- |
- |
Merkel cell carcinoma |
3 |
107/272 |
- |
- |
- |
- |
- |
- |
1.01 (0.41-2.99) |
0.85 |
89 |
urinary tract epithelial cell carcinoma |
4 |
197/655 |
6.24 (3.62-10.74)* |
<0.001 |
0 |
3.43 (1.50-7.84) |
0.003 |
75 |
1.79 (0.86-3.70) |
0.12 |
82 |
Oral squamous cell cancer |
5 |
380/537 |
1.05 (0.58-1.93) |
0.87 |
63 |
0.95 (0.72-1.26) |
0.72 |
55 |
1.07 (0.89-1.29)* |
0.45 |
0 |
Renal cell carcinoma |
7 |
208/572 |
3.38 |
<0.001 |
24 |
4.14 (2.07-8.26) |
<0.001 |
81 |
2.57 |
<0.001 |
79 |
Colorectal cancer |
3 |
788/1609 |
1.17 (0.27-5.06) |
0.84 |
95 |
0.94 (0.33-2. 67) |
0.90 |
96 |
1.16 (0.55-2.45) |
0.69 |
95 |
N, number of studies; OS, overall survival; RR, risk ratio; 95% CI, 95% confidence interval
* These meta-analyses were performed using a fixed-effects model. All other meta-analyses were performed using a random-effects model.
Subgroup analysis by tumor type
Given the significant heterogeneity in the meta-analysis involving all 59 studies, we performed a series of subgroup analyses to eamine the possible correlation between PD-L1 expression and OS. PD-L1 expression was associated with worse 1-year OS for the following types of solid tumor (Table 2): gastric cancer, 2.48 (1.80-3.41); renal cell carcinoma, 3.38 (2.13-5.39); and hepatocellular carcinoma, 1.87 (1.01-3.46). PD-L1 expression was associated with worse 3-year OS for the following cancers: esophageal cancer, 2.77 (1.78-4.30); gastric cancer, 1.63 (1.43-1.87); pancreatic cancer, 1.48 (1.06-2.06); and renal cell carcinoma, 4.14 (2.07-8.26). PD-L1 expression was associated with worse 5-year OS for esophageal cancer, 3.55 (2.63-5.65); gastric cancer, 1.45 (1.18-1.79); hepatocellular carcinoma, 1.58 (1.11-2.25); and renal cell carcinoma, 2.57 (1.46-4.52).
Among the subset of 4,984 patients with gastrointestinal tumors, 1,778 (35.6%) were PD-L1-positive and 3,206 (64.4%) were PD-L1-negative. PD-L1 expression was associated with significantly worse OS at 1 year (P = 0.004), 3 years (P = 0.005), and 5 years (P = 0.002; Figures 3 and 7). The corresponding RRs and 95% CIs were 2.12(1.45-3.09), 1.52 (1.23-1.89), and 1.40 (1.17-1.67) (Table 2).
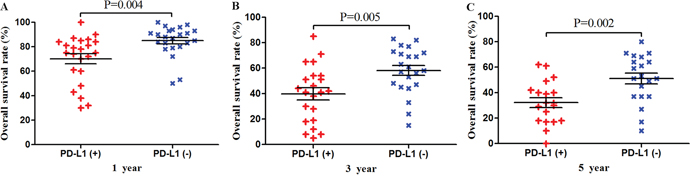
Figure 3: Scatter plot of OS at 1, 3 and 5 years for patients positive or negative for PD-L1 expression. Data come from the subset of patients with gastrointestinal tumors.
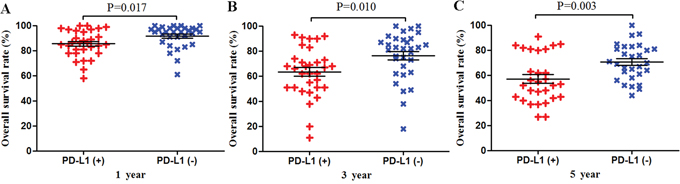
Figure 4: Scatter plot of OS at 1, 3 and 5 years for patients positive or negative for PD-L1 expression. Data come from the subset of patients with non-gastrointestinal tumors.
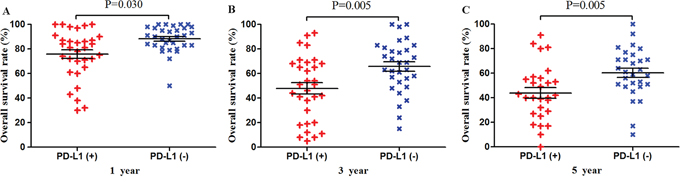
Figure 5: Scatter plot of OS at 1, 3 and 5 years for patients positive or negative for PD-L1 expression. Data come from the subset of Asian patients.
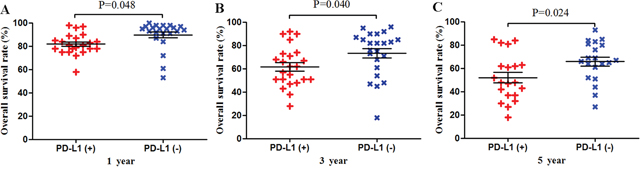
Figure 6: Scatter plot of OS at 1, 3 and 5 years for patients positive or negative for PD-L1 expression. Data come from the subset of non-Asian patients.
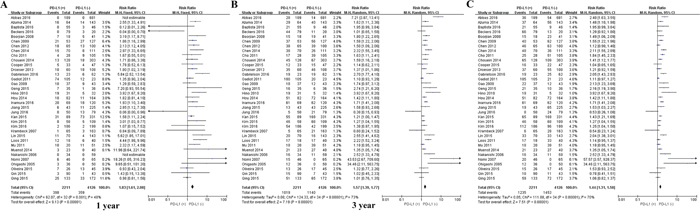
Figure 7: Forrest plot of OS at 1, 3 and 5 years for patients positive or negative for PD-L1 expression. Data come from the subset of patients with gastrointestinal tumors.
Among the subset of 4,309 patients with non-gastrointestinal tumors, 2,298 (53.3%) were PD-L1-positive and 1,404 (59.3%) were PD-L1-negative. PD-L1 expression was associated with significantly worse OS at 1 year (P = 0.017), 3 years (P = 0.010) and 5 years (P = 0.003; Figures 4 and 8). The corresponding RRs and 95% CIs were 1.79 (1.33-2.40), 1.61 (1.30-1.98), and 1.47 (1.23-1.75) (Table 2).
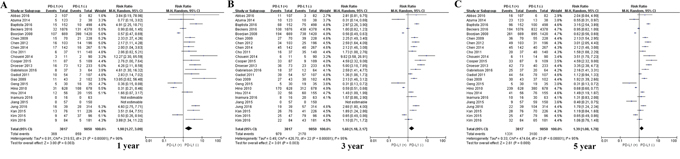
Figure 8: Forrest plot of OS at 1, 3 and 5 years for patients positive or negative for PD-L1 expression. Data come from the subset of patients with non-gastrointestinal tumors.
Subgroup analysis by patient ethnicity
Among the subset of 6,337 Asian patients, 2,211 were PD-L1-positive and 4,126 were PD-L1-negative. PD-L1 expression was associated with significantly lower OS at 1 year (P = 0.030), 3 years (P = 0.005) and 5 years (P = 0.005; Figures 5 and 9). The corresponding RRs and 95% CIs were 1.86 (1.61-2.08), 1.57 (1.39-1.77), and 1.44 (1.31-1.58) (Table 2).
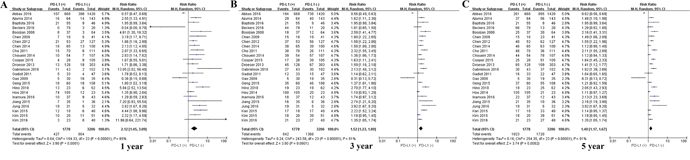
Figure 9: Forrest plot of OS at 1, 3 and 5 years for patients positive or negative for PD-L1 expression. Data come from the subset of Asian patients.
Among the subset of 13,667 non-Asian patients, 3,817 were PD-L1-positive and 9,850 were PD-L1-negative. PD-L1 expression was associated with significantly lower OS at 1 year (P = 0.048), 3 years (P = 0.040) and 5 years (P = 0.024; Figures 6 and 10). The corresponding RRs and 95% CIs were 1.98 (1.27-3.09), 1.60 (1.18-2.17), and 1.39 (1.08-1.78) (Table 2).
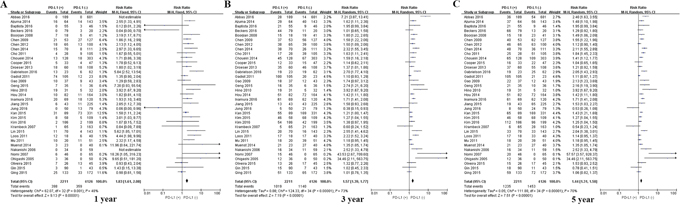
Figure 10: Forrest plot of OS at 1, 3 and 5 years for patients positive or negative for PD-L1 expression. Data come from the subset of non-Asian patients.
DISCUSSION
While studies published more than a decade ago established that PD-L1 promotes cancer immune escape [82, 83] and that blocking PD-L1 can improve the anti-tumor efficacy of anti-tumor responses [84–86], whether PD-L1 expression by solid tumors negatively affects patient prognosis remains unclear. Here we reviewed 59 studies involving 20,004 patients with 11 types of solid tumors and found strong evidence that PD-L1 expression is associated with significantly lower OS at 1, 3 and 5 years. This effect was observed in meta-analyses involving all patients as well as several subgroups of patients stratified by ethnicity and tumor type.
PD-L1 positive expression is associated with viral infection and chronic inflammation [87]. Expression of PD-L1 and/or PD-1 has been described for numerous types of cancers associated with viral infection [88], including polycyclic virus-associated Merkel cell carcinoma [89], hepatitis B virus-associated hepatocellular carcinoma [33], human papillomavirus-associated head and neck cancer, and Epstein-Barr virus-related nasopharyngeal carcinoma [90]. In patients with hepatocellular carcinoma, PD-L1 expression was significantly higher in tumor macrophages than in matched normal tissues, and expression correlated with tumor grade [25].
Our results are consistent with previous reports that PD-L1 expression is associated with worse 5-year outcome in patients with gastrointestinal carcinomas such as esophageal cancer and gastric cancer [70, 79] as well as colorectal cancer [25]. The precise mechanisms whereby PD-L1 expression may worsen prognosis are unknown; When PD-1 binds to the ligand PD-L1 (B7-H1) expressed on the surface of tumors, PD-1 has been shown to promote tumor cell-specific T cell inactivation or apoptosis [12].
The results of this meta-analysis should be interpreted cautiously because of several limitations. One is the lack of a standardized assay and cut-off value for classifying patients as PD-L1-positive. This may help explain the high heterogeneity observed across the included studies. Another limitation is our exclusion of gray literature, which may have increased the risk of publication bias and selection bias.
Despite these limitations, this large meta-analysis provides strong evidence that expression of PD-L1 may be a meaningful index for predicting prognosis in a wide variety of patients with solid tumors. These findings justify more focused prognostic studies in well-defined patient populations in which a panel of clinically relevant outcomes beyond only OS are considered.
MATERIALS AND METHODS
Literature search
PubMed, EMBASE, Web of Science and EBSCO were searched through 15 January 2017 to identify cohort and case-control studies examining the relationship between PD-L1 expression and prognosis of patients with solid tumors. The following search terms were used: programmed death-ligand 1, PD-L1, B7-H1, CD274 and solid tumor.
Inclusion and exclusion criteria
To be included in our meta-analysis, studies had to involve (1) primary solid tumors in human patients; (2) The main content of the articles is to analyze the relationship between the expression of PD-L1 and the prognosis of solid tumors in patients; (3) a hospital-based or population-based case-control or cohort design, regardless of sample size; (4) immunohistochemical assay of PD-L1 expression as high and low PD-L1 expression; (5) all patients underwent surgery; and (6) adequate reporting of overall survival (OS) data. When eligible studies involved overlapping patient populations, only the most recent or complete report was included. Studies were excluded if they were letter, summary of meeting and review; if they were published in a language other than English; or if they failed to report adequate data; or they investigated metastatic tumors. Gray literature (Reports and papers that were not published in PubMed, EMBASE, Web of Science and EBSCO) was not included into this study. Reference lists within identified articles were also searched manually to identify additional articles.
Meta-analysis outcomes
The primary outcome in the meta-analysis was OS. This outcome was compared between patients showing high or positive PD-L1 expression and patients showing low or no expression, as defined within the individual studies.
Data collection
Two researchers (P.-C.Y, X.X) independently screened studies for inclusion. Disagreements were resolved by discussion and, when necessary, consultation with a third author (S.Z). The first author's name, year of publication, country, number of patients, and tumor type were extracted from each study, and OS results for 1, 3 and 5 years were extracted from tables or Kaplan-Meier curves.
Statistical analysis
Forest plots of OS were generated using RevMan 5.3 (Cochrane Collaboration, Copenhagen, Denmark). Weighted risk ratio (RR) estimates were generated from pooled data using Mantel-Haenszel random-effects meta-analysis, unless no statistically heterogeneity, in which case fixed-effects meta-analysis was performed. Statistical heterogeneity in meta-analyses was assessed using Cochrane's Q and I2statistics. Survival results were analyzed using scatter plots generated in Prism 5 (Graphpad Software, San Diego, USA). The results for different patient groups were compared using the log-rank test. The threshold of statistical significance was defined as P < 0.05.
Author contributions
X.X, J.-H.Z and L.L conceived the study; P.-C.Y collected and analyzed the data; X.X drafted the manuscript; all authors have read and approved the final version to be published.
CONFLICTS OF INTEREST
The authors have declared that no competing interests exist.
FUNDING
This work was supported by Guangxi University of Science and Technology Research Projects (KY2015LX056), the Self-Raised Scientific Research Fund of the Ministry of Health of Guangxi Province (Z2016512, Z2015621, Z2015601, GZZC15-34, Z2014241), the Graduate Course Construction Project of Guangxi Medical University (YJSA2017014), and the the National Science and Technology Major Special Project (2012ZX10002010001009).
REFERENCES
1. Chen L, Flies DB. Molecular mechanisms of T cell co-stimulation and co-inhibition. Nature reviews. Immunology. 2013; 13:227-242.
2. Perez-Gracia JL, Labiano S, Rodriguez-Ruiz ME, Sanmamed MF, Melero I. Orchestrating immune check-point blockade for cancer immunotherapy in combinations. Current Opin Immunol. 2014; 27:89-97.
3. Xiang X, Qin HG, You XM, Wang YY, Qi LN, Ma L, Xiang BD, Zhong JH, Li LQ. Expression of P62 with hepatocellular carcinoma involving hepatitis B virus infection and aflatoxin B1 exposure. Cancer Med. 2017; 6:2357-2369
4. Hanahan D, Weinberg RA. The hallmarks of cancer. Cell. 2000; 100:57-70.
5. Freeman GJ, Long AJ, Iwai Y, Bourque K, Chernova T, Nishimura H, Fitz LJ, Malenkovich N, Okazaki T, Byrne MC, Horton HF, Fouser L, Carter L, et al. Engagement of the PD-1 immunoinhibitory receptor by a novel B7 family member leads to negative regulation of lymphocyte activation. J Exp Med. 2000; 192:1027-1034.
6. Latchman Y, Wood CR, Chernova T, Chaudhary D, Borde M, Chernova I, Iwai Y, Long AJ, Brown JA, Nunes R, Greenfield EA, Bourque K, Boussiotis VA, et al. PD-L2 is a second ligand for PD-1 and inhibits T cell activation. Nat Immunol. 2001; 2:261-268.
7. Jin HT, Ahmed R, Okazaki T. Role of PD-1 in regulating T-cell immunity. Curr Top Microbiol Immunol. 2011; 350:17-37.
8. Zha Y, Blank C, Gajewski TF. Negative regulation of T-cell function by PD-1. Crit Rev Immunol. 2004; 24:229-237.
9. D’Incecco A, Andreozzi M, Ludovini V, Rossi E, Capodanno A, Landi L, Tibaldi C, Minuti G, Salvini J, Coppi E, Chella A, Fontanini G, Filice ME, et al. PD-1 and PD-L1 expression in molecularly selected non-small-cell lung cancer patients. Br J Cancer. 2015; 112:95-102.
10. Faraj SF, Munari E, Guner G, Taube J, Anders R, Hicks J, Meeker A, Schoenberg M, Bivalacqua T, Drake C, Netto GJ. Assessment of tumoral PD-L1 expression and intratumoral CD8+ T cells in urothelial carcinoma. Urology. 2015; 85:703.e701-706.
11. Yamane H, Isozaki H, Takeyama M, Ochi N, Kudo K, Honda Y, Yamagishi T, Kubo T, Kiura K, Takigawa N. Programmed cell death protein 1 and programmed death-ligand 1 are expressed on the surface of some small-cell lung cancer lines. Am J Cancer Res. 2015; 5:1553-1557.
12. Mazel M, Jacot W, Pantel K, Bartkowiak K, Topart D, Cayrefourcq L, Rossille D, Maudelonde T, Fest T, Alix-Panabières C. Frequent expression of PD-L1 on circulating breast cancer cells. Mol Oncol. 2015; 9:1773-1782.
13. Chang YL, Yang CY, Lin MW, Wu CT, Yang PC. PD-L1 is highly expressed in lung lymphoepithelioma-like carcinoma: a potential rationale for immunotherapy. Lung Cancer. 2015; 88:254-259.
14. Tsai KK, Zarzoso I, Daud AI. PD-1 and PD-L1 antibodies for melanoma. Hum Vaccin Immunother. 2014; 10:3111-3116.
15. Brower V. Anti-PD-L1 antibody active in metastatic bladder cancer. Lancet Oncol. 2015; 16:e11.
16. Gettinger S, Herbst RS. B7-H1/PD-1 blockade therapy in non-small cell lung cancer: current status and future direction. Cancer J. 2014; 20:281-289.
17. Xiang X, Zhong JH, Wang YY, You XM, Ma L, Xiang BD, Li LQ. Distribution of tumor stage and initial treatment modality in patients with primary hepatocellular carcinoma Clin Transl Oncol. 2017; 19:891-897
18. Barbee MS, Ogunniyi A, Horvat TZ, Dang TO. Current status and future directions of the immune checkpoint inhibitors ipilimumab, pembrolizumab, and nivolumab in oncology. Ann Pharmacother. 2015; 49:907-937.
19. McDermott J, Jimeno A. Pembrolizumab: PD-1 inhibition as a therapeutic strategy in cancer. Drugs Today (Barc). 2015; 51:7-20.
20. Gunturi A, McDermott DF. Nivolumab for the treatment of cancer. Expert Opin Investig Drugs. 2015; 24:253-260.
21. Errico A. Immunotherapy: PD-1-PD-L1 axis: efficient checkpoint blockade against cancer. Nat Rev Clin Oncol. 2015; 12:63.
22. Zhong JH, Luo CP, Zhang CY, Li LQ. Strengthening the case that elevated levels of programmed death ligand 1 predict poor prognosis in hepatocellular carcinoma patients. J Hepatocell Carcinoma. 2017; 4:11-13.
23. Qin T, Zeng YD, Qin G, Xu F, Lu JB, Fang WF, Xue C, Zhan JH, Zhang XK, Zheng QF, Peng RJ, Yuan ZY, Zhang L, Wang SS. High PD-L1 expression was associated with poor prognosis in 870 Chinese patients with breast cancer. Oncotarget. 2015; 6:33972-33981. https://doi.org/10.18632/oncotarget.5583.
24. Shi SJ, Wang LJ, Wang GD, Guo ZY, Wei M, Meng YL, Yang AG, Wen WH. B7-H1 expression is associated with poor prognosis in colorectal carcinoma and regulates the proliferation and invasion of HCT116 colorectal cancer cells. PLoS One. 2013; 8:e76012.
25. Zhu J, Chen L, Zou L, Yang P, Wu R, Mao Y, Zhou H, Li R, Wang K, Wang W, Hua D, Zhang X. MiR-20b, -21, and -130b inhibit PTEN expression resulting in B7-H1 over-expression in advanced colorectal cancer. Hum Immunol. 2014; 75:348-353.
26. Chen L. Co-inhibitory molecules of the B7-CD28 family in the control of T-cell immunity. Nat Rev Immunol. 2004; 4:336-347.
27. Geng Y, Wang H, Lu C, Li Q, Xu B, Jiang J, Wu C. Expression of costimulatory molecules B7-H1, B7-H4 and Foxp3+ Tregs in gastric cancer and its clinical significance. Int J Clin Oncol. 2015; 20:273-281.
28. Hou J, Yu Z, Xiang R, Li C, Wang L, Chen S, Li Q, Chen M, Wang L. Correlation between infiltration of FOXP3+ regulatory T cells and expression of B7-H1 in the tumor tissues of gastric cancer. Exp Mol Pathol. 2014; 96:284-291.
29. Zheng Z, Bu Z, Liu X, Zhang L, Li Z, Wu A, Wu X, Cheng X, Xing X, Du H, Wang X, Hu Y, Ji J. Level of circulating PD-L1 expression in patients with advanced gastric cancer and its clinical implications. Chin J Cancer Res. 2014; 26:104-111.
30. Gao Q, Wang XY, Qiu SJ, Yamato I, Sho M, Nakajima Y, Zhou J, Li BZ, Shi YH, Xiao YS, Xu Y, Fan J. Overexpression of PD-L1 significantly associates with tumor aggressiveness and postoperative recurrence in human hepatocellular carcinoma. Clin Cancer Res. 2009; 15:971-979.
31. Kan G, Dong W. The expression of PD-L1 APE1 and P53 in hepatocellular carcinoma and its relationship to clinical pathology. Eur Rev Med Pharmacol Sci. 2015; 19:3063-3071.
32. Wu K, Kryczek I, Chen L, Zou W, Welling TH. Kupffer cell suppression of CD8+ T cells in human hepatocellular carcinoma is mediated by B7-H1/programmed death-1 interactions. Cancer Res. 2009; 69:8067-8075.
33. Zeng Z, Shi F, Zhou L, Zhang MN, Chen Y, Chang XJ, Lu YY, Bai WL, Qu JH, Wang CP, Wang H, Lou M, Wang FS, et al. Upregulation of circulating PD-L1/PD-1 is associated with poor post-cryoablation prognosis in patients with HBV-related hepatocellular carcinoma. PLoS One. 2011; 6:e23621.
34. Chen YB, Mu CY, Huang JA. Clinical significance of programmed death-1 ligand-1 expression in patients with non-small cell lung cancer: a 5-year-follow-up study. Tumori. 2012; 98:751-755.
35. Jiang L, Wang L, Li PF, Zhang XK, Chen JW, Qiu HJ, Wu XD, Zhang B. Positive expression of programmed death ligand-1 correlates with superior outcomes and might be a therapeutic target in primary pulmonary lymphoepithelioma-like carcinoma. OncoTargets Ther. 2015; 8:1451-1457.
36. Mu CY, Huang JA, Chen Y, Chen C, Zhang XG. High expression of PD-L1 in lung cancer may contribute to poor prognosis and tumor cells immune escape through suppressing tumor infiltrating dendritic cells maturation. Med Oncol. 2011; 28:682-688.
37. Song Z, Yu X, Cheng G, Zhang Y. Programmed death-ligand 1 expression associated with molecular characteristics in surgically resected lung adenocarcinoma. J Transl Med. 2016; 14:188.
38. Zhang Y, Wang L, Li Y, Pan Y, Wang R, Hu H, Li H, Luo X, Ye T, Sun Y, Chen H. Protein expression of programmed death 1 ligand 1 and ligand 2 independently predict poor prognosis in surgically resected lung adenocarcinoma. OncoTargets Ther. 2014; 7:567-573.
39. Chen XL, Yuan SX, Chen C, Mao YX, Xu G, Wang XY. [Expression of B7-H1 protein in human pancreatic carcinoma tissues and its clinical significance]. [Article in Chinese]. Ai zheng. 2009; 28:1328-1332.
40. Wang L, Ma Q, Chen X, Guo K, Li J, Zhang M. Clinical significance of B7-H1 and B7-1 expressions in pancreatic carcinoma. World J Surg. 2010; 34:1059-1065.
41. Wang Y, Zhuang Q, Zhou S, Hu Z, Lan R. Costimulatory molecule B7-H1 on the immune escape of bladder cancer and its clinical significance. J Huazhong Univ Sci Technolog Med Sci. 2009; 29:77-79.
42. Sabatier R, Finetti P, Mamessier E, Adelaide J, Chaffanet M, Ali HR, Viens P, Caldas C, Birnbaum D, Bertucci F. Prognostic and predictive value of PDL1 expression in breast cancer. Oncotarget. 2015; 6:5449-5464. https://doi.org/10.18632/oncotarget.3216.
43. Gadiot J, Hooijkaas AI, Kaiser AD, van Tinteren H, van Boven H, Blank C. Overall survival and PD-L1 expression in metastasized malignant melanoma. Cancer. 2011; 117:2192-2201.
44. Muenst S, Schaerli AR, Gao F, Däster S, Trella E, Droeser RA, Muraro MG, Zajac P, Zanetti R, Gillanders WE, Weber WP, Soysal SD. Expression of programmed death ligand 1 (PD-L1) is associated with poor prognosis in human breast cancer. Breast Cancer Res Treat. 2014; 146:15-24.
45. Baptista MZ, Sarian LO, Derchain SF, Pinto GA, Vassallo J. Prognostic significance of PD-L1 and PD-L2 in breast cancer. Hum Pathol. 2016; 47:78-84.
46. Beckers RK, Selinger CI, Vilain R, Madore J, Wilmott JS, Harvey K, Holliday A, Cooper CL, Robbins E, Gillett D, Kennedy CW, Gluch L, Carmalt H, et al. Programmed death ligand 1 expression in triple-negative breast cancer is associated with tumour-infiltrating lymphocytes and improved outcome. Histopathology. 2016; 69:25-34.
47. Thompson RH, Gillett MD, Cheville JC, Lohse CM, Dong H, Webster WS, Chen L, Zincke H, Blute ML, Leibovich BC, Kwon ED. Costimulatory molecule B7-H1 in primary and metastatic clear cell renal cell carcinoma. Cancer. 2005; 104:2084-2091.
48. Thompson RH, Dong H, Lohse CM, Leibovich BC, Blute ML, Cheville JC, Kwon ED. PD-1 is expressed by tumor-infiltrating immune cells and is associated with poor outcome for patients with renal cell carcinoma. Clin Cancer Res. 2007; 13:1757-1761.
49. Droeser RA, Hirt C, Viehl CT, Frey DM, Nebiker C, Huber X, Zlobec I, Eppenberger-Castori S, Tzankov A, Rosso R, Zuber M, Muraro MG, Amicarella F, et al. Clinical impact of programmed cell death ligand 1 expression in colorectal cancer. Eur J Cancer. 2013; 49:2233-2242.
50. Abbas M, Steffens S, Bellut M, Eggers H, Großhennig A, Becker JU, Wegener G, Schrader AJ, Grünwald V, Ivanyi P. Intratumoral expression of programmed death ligand 1 (PD-L1) in patients with clear cell renal cell carcinoma (ccRCC). Med Oncol. 2016; 33:80.
51. Loos M, Langer R, Schuster T, Gertler R, Walch A, Rauser S, Friess H, Feith M. Clinical significance of the costimulatory molecule B7-H1 in Barrett carcinoma. Ann Thorac Surg. 2011; 91:1025-1031.
52. Krambeck AE, Dong H, Thompson RH, Kuntz SM, Lohse CM, Leibovich BC, Blute ML, Sebo TJ, Cheville JC, Parker AS, Kwon ED. Survivin and b7-h1 are collaborative predictors of survival and represent potential therapeutic targets for patients with renal cell carcinoma. Clinical Cancer Res. 2007; 13:1749-1756.
53. Choueiri TK, Fay AP, Gray KP, Callea M, Ho TH, Albiges L, Bellmunt J, Song J, Carvo I, Lampron M, Stanton ML, Hodi FS, McDermott DF, et al. PD-L1 expression in nonclear-cell renal cell carcinoma. Ann Oncol. 2014; 25:2178-2184.
54. Thompson RH, Gillett MD, Cheville JC, Callea M, Ho TH, Albiges L, Bellmunt J, Song J, Carvo I, Lampron M, Stanton ML, Hodi FS, McDermott DF, et al. Costimulatory B7-H1 in renal cell carcinoma patients: indicator of tumor aggressiveness and potential therapeutic target. Proc Natl Acad Sci U S A. 2004; 101:17174-17179.
55. Thompson RH, Kuntz SM, Leibovich BC, Dong H, Lohse CM, Webster WS, Sengupta S, Frank I, Parker AS, Zincke H, Blute ML, Sebo TJ, Cheville JC, Kwon ED. Tumor B7-H1 is associated with poor prognosis in renal cell carcinoma patients with long-term follow-up. Cancer Res. 2006; 66:3381-3385.
56. Cooper WA, Tran T, Vilain RE, Madore J, Selinger CI, Kohonen-Corish M, Yip P, Yu B, O'Toole SA, McCaughan BC, Yearley JH, Horvath LG, Kao S, et al. PD-L1 expression is a favorable prognostic factor in early stage non-small cell carcinoma. Lung Cancer. 2015; 89:181-188.
57. Velcheti V, Schalper KA, Carvajal DE, Anagnostou VK, Syrigos KN, Sznol M, Herbst RS, Gettinger SN, Chen L, Rimm DL. Programmed death ligand-1 expression in non-small cell lung cancer. Lab Invest. 2014; 94:107-116.
58. Taube JM, Anders RA, Young GD, Xu H, Sharma R, McMiller TL, Chen S, Klein AP, Pardoll DM, Topalian SL, Chen L. Colocalization of inflammatory response with B7-h1 expression in human melanocytic lesions supports an adaptive resistance mechanism of immune escape. Sci Transl Med. 2012; 4:127ra137.
59. Boorjian SA, Sheinin Y, Crispen PL, Farmer SA, Lohse CM, Kuntz SM, Leibovich BC, Kwon ED, Frank I. T-cell coregulatory molecule expression in urothelial cell carcinoma: clinicopathologic correlations and association with survival. Clin Cancer Res. 2008; 14:4800-4808.
60. Xylinas E, Robinson BD, Kluth LA, Volkmer BG, Hautmann R, Küfer R, Zerbib M, Kwon E, Thompson RH, Boorjian SA, Shariat SF. Association of T-cell co-regulatory protein expression with clinical outcomes following radical cystectomy for urothelial carcinoma of the bladder. Eur J Surg Oncol. 2014; 40:121-127.
61. Oliveira-Costa JP, de Carvalho AF, da Silveira da GG, Amaya P, Wu Y, Park KJ, Gigliola MP, Lustberg M, Buim ME, Ferreira EN, Kowalski LP, Chalmers JJ, Soares FA, et al. Gene expression patterns through oral squamous cell carcinoma development: PD-L1 expression in primary tumor and circulating tumor cells. Oncotarget. 2015; 6:20902-20920. https://doi.org/10.18632/oncotarget.3939.
62. Ukpo OC, Thorstad WL, Lewis JS Jr. B7-H1 expression model for immune evasion in human papillomavirus-related oropharyngeal squamous cell carcinoma. Head Neck Pathol. 2013; 7:113-121.
63. Qing Y, Li Q, Ren T, Xia W, Peng Y, Liu GL, Luo H, Yang YX, Dai XY, Zhou SF, Wang D. Upregulation of PD-L1 and APE1 is associated with tumorigenesis and poor prognosis of gastric cancer. Drug Des Devel Ther. 2015; 9:901-909.
64. Gabrielson A, Wu Y, Wang H, Jiang J, Kallakury B, Gatalica Z, Reddy S, Kleiner D, Fishbein T, Johnson L, Island E, Satoskar R, Banovac F, et al. Intratumoral CD3 and CD8 T-cell densities associated with relapse-free survival in HCC. Cancer Immunol Res. 2016; 4:419-430.
65. Eto S, Yoshikawa K, Nishi M, Higashijima J, Tokunaga T, Nakao T, Kashihara H, Takasu C, Iwata T, Shimada M. Programmed cell death protein 1 expression is an independent prognostic factor in gastric cancer after curative resection. Gastric Cancer. 2016; 19:466-471.
66. Azuma K, Ota K, Kawahara A, Hattori S, Iwama E, Harada T, Matsumoto K, Takayama K, Takamori S, Kage M, Hoshino T, Nakanishi Y, Okamoto I. Association of PD-L1 overexpression with activating EGFR mutations in surgically resected nonsmall-cell lung cancer. Ann Oncol. 2014; 25:1935-1940.
67. Inamura K, Yokouchi Y, Sakakibara R, Kobayashi M, Subat S, Ninomiya H, Nagano H, Nomura K, Okumura S, Ishikawa Y. Relationship of tumor PD-L1 expression with EGFR wild-type status and poor prognosis in lung adenocarcinoma. Jpn J Clin Oncol. 2016; 46:935-941.
68. Hino R, Kabashima K, Kato Y, Yagi H, Nakamura M, Honjo T, Okazaki T, Tokura Y. Tumor cell expression of programmed cell death-1 ligand 1 is a prognostic factor for malignant melanoma. Cancer. 2010; 116:1757-1766.
69. Nakanishi J, Wada Y, Matsumoto K, Azuma M, Kikuchi K, Ueda S. Overexpression of B7-H1 (PD-L1) significantly associates with tumor grade and postoperative prognosis in human urothelial cancers. Cancer Immunol Immunother. 2007; 56:1173-1182.
70. Ohigashi Y, Sho M, Yamada Y, Tsurui Y, Hamada K, Ikeda N, Mizuno T, Yoriki R, Kashizuka H, Yane K, Tsushima F, Otsuki N, Yagita H, et al. Clinical significance of programmed death-1 ligand-1 and programmed death-1 ligand-2 expression in human esophageal cancer. Clin Cancer Res. 2005; 11:2947-2953.
71. Tanaka K, Miyata H, Sugimura K, Kanemura T, Hamada-Uematsu M, Mizote Y, Yamasaki M, Wada H, Nakajima K, Takiguchi S, Mori M, Doki Y, Tahara H. Negative influence of programmed death-1-ligands on the survival of esophageal cancer patients treated with chemotherapy. Cancer Sci. 2016; 107:726-733.
72. Tamura T, Ohira M, Tanaka H, Muguruma K, Toyokawa T, Kubo N, Sakurai K, Amano R, Kimura K, Shibutani M, Maeda K, Hirakawa K. Programmed death-1 ligand-1 (PDL1) expression is associated with the prognosis of patients with stage II/III gastric cancer. Anticancer Res. 2015; 35:5369-5376.
73. Umemoto Y, Okano S, Matsumoto Y, Nakagawara H, Matono R, Yoshiya S, Yamashita Y, Yoshizumi T, Ikegami T, Soejima Y, Harada M, Aishima S, Oda Y, et al. Prognostic impact of programmed cell death 1 ligand 1 expression in human leukocyte antigen class I-positive hepatocellular carcinoma after curative hepatectomy. J Gastroenterol. 2015; 50:65-75.
74. Nomi T, Sho M, Akahori T, Hamada K, Kubo A, Kanehiro H, Nakamura S, Enomoto K, Yagita H, Azuma M, Nakajima Y. Clinical significance and therapeutic potential of the programmed death-1 ligand/programmed death-1 pathway in human pancreatic cancer. Clin Cancer Res. 2007; 13:2151-2157.
75. Kim S, Kim MY, Koh J, Go H, Lee DS, Jeon YK, Chung DH. Programmed death-1 ligand 1 and 2 are highly expressed in pleomorphic carcinomas of the lung: comparison of sarcomatous and carcinomatous areas. Eur J Cancer. 2015; 51:2698-2707.
76. Kim HS, Lee JY, Lim SH, Park K, Sun JM, Ko YH, Baek CH, Son YI, Jeong HS, Ahn YC, Lee MY, Hong M, Ahn MJ. Association between PD-L1 and HPV status and the prognostic value of PD-L1 in oropharyngeal squamous cell carcinoma. Cancer Res Treat. 2016; 48:527-536.
77. Cho YA, Yoon HJ, Lee JI, Hong SP, Hong SD. Relationship between the expressions of PD-L1 and tumor-infiltrating lymphocytes in oral squamous cell carcinoma. Oral Oncol. 2011; 47:1148-1153.
78. Jung HI, Jeong D, Ji S, Ahn TS, Bae SH, Chin S, Chung JC, Kim HC, Lee MS, Baek MJ. Overexpression of PD-L1 and PD-L2 is Associated with Poor Prognosis in Patients with Hepatocellular Carcinoma. Cancer Res Treat. 2017; 49:246-254.
79. Wu C, Zhu Y, Jiang J, Zhao J, Zhang XG, Xu N. Immunohistochemical localization of programmed death-1 ligand-1 (PD-L1) in gastric carcinoma and its clinical significance. Acta Histochem. 2006; 108:19-24.
80. Yang CY, Lin MW, Chang YL, Wu CT, Yang PC. Programmed cell death-ligand 1 expression in surgically resected stage I pulmonary adenocarcinoma and its correlation with driver mutations and clinical outcomes. Eur J Cancer. 2014; 50:1361-1369.
81. Lin YM, Sung WW, Hsieh MJ, Tsai SC, Lai HW, Yang SM, Shen KH, Chen MK, Lee H, Yeh KT, Chen CJ. High PD-L1 expression correlates with metastasis and poor prognosis in oral squamous cell carcinoma. PLoS One. 2015; 10:e0142656.
82. Dong H, Strome SE, Salomao DR, Tamura H, Hirano F, Flies DB, Roche PC, Lu J, Zhu G, Tamada K, Lennon VA, Celis E, Chen L. Tumor-associated B7-H1 promotes T-cell apoptosis: a potential mechanism of immune evasion. Nat Med. 2002; 8:793-800.
83. Iwai Y, Ishida M, Tanaka Y, Okazaki T, Honjo T, Minato N. Involvement of PD-L1 on tumor cells in the escape from host immune system and tumor immunotherapy by PD-L1 blockade. Proc Natl Acad Sci U S A. 2002; 99:12293-12297.
84. Curiel TJ, Wei S, Dong H, Alvarez X, Cheng P, Mottram P, Krzysiek R, Knutson KL, Daniel B, Zimmermann MC, David O, Burow M, Gordon A, et al. Blockade of B7-H1 improves myeloid dendritic cell-mediated antitumor immunity. Nat Med. 2003; 9:562-567.
85. Strome SE, Dong H, Tamura H, Voss SG, Flies DB, Tamada K, Salomao D, Cheville J, Hirano F, Lin W, Kasperbauer JL, Ballman KV, Chen L. B7-H1 blockade augments adoptive T-cell immunotherapy for squamous cell carcinoma. Cancer Res. 2003; 63:6501-6505.
86. Blank C, Brown I, Peterson AC, Spiotto M, Iwai Y, Honjo T, Gajewski TF. PD-L1/B7H-1 inhibits the effector phase of tumor rejection by T cell receptor (TCR) transgenic CD8+ T cells. Cancer Res. 2004; 64:1140-1145.
87. Abdel-Magid AF. Inhibitors of the PD-1/PD-L1 Pathway Can Mobilize the Immune System: An Innovative Potential Therapy for Cancer and Chronic Infections. ACS Med Chem Lett. 2015; 6:489-490.
88. Fang W, Zhang J, Hong S, Zhan J, Chen N, Qin T, Tang Y, Zhang Y, Kang S, Zhou T, Wu X, Liang W, Hu Z, et al. EBV-driven LMP1 and IFNgamma up-regulate PD-L1 in nasopharyngeal carcinoma: Implications for oncotargeted therapy. Oncotarget. 2014; 5:12189-12202. https://doi.org/10.18632/oncotarget.2608.
89. Lipson EJ, Vincent JG, Loyo M, Kagohara LT, Luber BS, Wang H, Xu H, Nayar SK, Wang TS, Sidransky D, Anders RA, Topalian SL, Taube JM. PD-L1 expression in the Merkel cell carcinoma microenvironment: association with inflammation, Merkel cell polyomavirus and overall survival. Cancer Immunol Res. 2013; 1:54-63.
90. Lyford-Pike S, Peng S, Young GD, Taube JM, Westra WH, Akpeng B, Bruno TC, Richmon JD, Wang H, Bishop JA, Chen L, Drake CG, Topalian SL, et al. Evidence for a role of the PD-1:PD-L1 pathway in immune resistance of HPV-associated head and neck squamous cell carcinoma. Cancer Res. 2013; 73:1733-1741.