
INTRODUCTION
The reproducibility of results obtained in studies using model organisms highly depends on uniformity of growing conditions. The nematode Caenorhabditis elegans is widely used as a model organism in biology. The vast majority of laboratories use the C. elegans wild type N2 strain as reference, which was isolated by L. N. Staniland in Bristol (UK) in 1959 [1]. To minimize experimental variation, C. elegans growth and maintenance protocols are highly standardized. The canonical conditions for growing C. elegans in the lab are 20ºC temperature and E. coli OP50 bacteria as diet [2]. 15ºC–25ºC temperature maintenance is however considered physiological. Temperatures outside this range are not considered physiological and have a harmful effect on the development and physiology of the worm (http://www.wormbook.org). Using physiological temperatures above and below 20oC is a common practice when performing studies with C. elegans in the lab and it is especially important when analyzing thermosensitive mutants or when performing RNAi assays. Temperature fluctuations are known to have a major effect on parameters that reflect the physiology of the worm such as developmental time or longevity. For instance, at 25ºC, laboratory maintained wild type C. elegans complete the life cycle in 2.5 days, whereas at 15ºC worm development slows down and the life cycle extends up to 5 days. Similarly, the mean life span of C. elegans kept at 16ºC or at 24oC increases 60% or decreases 50%, respectively relative to worms maintained at 20ºC [3]. Thus, C. elegans studies performed at temperatures within the 15–25oC physiological range may elicit different biological responses by the worm, yet results and conclusions from studies at different temperatures are often compared.
The use of E. coli OP50 as C. elegans lab diet responds to historical reasons [2]. E. coli was a commonly studied bacterium at the time C. elegans was being developed as a model organism. Since C. elegans is a bacteriovore, E. coli became a very convenient food source to maintain worms and was therefore adopted as the standard C. elegans lab diet. In the wild, C. elegans feeds on soil and rotting vegetable bacteria and E. coli is not a bacterium type that C. elegans would typically encounter [4–5].
Bacillus subtilis, a common soil bacterium, has been used as an alternative C. elegans diet in a number of C. elegans studies [6–11]. B. subtilis has a similar caloric and nutrition content as E. coli [11]. High-energy demanding metabolic processes such as egg production and developmental growth are comparable when worms are fed E. coli or B. subtilis [11]. Interestingly, the mean life span of E. coli fed worms maintained at 20ºC has been shown to be around 17 days, compared to 27 days for B. subtilis fed worms maintained at the same temperature [6, 8]. In addition, these diets appear to induce death to the worms through different causes [8]. In fact, genetic and environmental interventions that alter C. elegans longevity by affecting metabolism, immune system or stress resistance, do not always lead to same effects when worms are fed E. coli or B. subtilis [11].
In this report we sought to evaluate the impact that different types of commonly used laboratory conditions can exert on worm transcriptome and physiology and therefore their influence in experimental results. To do this, we analyzed the transcriptomic profiles of adult C. elegans N2 nematodes grown at 15ºC, 20ºC and 25ºC when fed two different bacterial diets, E. coli and B. subtilis. By comparing gene expression signatures obtained under these maintenance conditions, we found that diet differences had a strong influence on the transcriptomic pattern of the worm. Interestingly, the effect of temperature on the transcriptome of E. coli fed worms was opposed to the effect of the same temperature on B. subtilis fed worms. For instance, analysis of biological process enrichment on the differentially expressed genes revealed that E. coli fed worms maintained at 25ºC led to an up-regulation of genes involved in defense response and down-regulation of genes involved in metabolism. In contrast, maintaining B. subtilis fed worms at 25ºC caused an up-regulation of genes involved in metabolic processes and a down-regulation of defense response pathways.
In summary, our work highlights major C. elegans transcriptomic response differences when animals are maintained at three physiologically accepted temperatures, 15ºC, 20ºC and 25ºC, and fed two different diets, E. coli and B. subtilis. Gene expression differences revealed significant metabolic adaptation mechanisms of the worm when confronted with physiologically higher or lower temperatures. Moreover up-regulation of defense response genes was observed when worms were fed B. subtilis, regardless of the temperature at which worms were kept. Altogether, our data suggest that C. elegans undergo significant metabolic and defense response changes when maintenance temperature fluctuates within the physiologically accepted experimental range.
RESULTS
Transcriptomic analyses reveal diet and temperature dependent gene expression
To examine the gene expression pattern of WT worms grown at different physiological temperatures we performed global mRNA-seq by deep sequencing using Illumina technology. Illumina platforms have been successfully used in C. elegans for both, genome sequencing [26–27] as well as transcriptomic analysis [28]. Synchronized populations of adult worms were maintained at either 15ºC, 20ºC or 25ºC and in two different diets, E. coli OP50 and B. subtilis PY79 (Figure 1A). Worms were kept on their respective experimental conditions for at least 3 generations prior to performing the mRNA-seq experiments (see Material and Methods). Once the worms were collected, mRNA was purified from the samples and processed for sequencing. Raw sequence data generated in this study are available at the Gene Expression Omnibus (GEO) data repository (Accession number GSE101524). mRNA reads were aligned to the C. elegans N2 reference genome (release WB235.85) (http://www.ensembl.org/Caenorhabditis_elegans/Info/Index). After read count on gene features (FeatureCounts software, http://subread.sourceforge.net/), quantitative analysis of differential expression between conditions was performed by following the SARTools pipeline (https://github.com/PF2-pasteur-fr/SARTools) (see Materials and Methods for details).
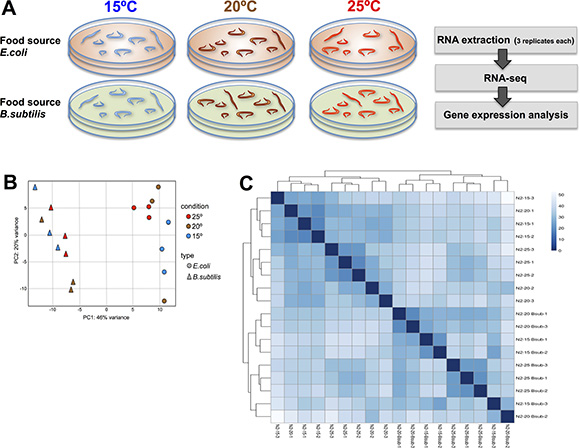
Figure 1: Transcriptional effect of diet and temperature on C.elegans. (A) Strategy for transcriptional profiling. Synchronous 1 day old adult worms maintained at 15ºC, 20ºC or 25ºC and fed either E. coli or B. subtilis were collected. RNA extraction and deep-sequencing was performed using commercial kits and Illumina platform using three biological replicates per condition. Analysis on differential gene expression data was performed as described in Material and Methods. (B) Principal Component Analysis (PCA) plot based on DESeq2 regularized log2 transformation (rld) data. The 18 samples shown in the 2D plane spanned by their first two principal components. Temperature growing condition (color) and food type (plotting symbol) are specified. PC1 shows a clear separation between transcriptomes of worms maintained on the different diets while a modest separation is observed for worms maintained on different temperatures. (C) Sample-to-sample distance heatmap showing the Euclidean distances (calculated from the rld data) between the worm samples. Upper and left-side dendrograms show samples grouped by diet type.
Gene expression data were normalized by a negative binomial distribution model by using DESeq2 and EdgeR implementations and compared in pairs to analyze the effect of the two variables of this study: diet (E. coli and B. subtilis) and growth temperature (15ºC, 20ºC, and 25ºC). Common up- and down-regulated genes determined by both methodologies were used for annotation, GO and KEGG analyses.
We used two different clustering methods to analyze transcriptomic similarities between worms maintained on the different temperature and diet conditions. Interestingly, we found a strong transcriptomic correlation for worms fed the same diet independently of the temperature in which they were maintained. The diet correlation was significantly stronger than the correlation observed for worms maintained at the same temperature (Figure 1B and 1C). These data indicate that diet type has a greater effect than physiological temperature variations on the worm transcriptome.
Experimental validation of mRNA-sequencing results
To validate the mRNA deep sequencing results, we selected three representative genes with significant differential expression when worms were maintained at 15ºC or at 25ºC (T05E11.9, nex-1 and D2045.2) and tested the levels of expression of these genes by quantitative Real Time PCR (RT-qPCR) [29]. In all cases we confirmed the direction and magnitude of the expression change observed by deep sequencing (Figure 2A).
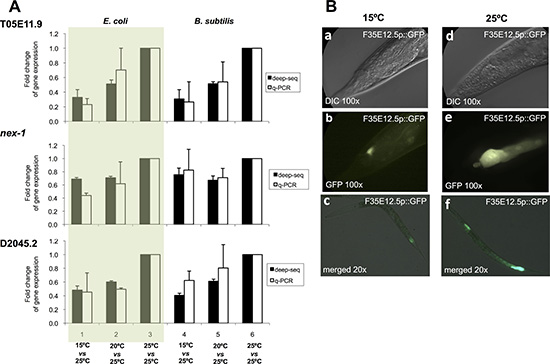
Figure 2: Validation of mRNA-sequencing results. (A) Gene expression quantification by deep-sequencing (dark bars) and RT-qPCR (light bars) for three genes, T05E11.9, nex-1, and D2045.2, which display a significant differential expression at different physiological temperatures. Bars represent fold change for gene expression when worms were maintained at 15ºC versus 25ºC, or at 20ºC versus 25ºC. 25ºC versus 25ºC is used as control. Experiments 1, 2, 3 were performed using an E. coli diet and experiments 4, 5, 6 were performed using a B. subtilis diet. Each bar represents 3 biological replicates. Results are expressed as the mean ± SEM. (B) GFP expression of transgenic worms carrying an integrated GFP transcriptional reporter for F35E12.5 at 15ºC (a, b, c) and at 25ºC (d, e, f). Detail of the worm tail when maintained at 15ºC using Nomarski optics (a) or fluorescence (b) and when maintained at 25ºC using Nomarski optics (d) or fluorescence (e). Merged Nomarski/fluorescence channels showing entire worm bodies of worms maintained at 15ºC (c) or at 25ºC (f).
To further validate our results, we obtained a transcriptional GFP reporter strain for the defense response gene irg-5 (F35E12.5) that showed increased expression when worms were maintained at 25ºC relative to worms maintained at 15ºC. We observed these worms under the microscope at both temperatures and as predicted by the mRNA deep sequencing results, GFP levels were higher for worms maintained at 25ºC than for worms maintained at 15ºC (Figure 2B).
Transcriptomic effect of growth temperature variations when C. elegans are fed the E. coli or the B. subtilis diet
We wanted to explore the impact on the transcriptome of maintaining C. elegans at physiologically high or low temperatures (25ºC or 15ºC) compared to the standard (20ºC) lab growing condition. To do this, we first performed pairwise comparisons of gene expression data sets obtained from worms fed the same diet but maintained at different temperatures. When C. elegans were fed the E. coli diet, we observed 571 genes with significantly increased expression for worms kept at 25ºC compared to worms kept at 15ºC. Of these, 184 genes also showed increased expression when worms kept at 25ºC were compared to worms kept at 20ºC. 183 out of the 184 genes retained the same expression level at 15ºC or at 20ºC but up-regulated their expression at physiologically hot temperature (25ºC). We named these genes “exclusively hot” genes (Figure 3A and Supplementary Table 1). The rest of the genes (387) that showed significantly increased expression when worms were kept at 25ºC relative to 15ºC, but did not show differences when worms were maintained at 20ºC or 25ºC, were referred to as “false hot” genes. We observed down-regulation of these “false hot” genes when worms maintained at 15ºC were compared to either worms kept at 20ºC or at 25ºC (Figure 4A and Supplementary Table 2).
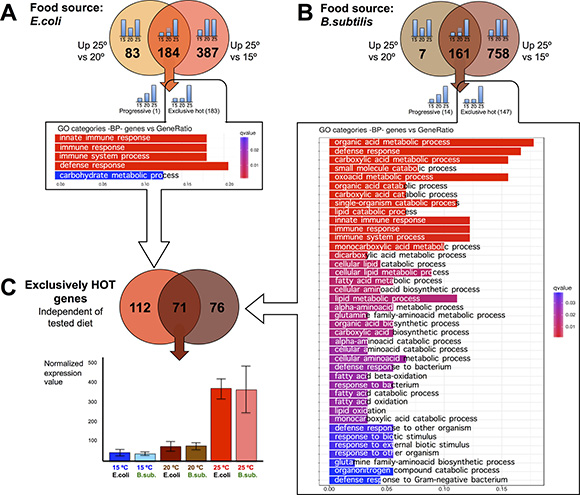
Figure 3: C. elegans gene up-regulation at physiologically hot temperature. (A) Pair comparisons of gene expression in nematodes fed E.coli at different temperatures shows that 184 genes exhibit significantly higher expression at 25ºC than at 20ºC and 15ºC. Out of them, 183 genes named “exclusively hot”, kept the same expression level at cold (15ºC) or standard growth temperatures (20ºC) but up-regulate their expression at physiologically hot temperatures (25ºC). This exclusively hot response in worms fed on E. coli showed an up-regulation of genes related mainly to defense response pathways. Gene Ontology (GO) Biological Processes (BP) vs number of genes within each category appears represented in color bars, one bar per GO term. The length of the bars indicates the number of genes belonging to the different GO categories and the color indicates the statistical significance, from those with high significant expression difference (red) to those with lower expression difference (blue). (B) Pair comparisons of gene expression in nematodes fed B. subtilis at different temperatures shows that 161 genes exhibit significantly higher expression at 25ºC than at 20ºC and 15ºC. Out of them, 147 genes named “exclusively hot”, kept the same expression level at cold (15ºC) or standard growth temperatures (20ºC) but up-regulate their expression at physiologically hot temperatures (25ºC). This exclusively hot response in worms fed on B. subtilis showed an up-regulation of genes enriched for several functions such as defense response and metabolism of organic acids, lipids and amino acids. Gene Ontology (GO) Biological Processes (BP) vs number of genes within each category appears represented in color bars, one bar per GO term. The length of the bars indicates the number of genes belonging to the different GO categories and the color indicates the statistical significance, from those with high significant expression difference (red) to those with lower expression difference (blue). (C) 71 genes show an exclusively hot response independently of the tested diet. However, its Gene Ontology analysis did not show an obvious enrichment for any biological functions beyond the fact of having been up-regulated at 25ºC. For the rest of the genes, the exclusive hot response was specific for the E. coli diet (112 genes) or specific for the B. subtilis diet (76 genes). Expression profile for this set of 71 genes is exemplified in the histogram. There are no significant differences at 15ºC or 20ºC but a significant upregulation at 25ºC, in both diets.
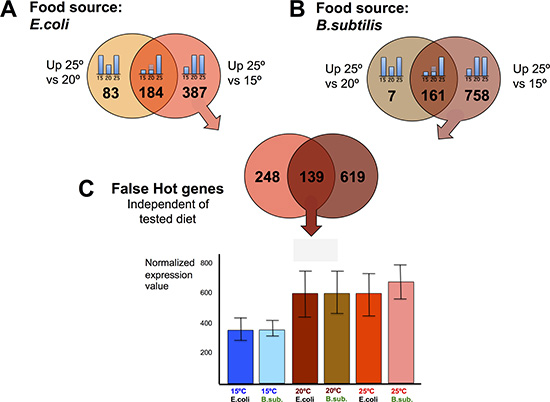
Figure 4: C. elegans gene down-regulation at physiologically cold temperature. (A) E. coli fed worms showed 387 genes with significantly higher expression when worms were maintained at 25ºC relative to worms maintained at 15ºC, but did not show differences relative to worms maintained at 20ºC. These 387 genes were referred to as “false hot” genes in an E. coli diet. (B) B. subtilis fed worms showed 758 genes with significantly higher expression when worms were maintained at 25ºC relative to worms maintained at 15ºC, but did not show differences relative to worms maintained at 20ºC. These genes were referred to as “false hot” genes in a B. subtilis diet. (C) 139 genes behaved as “false hot” genes independently of the tested diet. Expression pattern for this set of genes is exemplified in the histogram. There are no significant differences at 20ºC or 25ºC but a significant downregulation at 15ºC, in both diets.
The same pairwise comparisons described above were performed for B. subtilis fed worms (Figure 3B). When fed this diet, we observed 919 genes with significantly increased expression for worms kept at 25ºC compared to worms kept at 15ºC. 161 genes of the 919 also showed increased expression when worms were kept at 25ºC relative to 20ºC. 147 out of the 161 genes kept the same expression level when worms were maintained at 15ºC or at 20ºC but up-regulated their expression at 25ºC. These genes were referred to as “exclusively hot” genes (Figure 3B and Supplementary Table 3). Most of the genes that showed a significantly increased expression when B. subtilis fed worms were maintained at 25ºC relative to when worms were maintained at 15ºC can be considered as “false hot” genes. These genes were down-regulated when worms were kept at 15ºC compared to when worms were kept at either 20ºC or at 25ºC (Figure 4B and Supplementary Table 4).
We analyzed the identity of the “exclusively hot” genes for E. coli fed worms and their function by Gene Ontology analysis and observed up-regulation of genes involved in transcriptional activation of defense response pathways and, to a lower extent up-regulation of genes involved in carbohydrate metabolism (Figure 3A). When worms were fed an E. coli diet, the “exclusively hot” gene up-regulation was involved in defense response pathways. However, on a B. subtilis diet, the “exclusively hot” genes were enriched in genes related to metabolism of organic acids, lipids and amino acids (Figure 3B). We found 71 “exclusively hot” genes whose up-regulation was independent of the diet (Figure 3C and Supplementary Table 5). Gene ontology analysis of these genes did not show an obvious enrichment for any biological functions. However, the presence of a statistically significant (RF: 46.5, p < 1.6e-105) common “exclusively hot” gene response suggests the existence of a transcriptional regulatory mechanism to help C. elegans adapt to physiologically hot temperatures (25ºC).
To characterize the transcriptomic response of worms to physiologically cold temperatures (15ºC), we performed similar analyses as the ones outlined above for worms grown at 25oC. When fed an E. coli diet, we observed 665 genes with significantly increased expression for worms maintained at 15ºC relative to 25ºC. 35 of the 665 genes also showed increased expression at 15ºC relative to 20ºC. 29 of the 35 genes did not show significant differences when worms were maintained at 20ºC or at 25ºC but up-regulated their expression when the animals were kept at physiologically cold temperature (15ºC). We named these genes “exclusively cold” genes (Figure 5A and Supplementary Table 6). The rest of the genes (630) that showed significantly higher expression when worms were maintained at 15ºC as compared to 25ºC, but did not show differences when maintained at 15ºC or at 20ºC, were termed “false cold” genes. These 630 genes were observed to be down-regulated when worms were maintained at 25ºC compared to when worms were kept at either 20ºC or 15ºC (Figure 6A and Supplementary Table 7).
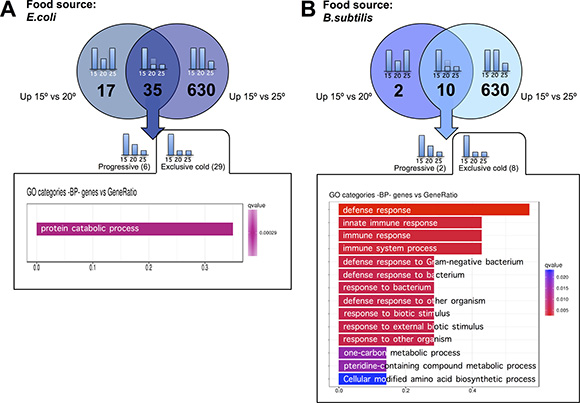
Figure 5: C. elegans gene up-regulation at physiologically cold temperature. (A) E. coli fed worms showed 35 genes with significantly higher expression when worms were maintained at 15ºC relative to when worms were maintained at 20ºC or at 25ºC. 29 out of these 35 genes were referred to as “exclusively cold” genes as they kept the same expression level when worms were maintained at 25ºC or at 20ºC, but up-regulated their expression when worms were maintained at physiologically cold temperature (15ºC). The “exclusively cold” response in E. coli fed worms showed a mild up-regulation of genes related to protein catabolism processes. Gene Ontology (GO) Biological Processes (BP) versus number of genes within the only statistically significant category is represented in purple bar. The length of the bar correlates to the number of genes belonging to the GO category. (B). B. subtilis fed worms showed 10 genes with significantly higher expression when worms were maintained at 15ºC relative to when worms were maintained at 20ºC or at 25ºC. 8 out of these 10 genes were referred to as “exclusively cold” genes as they kept the same expression level when worms were maintained at 25ºC or at 20ºC but up-regulated their expression when worms were maintained at physiologically cold temperature (15ºC). The “exclusively cold” response in B. subtilis fed worms affects genes involved in defense response. Gene Ontology (GO) Biological Processes (BP) versus number of genes within each category is represented in color bars, one bar per GO term. The length of the bars indicates the number of genes belonging to the different GO categories. The color of the bars indicates the statistical significance, ranging from highly significant expression difference (red) to low expression difference (blue).
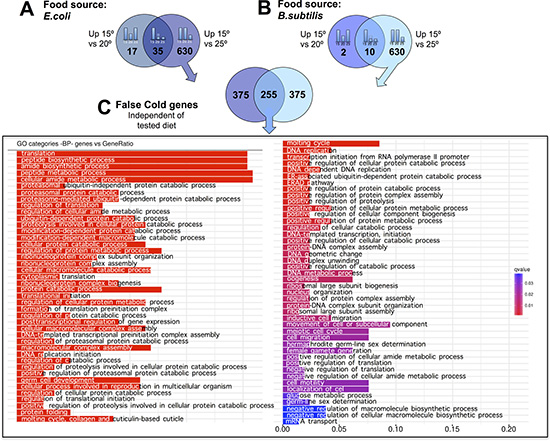
Figure 6: C. elegans gene down-regulation at physiologically hot temperature. (A) E. coli fed worms showed 630 genes with significantly lower expression when worms were maintained at 25ºC relative to when maintained at 15ºC or at 20ºC. These genes were referred to as “false cold” genes. (B). B. subtilis fed worms showed 630 genes with significantly lower expression when worms were maintained at 25ºC relative to when maintained at 15ºC or at 20ºC. These genes were referred to as “false cold” genes.(C). 255 genes showed a “false cold” response independently of the tested diet. These genes are involved in a wide variety of biological processes. Gene Ontology (GO) Biological Processes (BP) versus number of genes within each category is represented in color bars, one bar per GO term. The length of the bars indicates the number of genes belonging to the different GO categories. The color of the bars indicates the statistical significance, ranging from highly significant expression difference (red) to low expression difference (blue).
The same transcriptomic analyses detailed above were performed when worms were fed B. subtilis instead of E. coli (Figure 5B). 640 genes showed significantly higher expression when B. subtilis fed worms were maintained at 15ºC relative to when worms were maintained at 25ºC. Of these 640 genes, only 10 also showed increased expression when worms were maintained at 15ºC instead of at 20ºC. 8 of these 10 genes were referred to as “exclusively cold” genes as they retained the same expression level when worms were kept at 25ºC or at 20ºC but became up-regulated at physiologically cold temperature (15ºC) (Figure 5B and Supplementary Table 8). The vast majority of genes that showed a significantly higher expression when B. subtilis fed worms were maintained at 15ºC as compared to when maintained at 25ºC can be considered “false cold” genes as they were down-regulated in worms kept at 25ºC relative to either worms kept at 20ºC or at 15ºC (Figure 6B, Supplementary Table 9).
Maintaining worms at 15ºC on an E. coli diet led to a mild activation of protein catabolism genes (Figure 5). However, when worms were maintained at 15oC on the B. subtilis diet, we observed a strong activation of genes involved in the defense response (Figure 5). We did not observe a common set of genes whose expression increased in both, E. coli and B. subtilis fed worms when these were maintained at 15oC (Figure 5). It is important to highlight that the transcriptional activation response that we detected when worms were maintained at physiologically cold temperature (15ºC) was much less prominent than that of worms maintained at physiologically hot temperature (25ºC) and that the transcriptional response to temperature, either to cold (15oC) or hot (25oC), was strongly dependent on the tested diets.
Analysis of the down-regulated genes when worms were maintained at 25ºC, (“false cold” genes) showed a statistically significant (RF: 11.3, p < 2.4e-215) common response for E. coli and B. subtilis fed worms. Functional analysis of the 255 common “false cold” genes reflects enrichment in different aspects of protein metabolism such as synthesis, modification or degradation. In addition, amide metabolism genes showed a significant down-regulation when worms were maintained at 25ºC. Other biological processes such as those related to DNA replication or transcription were also down-regulated when worms were kept at 25ºC (Figure 6 and Supplementary Table 10). Analysis of “false hot” genes, (genes that are down-regulated when worms were kept at 15ºC) also showed a significant common response in both, E. coli and B. subtilis fed nematodes (RF: 8.3, p < 8.6e-92). However, gene down-regulation when worms were kept at 15ºC was less prominent than when worms were kept at 25ºC (Figure 4 and Supplementary Table 11). Our bioinformatics analyses did not reveal a clear enrichment in any biological processes for the down-regulated genes in worms maintained at 15ºC.
Taken together, our results suggest the existence of a transcriptional regulation at physiologically hot (25oC) temperature. This transcriptional response causes both up-regulation as well as down-regulation of specific sets of genes. The transcriptomic response of worms maintained at physiologically cold temperature (15oC) is milder than that of worms maintained at hot temperature (25oC) and is also dependent on the tested diets.
The C. elegans transcriptome is strongly influenced by the diet
To understand the effect of the diet (E. coli versus B. subtilis) on the C. elegans transcriptome, we performed pairwise comparisons of gene expression datasets for worms grown at the same temperature on each diet. We identified specific sets of genes that showed a statistically significant higher expression when the nematodes were fed on E. coli compared to B. subtilis at the three tested temperatures, 15ºC, 20ºC, and 25ºC (Figure 7A and Supplementary Table 12). In the same way, we identified those genes showing a significantly higher expression on a B. subtilis diet at the three tested temperatures (Figure 7B, Supplementary Table 13).
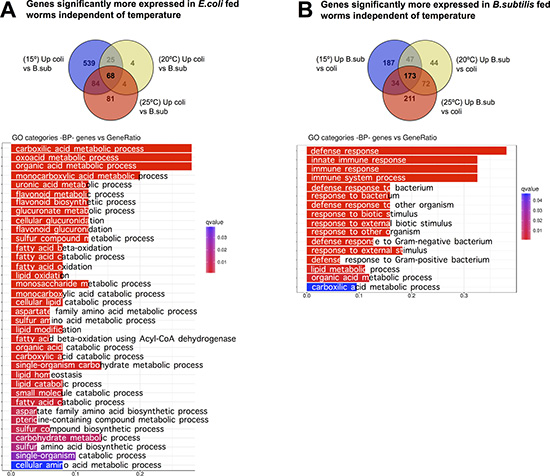
Figure 7: Diet effect on the C. elegans transcriptome. (A) Pairs comparisons of gene expression in nematodes fed each diet at different temperatures shows that 68 genes exhibit significantly higher expression on an E. coli diet independently of the growing temperature. Functional analysis of these genes revealed enrichment of biological processes such as: metabolism of organic acids, metabolism of flavonoids, and glucuronidation or lipid metabolism. (B) Pairs comparisons of gene expression in nematodes fed each diet at different temperatures shows that 173 genes exhibit significantly higher expression on a B. subtilis diet than on an E. coli diet, independently of the growing temperature. This group was predominant enrichment in biological defense processes. Gene Ontology (GO) Biological Processes (BP) vs number of genes within each category appears represented in color bars, one bar per GO term. The length of the bars indicates the number of genes belonging to the different GO categories and the color indicates the statistical significance, from those with highly significant expression difference (red) to those with low expression difference (blue).
Functional analysis of the 68 genes significantly more expressed in worms fed on E. coli revealed enrichment of biological process such as metabolism of organic acids, metabolism of flavonoids, glucuronidation or lipid metabolism (Figure 7A). Strikingly, analysis of the 173 significantly more expressed genes in worms fed on B. subtilis showed predominant enrichment of biological defense processes (Figure 7B).
DISCUSSION
Genetic expression of the nematode C. elegans in the lab is influenced by a wide variety of factors including the developmental stage of the worms [28] and the chronological age of the animals [30]. Thus, when using C. elegans to study biological phenomena, it is key to provide uniformity in the worm growing conditions.
Even though 20ºC is considered the standard temperature for growing C. elegans in the lab, studies are often performed at other temperatures within the 15ºC–25ºC worm physiological range. Moreover, the standard diet of C. elegans in the lab is the Gram-negative bacterium E. coli. However, a number of studies have been published in which the Gram positive bacterium B. subtilis is used as an alternative worm diet. Little is known about the global transcriptional response of C. elegans to temperature, different bacterial food sources and the crossed response to growth temperature and diet. In our study we wanted to investigate the impact that growing worms at different physiological temperatures (15oC, 20oC, and 25oC) while fed two different diets (E. coli and B. subtilis) exert on the C. elegans transcriptome.
Genome-wide expression analyses have revealed the influence of temperature on processes such as environment-induced plastic response [31] or interactions with toxicants [32]. These studies have been carried out at temperatures in both extremes of the physiological range (~15ºC and ~25ºC) and, together with others, revealed that temperature changes indeed affect the C. elegans response to various biological phenomena such as locomotion, chemotaxis, detoxification, metabolism or aging [33–35]. C. elegans studies performed at temperatures within the 15ºC–25oC physiological range thus have the potential to elicit different biological responses by the worm, yet results and conclusions from studies at different temperatures are often compared.
C. elegans is a bacteriovore and the standard diet used to maintain worms in the lab is E. coli. Recent studies have indicated that a common cause of death for worms grown under normal lab conditions is pathogenicity from the ingested E. coli food [8]. In fact, E. coli is not a bacterium type that worms typically encounter in the wild [4–5]. The use of E. coli as C. elegans food responds purely to historical reasons, as E. coli was a commonly used and easy to maintain bacterium at the time C. elegans was developed as a model organism [2].
In the last few years, different studies have focused on the characterization of wild bacterial food sources and their impact on C. elegans metabolism [36–38]. For example, the Gram-positive bacterium B. subtilis has been used as an alternative worm diet in a number of studies. While equally nutritious to the worm [11], E. coli is mildly pathogenic whereas B. subtilis is not pathogenic [39].
Our transcriptomic analyses did not detect global or massive C. elegans gene expression alterations when worms were maintained at 15ºC, 20ºC, or 25ºC. This is not a surprising result as these are temperatures within the C. elegans physiological range. However, we detected that the C. elegans transcriptomic response to temperature was highly dependent on the E. coli and B. subtilis diet type.
Gene expression when worms were maintained at 20ºC was referred as the control temperature. We considered a gene to be up-regulated at a given temperature when its expression was significantly higher relative to the 20ºC control and the other assayed temperature. These genes were grouped as either “exclusively hot” or “exclusively cold” genes. However, we found that for worms maintained at 15ºC or at 25ºC gene down-regulation was a more prevalent phenomenon than gene up-regulation. Down-regulated genes were grouped as either “false hot” or “false cold” genes. The presence of up- and down-regulated groups of genes suggests that both, transcription induction and well as transcription repression play a role in the adaptation of worms to physiological temperature variations.
We validated the activation/repression of our transcriptomic dataset by RT-qPCR and fluorescent reporters demonstrating that at least some of the temperature responsive genes of our study could be used as in vivo “biological thermometer” biomarkers. Thus, genes from our data set might be useful to study genetic pathways involved in the worm adaptation to different environmental temperature conditions.
We found significant differences in the transcription patterns of specific gene sets, which indicate the existence of a transcriptional response to adapt the animal’s metabolism and defense system to the growth temperature. This temperature induced transcriptional response was highly dependent on the bacterial type used as food source. When grown on an E. coli diet, C. elegans showed a significantly higher expression of genes involved in lipid metabolism, carboxylic acid metabolism, and glucuronidation of different compounds than when worms were grown on the B. subtilis diet regardless of the maintenance temperature (Figure 7). This result likely reflects nurturing and detoxification adaptations by C. elegans to the particular molecular composition of E. coli, a diet that worms are not likely to encounter in the wild [40].
E. coli are Gram-negative bacteria. Thus, the E. coli cell envelope is essentially composed of an outer lipid bilayer membrane, a peptidoglycan cell wall and another inner lipid bilayer membrane [41]. B. subtilis are Gram-positive bacteria, consequently they lack the outer lipid membrane [42]. Despite cell structure differences, B. subtilis and E. coli have been reported to have a similar caloric content as the main calorie contribution is conferred by proteins and carbohydrates and not by the lipid fraction [11]. It is however plausible that the different lipid composition and distribution found in these two types of bacteria, 80% of phosphatidylethanolamine in the membrane lipids of E. coli versus 12% in B. subtilis [40], causes up-regulation of specific sets of genes required for E. coli digestion and metabolism of its components such as carboxylic acids.
In addition to lipid metabolism, when fed an E. coli diet, C. elegans enhances expression of genes involved in glucuronidation of specific substrates. Glucuronidation is driven by ugt (UDP Glycosyltransferase) genes (Figure 7). These genes encode enzymes that catalyze the linkage of glucuronic acid to specific substrates. The glucuronic acid group modifies the substrate properties and terminates their biological actions by promoting their elimination. Therefore, glucuronidation is involved in detoxification of compounds and metabolites that cause a detrimental effect to the organism [43]. Among the substrates of UGTs is the quinone Coenzyme Q (CoQ). CoQ and its metabolites play fundamental redox roles in living organisms such as being a crucial mitochondrial electron transport chain carrier or conferring antioxidant protection to cell membrane components [44–45]. However, excessive CoQ redox activity leads to toxic effects thus CoQ must be maintained at physiological levels by balancing its rate of synthesis and degradation [46–47]. Interestingly, C. elegans and E. coli, but not B. subtilis, synthesize their own coQ [11]. Thus, when C. elegans are fed an E. coli diet, worms uptake additional CoQ produced by the bacterial diet [48]. In contrast, B. subtilis does not synthesize CoQ. Accordingly, when we maintained C. elegans on a B. subtilis diet we did not observe activation of pathways involved in CoQ elimination.
B. subtilis fed worms live substantially longer than worms grown on E. coli [6] and these diets appear to induce different causes of death to the worms [8, 49]. It has been recently proposed that the C. elegans life span difference observed when the worm diet is changed from the standard E. coli to B. subtilis is mainly due to the persistent antioxidant effect of CoQ present in the E. coli diet, which leads to an imbalance in cellular REDOX homeostasis [11]. Feeding worms E. coli or B. subtilis diets can considerably affect the life span of the worms, consequently E. coli fed worms will display an older physiological age than B. subtilis fed worms with the same chronological age. To minimize this issue, all our transcriptomic comparisons were performed using synchronized adult nematodes of very young chronological age (1 day old).
As stated above, B. subtilis is a less pathogenic diet than E. coli and worms fed this diet live longer than E. coli fed worms [6]. A counterintuitive observation arising from our transcriptomic analysis is the higher expression of genes involved in the defense response when worms were fed B. subtilis instead of E. coli (Figure 7). B. subtilis cells sporulate while E. coli do not. B. subtilis spores are not digestible, thus it is possible that B. subtilis spores induce up-regulation of defense mechanism pathways by C. elegans. Moreover, B. subtilis may provide factors involved in molecular signaling not present in E. coli, which could contribute to up-regulation of stress resistance and defense mechanisms. An example of such a factor is nitric oxide. Nitric oxide is produced by B. subtilis but not by E. coli. C. elegans lack the enzymes necessary to produce their own nitric oxide. Gusarov et al. showed that nitric oxide signaling upon B. subtilis feeding leads to enhanced C. elegans longevity and stress resistance [50]. These signaling differences upon B. subtilis feeding could also explain the fact that genetic and environmental interventions that affect C. elegans longevity by affecting different molecular pathways do not always lead to the same effects when worms are fed E. coli or B. subtilis [11].
Analysis of Motif Enrichment (AME) (http://meme-suite.org) of the promoter region of the 71 “exclusively hot” genes (activated at 25oC on both diets) reveals enrichment on motifs recognized by the MDL-1 and HLH-15 (Supplementary Figure 1). This suggests that transcriptional regulation at this temperature might be mediated by the action of these transcription factors. MDL-1 and HLH-15 are both helix-loop-helix transcription factors and have been described to have regulatory functions in processes such as pathogen defense [51], longevity [52–53] and metabolism [54]. Interestingly, the transcriptomic response of worms maintained at different temperatures is the opposite for E. coli fed worms compared to B. subtilis fed worms. When worms are grown on E. coli and the temperature is increased to 25oC, we observed an enhancement of defense response gene expression and decreased expression of genes associated with metabolic functions. However, when worms are grown on B. subtilis and the temperature is increased to 25oC, C. elegans decreased defense response gene expression and enhanced expression of genes associated with metabolic functions (Figure 8). These results indicate that the effect of the diet on the worm transcriptome can be modulated by fluctuations in the physiological temperature range of the worm.
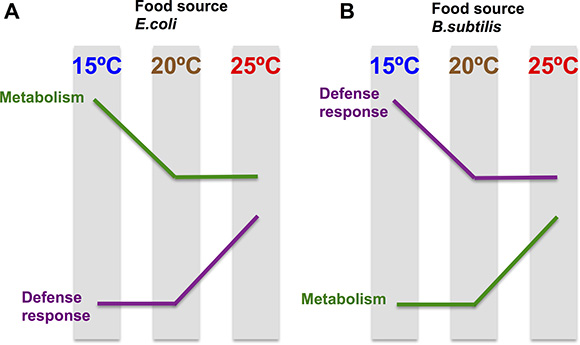
Figure 8: The transcriptomic temperature response is opposite in nematodes grown on an E. coli diet vs a B. subtilis diet. (A) E. coli fed worms enhance defense response gene expression and decrease expression of genes associated with metabolic functions when the maintenance temperature increases. Genes involved in metabolism are significantly up-regulated in E. coli fed worms compared to B. subtilis fed worms, independently of the tested temperature. (B). B. subtilis fed worms decrease defense response gene expression and enhance expression of genes associated with metabolic functions when the maintenance temperature increases. Genes involved in defense response are significantly up-regulated in B. subtilis fed worms compared to E. coli fed worms, independently of the tested temperature.
The worm transcriptional response to temperature might also be influenced by the growth efficiency of the bacterial diet. For example, the optimal growth temperature for bacteria is higher than that of C. elegans: 37ºC for E. coli [55], and 28–35ºC for B. subtilis (www.atcc.org) compared to 20oC for C. elegans. Therefore, when worms are grown at 25oC, the temperature is closer to the optimal temperature for bacterial growth than at 20oC or at 15oC. This could explain why when C. elegans are maintained at a higher temperature in the more pathogenic E. coli diet, the nematode activates transcription of genes involved in the immune defense system. Under these adverse conditions metabolism is down-regulated. In contrast, when worms are grown on a non-pathogenic diet, optimal growth conditions for the bacterial food source correlate with an up-regulation of genes involved in metabolism to ensure proper nutrition and growth.
In summary, we report that C. elegans undergo significant transcriptomic changes when maintenance temperature fluctuates between the physiologically accepted experimental range. Our data also show that the C. elegans transcriptional response to temperature highly depends on the bacterium type used as lab diet. Altogether, our results suggest an adaptive mechanism of the nematode metabolism to the different composition and toxicity of the food sources and temperature growth conditions. This mechanism might be conserved through evolution and would ensure animal survival in a changing environment.
MATERIALS AND METHODS
Strains and growth conditions
Wild-type (N2) nematodes and the transgenic strain AY101: cIs101 [F35E12.5p::GFP + rol-6(su1006)] were obtained from the Caenorhabditis Genetic Center (CGC, University of Minnesota) and immediately stored as frozen stocks to minimize the genetic drift that may happen in isolated populations growing along the time [12]. Worms were thawed and grown under standard conditions (http://www.wormbook.org) on NGM plates seeded with E. coli OP50 or B. subtilis PY79 as food source, and incubated at 15ºC, 20ºC and 25ºC during at least 3 generations before starting the experiments. After that, worm populations were synchronized by “bleaching” with hypochlorite solution, maintained in M9 medium during 20 hours to allow hatching eggs and synchronization at the first larval stage (L1) [13]. Then, worms were grown at the corresponding temperatures and bacteria diet until day 1 of adulthood, at the beginning of egg laying (120h at 15ºC, 84h at 20ºC, 60h at 25ºC). To conduct experiments, 5–7 ml of distilled water was poured on to each plate of worms and gently swirled for 10 seconds to wash the worms off the plate. The water containing the worms was then transferred to a 50 ml centrifuge tube and the worms were allowed to settle to the bottom of the tube. The worms were washed with fresh distilled water 2–3 times to remove bacteria and other food sources. The worm sediment was used for the subsequent RNA extraction. Experiments were performed in triplicate to provide a statistical value for gene expression comparison between the different conditions (Figure 1A).
RNA extraction
RNA from C.elegans cultured at 15ºC, 20ºC and 25ºC feeding E. coli OP50 or B. subtilis PY79 diet was isolated using an RNeasy Mini kit and treated with DNase I (Qiagen) following the manufacturer’s instructions. Integrity and concentration of RNA was determined using the Experion™ automated electrophoresis system (Bio-Rad). RNA with an integrity value > 8.9 underwent further analysis.
cDNA library preparation and ultrasequencing
Sequencing libraries were prepared by following the TruSeq RNA Library (LS) Preparation Kit v2 (Illumina Inc.) from 500 ng of mRNA. All libraries were run in a HiSeq 1500 PE100 lane in Rapid mode, pooled in equimolar amounts to a 10 nM final concentration. Library concentration was measured via qPCR using the KAPA library quantification kit for Illumina sequencing platforms (Kapa Biosystems) before high throughput sequencing.
Validation of the sequencing results
Gene products with significant expression differences at 15ºC and 25ºC (T05E11.9, nex-1 and D2045.2) underwent further confirmation by Real-Time PCR. 500 ng from each RNA extraction was DNAse treated (Promega) and reverse transcribed with SuperScript III First-Strand Synthesis kit (Invitrogen) in a total volume of 20 microlitres according to the manufacturer’s instructions. The mRNA quantification was performed by Real Time-PCR using Power SYBR Green Master Mix (ThermoFisher Scientific) and specific primers in a 7300 quantitative Real Time PCR System (Applied Biosystems, Carlsbad, CA). Normalization to actins’ expression (act-1) was used to calculate relative expression. The experiments were repeated in three independent replicas. Primers pairs used for RT-qPCR were: T05E11.9 Fw: TTTGGAGTGCCCCTGTATGT; T05E11.9 Rv: ATGCTCTTCCAACCAGACGA; ZC155.1 Fw: TGTCAACGTCATCACCTCGA; ZC155.1 Rv: TCCCTTCATGGCAGCCTTAA;D2045.2 Fw: GGAAGCGATTCTCCGTGTTC; D2045.2 Rv: CAACGACAGGCAGAATCTCGact-1 Fw: CCGAGCGTGGTTACTCTTTC; act-1 Rv: GCGATTTCTTGCTCGAAGTC.
Bioinformatic analysis
The quality of RNA-seq results was firstly assessed using FastQC (http://www.bioinformatics.babraham.ac.uk/projects/fastqc/). The raw reads were trimmed, filtered with a Phred quality score of at least 25 and all adapters removed with Trimmomatic software [14].
Clean reads were aligned versus the N2 Caernohabditis elegans reference genome (release WBcel235.85, http://www.ensembl.org/Caenorhabditis_elegans/Info/Index) by using Tophat2 [15] with default parameters. Resulting alignment files were quality assessed with Qualimap2 [16] and sorted and indexed with Samtools software [17]. After read count on gene features with the FeatureCounts tool [18], quantitative differential expression analysis between conditions was performed both by DESeq2 [19] and edgeR [20] implementations, to compare all groups in pairs to analyze the effect of the two variables of this study: food sources (E. coli diet vs B. subtilis diet) and growth temperatures (15ºC vs 20ºC vs 25ºC). Both of them, implemented as R Bioconductor packages, perform read-count normalization by following a negative binomial distribution model. In order to automate this process and facilitate all group combination analysis, the SARTools pipeline [21] was used. The resulting data was obtained as an .html file and .csv tables, including density count distribution analysis, pairwise scatter plots, cluster dendrograms, Principal Component Analysis (PCoA) plots, size factor estimations, dispersion plots and MA- and volcano plots. Resulting tables, including raw counts, normalized counts, Fold-Change estimation and dispersion data for each of the analysis methods (DESeq2 and edgeR) were annotated with additional data from Biomart (https://bioconductor.org/packages/release/bioc/html/biomaRt.html), WormBase (http://www.wormbase.org) and org.Ce.eg.db (https://bioconductor.org/packages/release/data/annotation/html/org.Ce.eg.db.html) databases. Final tables also include the associated gene name, Ensembl Transcript and protein information, GO Term ID and names, EntrezID, UniprotTrEMBL information and Human ortolog ID and gene name data. Normalized values for each gene were graphically represented into barplots for all samples under different temperature and feeding conditions.
To control the False Discovery Rate (FDR), p-values were amended by Benjamini-Hochberg (BH) multiple testing correction [22]. Those features showing corrected p-values below a 0.05 threshold were considered as significantly up- or down-regulated genes. In order to reinforce downstream analysis and discard false-positive over/under-expressed genes, common up- and down-regulated features were extracted from DESeq2 and edgeR tables. The CRAN packages eVenn (https://CRAN.R-project.org/package = eVenn) and pheatmap (https://CRAN.R-project.org/package = pheatmap) were used to graphically represent Venn diagrams and heatmap plots showing these common features.
Gene Ontology enrichment analysis was performed for common up/down regulated genes by using clusterProfiler package [23] through its enrichGO tool. This tool uses a hypergeometric BH model to obtain adjusted q-values. Each GO category (Biological Process –BP-, Molecular Function –MF, and Cellular Component –CC-) was represented in barplots, showing its relative abundance and associated q-value. Similarly, KEGG and Reactome pathway analysis was conducted by clusterProfiler (enrichKEGG) and ReactomePA [24] tools. The KEGG pathway maps were obtained with Pathview package [25].
The regularized log2 transformation (rlog) data was represented into a 2-dimension Principal Component Analysis (PCA) plot, by tacking DESeq2 expression values (Figure 1B). It shows temperature growing conditions in different colors and food types in different plotting symbols. Sample-to-sample Euclidean distances were calculated from the rld data and represented in a heatmap, showing the adjacent clustering information (Figure 1C).
Statistical analysis
Statistical significance of the overlap between groups of genes was assessed by calculation of the Representation Factor. The Representation Factor (RF) is the number of overlapping genes divided by the expected number of overlapping genes drawn from two independent groups. A representation factor > 1 indicates more overlap than expected of two independent groups; a representation factor < 1 indicates less overlap than expected; and a representation factor of 1 indicates that the two groups overlap by the number of genes expected for independent groups of genes (http://nemates.org/MA/progs/overlap_stats.html).
Author contributions
EGO, EC, AZ, BSN, BE, performed the experiments. MdT, MI, RL, JFSJ, BS, ASB, JCe, JCa analyzed data. ASB, JCe, JCa designed the experiments and wrote the manuscript.
ACKNOWLEDGMENTS
We thank the Caenorhabditis Genetic Center for strains, Dr. Christy Esmahan for critical reading of the manuscript. JCa and JCe are members of European research network Genie.
CONFLICTS OF INTEREST
The authors declare no conflicts of interest.
FUNDING
JCa is supported by a grant from the European RefbioII program (EFA038_Momeneu) and the Rioja Salud Foundation. JCe is supported by a grant from the ISCIII (PI15/00895).
REFERENCES
1. Nicholas WL, Dougherty EC, Hansen EL. Axenic cultivation of C. briggsae (Nematoda: Rhabditidae) with chemically undefined supplements; comparative studies with related nematodes. Ann NY Acad Sci. 1959; 77:218–236.
2. Brenner S. The genetics of Caenorhabditis elegans. Genetics. 1974; 77:71–99.
3. Klass MR. Aging in the nematode Caenorhabditis elegans: major biological and environmental factors influencing life span. Mech Ageing Dev. 1977; 6:413–29.
4. Coolon JD, Jones KL, Todd TC, Carr BC, Herman MA. Caenorhabditis elegans genomic response to soil bacteria predicts environment-specific genetic effects on life history traits. PLoS Genet. 2009; 5:e1000503.
5. Montalvo-Katz S, Huang H, Appel MD, Berg M, Shapira M. Association with soil bacteria enhances p38-dependent infection resistance in Caenorhabditis elegans. Infect Immun. 2013; 81:514–20.
6. Garsin DA, Villanueva JM, Begun J, Kim DH, Sifri CD, Calderwood SB, Ruvkun G, Ausubel FM. Long-lived C. elegans daf-2 mutants are resistant to bacterial pathogens. Science. 2003; 300:1921.
7. Hahm JH, Kim S, Paik YK. GPA-9 is a novel regulator of innate immunity against Escherichia coli foods in adult Caenorhabditis elegans. Aging Cell. 2011; 10:208–19.
8. Sánchez-Blanco A, Kim SK. Variable pathogenicity determines individual lifespan in Caenorhabditis elegans. PLoS Genet. 2011; 7:e1002047.
9. Cabreiro F, Gems D. Worms need microbes too: microbiota, health and aging in Caenorhabditis elegans. EMBO Mol Med. 2013; 5:1300–10.
10. Lezzerini M, van de Ven K, Veerman M, Brul S, Budovskaya YV. Specific RNA Interference in Caenorhabditis elegans by Ingested dsRNA Expressed in Bacillus subtilis. PLoS One. 2015; 10:e0124508.
11. Sánchez-Blanco A, Rodríguez-Matellán A, González-Paramás A, González-Manzano S, Kim SK, Mollinedo F. Dietary and microbiome factors determine longevity in Caenorhabditis elegans. Aging (Albany NY). 2016; 8:1513–39. https://doi.org/10.18632/aging.101008.
12. Weber KP, De S, Kozarewa I, Turner DJ, Babu MM, de Bono M. Whole genome sequencing highlights genetic changes associated with laboratory domestication of C. elegans. PLoS One. 2010; 5:e13922.
13. Porta-de-la-Riva M, Fontrodona L, Villanueva A, Cerón J. Basic Caenorhabditis elegans methods: synchronization and observation. J Vis Exp. 2012; 10:e4019. https://doi.org/10.3791/4019.
14. Bolger AM, Lohse M, Usadel B. Trimmomatic: a flexible trimmer for Illumina sequence data. Bioinformatics. 2014; 30:2114–2120.
15. Kim D, Pertea G, Trapnell C, Pimentel H, Kelley R, Salzberg SL. TopHat2: accurate alignment of transcriptomes in the presence of insertions, deletions and gene fusions. Genome Biol. 2013; 14:R36.
16. Okonechnikov K, Conesa A, García-Alcalde F. Qualimap 2: advanced multi-sample quality control for high-throughput sequencing data. Bioinformatics. 2016; 32:292–294.
17. Li H, Handsaker B, Wysoker A, Fennell T, Ruan J, Homer N, Marth G, Abecasis G, Durbin R, and 1000 Genome Project Data Processing Subgroup. The Sequence Alignment/Map format and SAMtools. Bioinformatics. 2009; 25:2078–2079.
18. Liao Y, Smyth GK, Shi W. featureCounts: an efficient general purpose program for assigning sequence reads to genomic features. Bioinformatics. 2014; 30:923–30.
19. Love MI, Huber W, Anders S. Moderated estimation of fold change and dispersion for RNA-seq data with DESeq2. Genome Biol. 2014; 15:550.
20. Robinson MD, McCarthy DJ, Smyth GK. edgeR: a Bioconductor package for differential expression analysis of digital gene expression data. Bioinformatics. 2010; 26:139–140.
21. Varet H, Brillet-Guéguen L, Coppée JY, Dillies MA. SARTools: A DESeq2- and EdgeR-Based R Pipeline for Comprehensive Differential Analysis of RNA-Seq Data. PLoS One. 2016; 11:e0157022.
22. Benjamini Y, Hochberg Y. Controlling the false discovery rate: a practical and powerful approach to multiple testing. J R Stat Soc B. 1995; 57:289–300. 1995; 57:289–300.
23. Yu G, Wang LG, Han Y, He QY. clusterProfiler: an R package for comparing biological themes among gene clusters. OMICS. 2012; 16:284–87.
24. Yu G, He QY. ReactomePA: an R/Bioconductor package for reactome pathway analysis and visualization. Mol Biosyst. 2016; 12:477–79.
25. Luo W, Brouwer C. Pathview: an R/Bioconductor package for pathway-based data integration and visualization. Bioinformatics. 2013; 29:1830–1831.
26. Hillier LW, Marth GT, Quinlan AR, Dooling D, Fewell G, Barnett D, Fox P, Glasscock JI, Hickenbotham M, Huang W, Magrini VJ, Richt RJ, Sander SN, et al. Whole-genome sequencing and variant discovery in C. elegans. Nat Methods. 2008; 5:183–88.
27. Sarin S, Prabhu S, O’Meara MM, Pe’er I, Hobert O. Caenorhabditis elegans mutant allele identification by whole-genome sequencing. Nat Methods. 2008; 5:865–67.
28. Gerstein MB, Lu ZJ, Van Nostrand EL, Cheng C, Arshinoff BI, Liu T, Yip KY, Robilotto R, Rechtsteiner A, Ikegami K, Alves P, Chateigner A, Perry M, et al, and modENCODE Consortium. Integrative analysis of the Caenorhabditis elegans genome by the modENCODE project. Science. 2010; 330:1775–1787.
29. Schmittgen TD, Livak KJ. Analyzing real-time PCR data by the comparative CT method. Nat Protoc. 2008; 3:1101–1108.
30. Budovskaya YV, Wu K, Southworth LK, Jiang M, Tedesco P, Johnson TE, Kim SK. An elt-3/elt-5/elt-6 GATA transcription circuit guides aging in C. elegans. Cell. 2008; 134:291–303.
31. Li Y, Alvarez OA, Gutteling EW, Tijsterman M, Fu J, Riksen JA, Hazendonk E, Prins P, Plasterk RH, Jansen RC, Breitling R, Kammenga JE. Mapping determinants of gene expression plasticity by genetical genomics in C. elegans. PLoS Genet. 2006; 2:e222.
32. Viñuela A, Snoek LB, Riksen JA, Kammenga JE. Gene expression modifications by temperature-toxicants interactions in Caenorhabditis elegans. PLoS One. 2011; 6:e24676.
33. Yamada Y, Ohshima Y. Distribution and movement of Caenorhabditis elegans on a thermal gradient. J Exp Biol. 2003; 206:2581–2593.
34. Adachi R, Wakabayashi T, Oda N, Shingai R. Modulation of Caenorhabditis elegans chemotaxis by cultivation and assay temperatures. Neurosci Res. 2008; 60:300–306.
35. Fielenbach N, Antebi A. C. elegans dauer formation and the molecular basis of plasticity. Genes Dev. 2008; 22:2149–2165.
36. Frézal L, Félix MA. C. elegans outside the Petri dish. eLife. 2015; 4:4.
37. Dirksen P, Marsh SA, Braker I, Heitland N, Wagner S, Nakad R, Mader S, Petersen C, Kowallik V, Rosenstiel P, Félix MA, Schulenburg H. The native microbiome of the nematode Caenorhabditis elegans: gateway to a new host-microbiome model. BMC Biol. 2016; 14:38.
38. Samuel BS, Rowedder H, Braendle C, Félix MA, Ruvkun G. Caenorhabditis elegans responses to bacteria from its natural habitats. Proc Natl Acad Sci U S A. 2016; 113:E3941–9.
39. Partridge L, Gems D. Benchmarks for ageing studies. Nature. 2007; 450:165–7.
40. Epand RF, Savage PB, Epand RM. Bacterial lipid composition and the antimicrobial efficacy of cationic steroid compounds (Ceragenins). Biochim Biophys Acta. 2007; 1768:2500–09.
41. Schnaitman CA. Protein composition of the cell wall and cytoplasmic membrane of Escherichia coli. J Bacteriol. 1970; 104:890–901.
42. Silhavy TJ, Kahne D, Walker S. The Bacterial Cell Envelope. Cold Spring Harb Perspect Biol. 2010; 2:a000414.
43. Rowland A, Miners JO, Mackenzie PI. The UDP-glucuronosyltransferases: Their role in drug metabolism and detoxification. Int J Biochem Cell Biol. 2013; 45:1121– 1132.
44. Gavilán A, Asencio C, Cabello J, Rodríguez-Aguilera JC, Schnabel R, Navas P. C. elegans knockouts in ubiquinone biosynthesis genes result in different phenotypes during larval development. Biofactors. 2005; 25:21–29.
45. Asencio C, Navas P, Cabello J, Schnabel R, Cypser JR, Johnson TE, Rodríguez-Aguilera JC. Coenzyme Q supports distinct developmental processes in Caenorhabditis elegans. Mech Ageing Dev. 2009; 130:145–153.
46. Thelin A, Schedin S, Dallner G. Half-life of ubiquinone-9 in rat tissues. FEBS Lett. 1992; 313:118–120.
47. Shangari N, Chan TS, O’Brien PJ. Sulfation and Glucuronidation of Phenols: Implications in Coenyzme Q Metabolism. Methods Enzymol. 2005; 400:342–359.
48. Kwon O, Kotsakis A, Meganathan R. Ubiquinone (coenzyme Q) biosynthesis in Escherichia coli: identification of the ubiF gene. FEMS Microbiol Lett. 2000; 186:157–161.
49. McGee MD, Weber D, Day N, Vitelli C, Crippen D, Herndon LA, Hall DH, Melov S. Loss of intestinal nuclei and intestinal integrity in aging C. elegans. Aging Cell. 2011; 10:699–710.
50. Gusarov I, Gautier L, Smolentseva O, Shamovsky I, Eremina S, Mironov A, Nudler E. Bacterial nitric oxide extends the lifespan of C. elegans. Cell. 2013; 152:818–30.
51. Botts MR, Cohen LB, Probert CS, Wu F, Troemel ER. Microsporidia Intracellular Development Relies on Myc Interaction Network Transcription Factors in the Host. G3 2016; 6:2707–16.
52. Johnson DW, Llop JR, Farrell SF, Yuan J, Stolzenburg LR, Samuelson AV. The Caenorhabditis elegans Myc-Mondo/Mad complexes integrate diverse longevity signals. PLoS Genet. 2014; 10:e1004278.
53. Nakamura S, Karalay Ö, Jäger PS, Horikawa M, Klein C, Nakamura K, Latza C, Templer SE, Dieterich C, Antebi A. Mondo complexes regulate TFEB via TOR inhibition to promote longevity in response to gonadal signals. Nat Commun. 2016; 7:10944.
54. Mansfeld J, Urban N, Priebe S, Groth M, Frahm C, Hartmann N, Gebauer J, Ravichandran M, Dommaschk A, Schmeisser S, Kuhlow D, Monajembashi S, Bremer-Streck S, et al. Branched-chain amino acid catabolism is a conserved regulator of physiological ageing. Nat Commun. 2015; 6:10043.
55. Raghubeer EV, Matches JR. Temperature range for growth of Escherichia coli serotype O157:H7 and selected coliforms in E. coli medium. J Clin Microbiol. 1990; 28:803–5.