
INTRODUCTION
According to the Cancer Statistics 2017, colorectal cancer (CRC) is the third most frequently diagnosed cancer, with 135,430 estimated new cases and 50,260 estimated deaths in 2017 occur in the United States [1]. The adenoma-carcinoma sequence represents the process by which most CRC has increased [2]. Thus, focusing on CRA risk factors is important to enhance our understanding of colorectal carcinogenesis. Recently, an increasing number of studies have focused on dietary factors [3, 4]. The continuously updated project report of the World Cancer Research Fund/American Institute for Cancer Research (WCRF/AICR) has classified red and processed meat intakes as “convincing evidence” for CRC [5, 6]. However, the associations between red meat and processed meat intake and CRA risk have been unclear. Two systematic analyses [7, 8] on the associations have been reported worldwide in which studies published up to 2011 were included, and showed that increased intake of red and processed meat was associated with increased CRA risk. Nevertheless, several high-quality studies [9–11] have appeared during the last 5 years (approximately) and did not support the conclusion of the systematic analyses. An updated meta-analysis of the literature could clarify the impact of these recent studies. Furthermore, no systematic review or meta-analysis has been performed to assess the association between red and processed meat intake and colorectal adenoma recurrence to date. Thus, considering the high incidence and fatality of CRC and the limited evidence of CRA, we performed a systematic review and meta-analysis with the following objectives: (1) to evaluate the associations between red and processed meat intake and CRA incidence and recurrence; (2) to assess the dose-response associations between red and processed meat intake and CRA risk; and (3) to further provide detailed subgroup analyses of studies and evidence according to subtype analyses of meat.
RESULTS
Literature selection, study characteristics and quality scores
Twenty-seven studies met the criteria and provided 34 separate estimates (red meat, 24; and processed meat, 10) for CRA incidence, and 20 separate estimates (red meat, 10; and processed meat, 10) for CRA recurrence (Figure 1). The included studies were from 9 countries or regions in America, Europe and Asia with 208,117 participants and 19,150 cases. The NOS scores ranged from 6 to 9 (Table 1) [9–35].
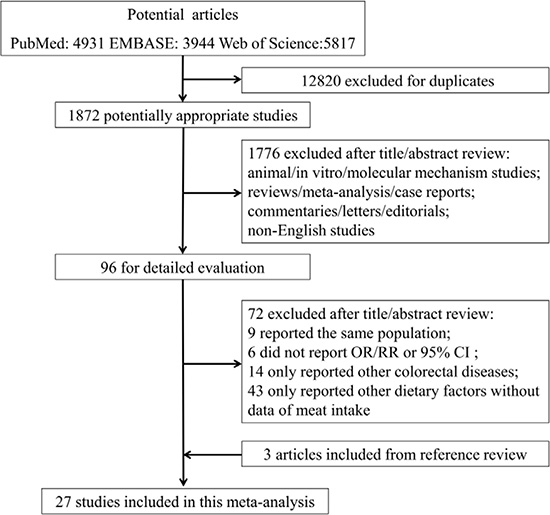
Figure 1: Flowchart of process for identification of relevant studies.
Table 1: Baseline characteristics of included studies for meat intake and colorectal adenomas risk
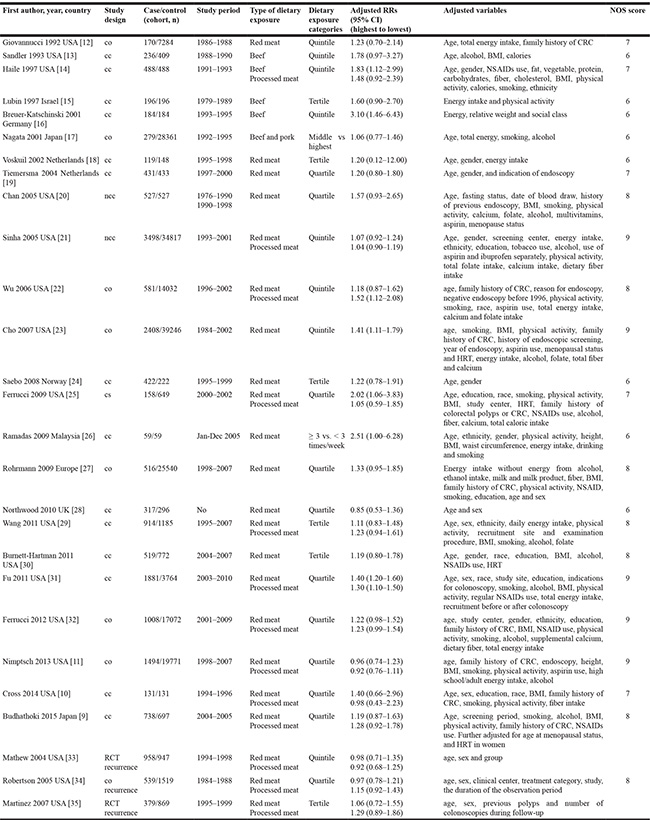
CRC: colorectal cancer; RCT: randomized controlled trial; co: cohort; ncc: nested case-control; cc: case-control; cs: cross-sectional; RRs: relative risks; 95% CI: 95% confidence intervals; BMI: body mass index; NSAIDs: nonsteroidal anti-inflammatory drugs; HRT: hormone replacement therapy.
Red meat
Highest vs lowest intake
Twenty-five studies were included, and a fixed-effects model yielded positive results (RR = 1.23, 95% CI = 1.15–1.31) with low heterogeneity (P = 0.10, I2 = 28%) (Figure 2, Table 2). Similarly, the subgroup analyses showed that the differences in the RRs were not significant (P > 0.05) for sample size, publication year and all adjustments (smoking, alcohol, BMI, physical activity, energy intake, dietary fiber intake, family history of CRC/polyps and nonsteroidal anti-inflammatory drugs) (Supplementary Table 1).
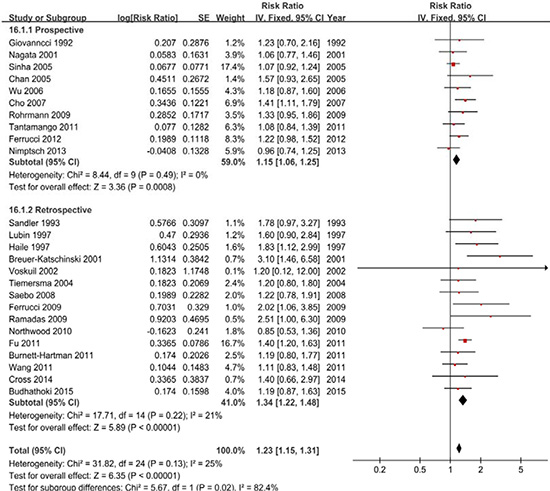
Figure 2: A forest plot of red meat intake and colorectal adenoma incidence.
Table 2: Analyses of colorectal adenoma locations and subtype analyses of meat for meat intake and colorectal adenoma incidence
N |
RR (95% CI) |
PO |
Ph |
Ih2 (%) |
|
|---|---|---|---|---|---|
Red meat |
|||||
Total adenoma |
25 |
1.23 (1.15–1.31) |
< .01 |
.13 |
25 |
Proximal colon adenoma |
3 |
1.17 (0.89–1.54) |
.27 |
.51 |
0 |
Distal colon adenoma |
10 |
1.20 (1.09–1.33) |
< .01 |
.39 |
6 |
Rectal adenoma |
4 |
1.16 (0.93–1.46) |
.19 |
.76 |
0 |
Red meat/white meat |
4 |
1.55 (1.10–2.20) |
.01 |
.03 |
66 |
Processed meat |
|||||
Total adenoma |
10 |
1.15 (1.07–1.24) |
< .01 |
.10 |
39 |
Proximal colon adenoma |
0 |
- |
- |
- |
- |
Distal colon adenoma |
4 |
1.34 (1.11–1.63) |
< .01 |
.31 |
4 |
Rectal adenoma |
2 |
0.93 (0.73–1.20) |
.58 |
.39 |
0 |
Subtype analyses of meat |
|||||
Beef |
7 |
1.45 (1.12–1.89) |
< .01 |
.05 |
52 |
Bacon |
3 |
1.06 (1.03–1.31) |
.02 |
.73 |
0 |
NOTE. Boldface indicates statistical significance.
CRA: colorectal adenoma. N: number of included studies. PO: test for over effect. Ph: P value for heterogeneity within each subgroup. Is2: I2 value for heterogeneity within each subgroup.
CRA locations
We further examined the associations between red meat intake and the CRA location. Ten studies were included and the analyses suggested significantly different results, with positive results for distal colon adenoma (RR = 1.21, 95% CI = 1.09–1.34) and negative results for proximal colon adenoma (RR = 1.17, 95% CI = 0.89–1.54) and rectal adenoma (RR = 1.16, 95% CI = 0.93–1.46) (Table 2).
Dose-response analysis
Eighteen studies were included, and the results of 1.14 (1.07–1.20) suggested that the CRA incidence increases by 14% for each 100 g/day increase in red meat intake (P < 0.01). Furthermore, we checked for nonlinearity of the dose-response relationship and the evidence showed that the best-fitting model was nonlinear model (Pnonlinearity < 0.01) (Supplementary Figure 3A).
Publication bias
The funnel plot (Supplementary Figure 4A) and Egger’s test (P = 0.94) did not suggest significant evidence of publication bias. The sensitivity analyses of the highest vs lowest categories showed that the changes in the recalculated RRs were not significant, with a range from 1.19 (1.11–1.28) when excluding Fu 2011 [31] (17.1%) to 1.26 (1.18–1.36) when excluding Sinha 2005 [21] (17.8%).
Subtype analysis
Beef intake was examined in 7 studies, and the RR of CRA was 1.45 (1.12–1.89) with heterogeneity (P = 0.05, I2 = 52%) (Table 2). Sensitivity analyses of the highest vs lowest categories also showed that the changes in the recalculated RRs were not significant, with a range from 1.31 (1.06–1.63) when excluding Breuer-Katschinski 2001 [16] (8.9%) to 1.59 (1.19–2.12) when excluding Tiemersma 2004 [19] (19.1%).
Recurrence
Four studies were included in the comparison of the highest vs lowest categories further stratified analysis for each CRA type. A fixed-effects model yielded null results, with 0.99 (0.84–1.16) for total CRA without heterogeneity (P = 0.92, I2 = 0%), 0.99 (0.82–1.20) for advanced CRA without heterogeneity (P = 0.60, I2 = 0%) and 0.93 (0.75–1.14) for multiple CRA with low heterogeneity (P = 0.50, I2 = 0%) (Supplementary Figure 1, Table 3).
Table 3: Analyses of red and processed meat intake and colorectal adenoma recurrence
N |
RR (95% CI) |
PO |
Ph |
Ih2 (%) |
|
|---|---|---|---|---|---|
Red meat |
|||||
Total adenoma |
3 |
0.99 (0.84–1.16) |
.89 |
.92 |
0 |
Advanced adenoma |
4 |
0.99 (0.82–1.20) |
.94 |
.60 |
0 |
Multiple adenoma |
3 |
0.93 (0.75–1.14) |
.48 |
.50 |
0 |
Processed meat |
|||||
Total adenoma |
3 |
1.10 (0.94–1.30) |
.23 |
.33 |
9 |
Advanced adenoma |
4 |
1.14 (0.95–1.37) |
.15 |
.19 |
36 |
Multiple adenoma |
3 |
1.09 (0.73–1.62) |
.69 |
.04 |
69 |
N: number of included studies. PO: test for over effect. Ph: P value for heterogeneity within each subgroup. Is2: I2 value for heterogeneity within each subgroup.
Red meat/white meat
Four studies were included in the ratio of red meat to white meat, and a random-effects model yielded significant results (RR = 1.55, 95% CI = 1.10–2.20) with heterogeneity (P = 0.03, I2 = 66%) (Table 2).
Processed meat
Highest vs lowest intake
Ten studies were included, and a fixed-effects model yielded significant results (RR = 1.15, 95% CI = 1.07–1.24) with low heterogeneity (P = 0.10, I2 = 39%) (Figure 3, Table 2). Similarly, the subgroup analyses showed that the differences in the RRs were not significant (P > 0.05) for sample size, publication year and all adjustments (smoking, alcohol, BMI, physical activity, energy intake, and nonsteroidal anti-inflammatory drugs) excluded dietary fiber intake and family history of CRC/polyps (Supplementary Table 2).
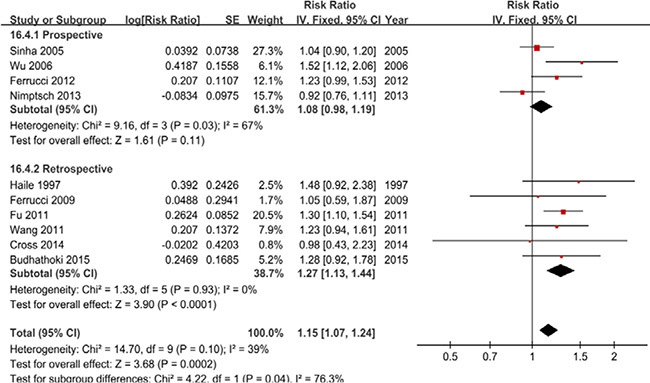
Figure 3: A forest plot of processed meat intake and colorectal adenoma incidence.
CRA locations
We further examined the associations between processed meat intake and the CRA location. Four studies were included and the analyses suggested significantly different results, with positive results for distal colon adenoma (RR = 1.24, 95% CI = 1.03–1.49) and negative results for rectal adenoma (RR = 0.93, 95% CI = 0.73–1.20) (Table 2). No study examined the association with proximal colon adenoma.
Dose-response analysis
Nine studies were included, and the results of 1.27 (1.03–1.50) suggested that the CRA incidence increases by 27% for each 100 g/day increase in processed meat intake (P = 0.03). Furthermore, we checked for nonlinearity of the dose-response relationship and the evidence showed that the best-fitting model was nonlinear model (Pnonlinearity< 0.01) (Supplementary Figure 3B).
Publication bias
The funnel plot (Supplementary Figure 4B) and Egger’s test (P = 0.77) did not suggest significant evidence of publication bias. Notably, the sensitivity analyses of the highest vs lowest categories showed that the changes in the recalculated RRs were significant, with a range from 1.12 (1.03–1.22) when excluding Fu 2011 [31] (20.5%) to 1.20 (1.11–1.31) when excluding Nimptsch 2013 [11] (15.7%).
Subtype analysis
Bacon intake was examined in 3 studies, and the RR of CRA was 1.16 (1.03–1.31) without heterogeneity (P = 0.73, I2 = 0%) (Table 2). Sensitivity analyses of the highest vs lowest categories also showed that the changes in the recalculated RRs were significant, with a range from 1.32 (0.94–1.84) when excluding Sinha 2005 [21] (86.9%) to 1.16 (1.02–1.31) when excluding Chiu 2004 [36] (2.1%).
Recurrence
Four studies were included in the comparison of the highest vs lowest categories when further stratified by CRA type. The results were 1.10 (0.94–1.30) for total CRA with low heterogeneity (P = 0.33, I2 = 9%), 1.14 (0.95–1.37) for advanced CRA with low heterogeneity (P = 0.19, I2 = 36%) and 1.09 (0.73–1.62) for multiple CRA with significant heterogeneity (P = 0.04, I2 = 69%) (Supplementary Figure 2, Table 3).
DISCUSSION
On the one hand, our findings supported the hypothesis that high intakes of red meat and processed meat increased the CRA incidence. Similarly, the dose-response analyses found positive associations for red meat and processed meat. Furthermore, the results of subgroup analyses that were based on the main adjustment for confounders were consistent for each confounder and similar to the original analyses. Additionally, subtype of analyses for red meat (beef) and processed meat (bacon) yielded the consistent results with the original estimates. We also performed the analyses of CRA locations, which further showed that positive associations were observed in distal CRA for red meat and in proximal CRA for processed meat. We specifically analyzed the ratio of red meat/white meat, and the positive results indicated that the types of meat and the ratio may be associated with CRA risk.
On the other hand, we also examined the associations between red and processed meat intake and CRA recurrence; the analyses indicated that red meat and processed meat intake was not associated with the recurrence of total CRA, advanced CRA and multiple CRA. Overall, our findings highlight the associations between red and processed meat intake and CRA risk, which may be a reference to update the dietary recommendations.
Several potential mechanisms may contribute to the effects. First, the positive associations between red and processed meat intake and CRA risk may be biologically plausible. Cooking red and processed meat is considered one of the major sources of carcinogens, such as heterocyclic amines (HCAs), polycyclic aromatic hydrocarbons (PAHs), nitrate and N-nitroso compounds (NOCs), which are believed to play important roles in the etiology of cancer [37–39] and adenoma [35, 40]. Second, a high iron intake from red meat may play a role in cancer [41] and CRA [42] by promoting the endogenous formation of carcinogenic N-nitroso compounds, causing oxidative damage and lipid peroxidation [43]. Third, positive associations have also been reported to be due to genetically controlled differences. Some specific genetic polymorphisms are considered to be involved in the pathogenesis of CRA [44]. Finally, gut microbial metabolites may be associated with meat intake [45], and bacteriological evidence has revealed possible mechanisms that explain the positive associations to a certain extent [46, 47].
Study strengths and limitations
There are several limitations in this meta-analysis. First, information on several of the major confounders, such as the intake of vegetable and fruit, could not be provided in all studies. Thus, the findings should be considered carefully due to possible confounding. Second, the different exposure ranges from the lowest to highest categories among included studies contributed to possible heterogeneity. Nevertheless, we adopted the RRs for the comparison of the highest to lowest categories. Additionally, dose-response analyses were conducted to verify the estimate. Third, the cooking methods, storage conditions, production methods and nutrient contents of meat may differ among studies, and the measurement errors to assess meat intake may lead to bias. We cannot thoroughly exclude the potential residual confounding. Finally, the language of studies was limited to English, and several studies with null estimates might not have been reported. Thus, we detected publication bias using the funnel plot, Egger’s test, and the sensitivity analysis, which suggested the negligible publication bias.
Our analysis has several strengths. First, this study provided sufficient robust, reliable and current evidence and increased the statistical power based on a substantial sample size and a quantitative synthesis of the eligible data. These data Second, we examined the association between red and processed meat intake and CRA incidence (proximal colon/distal colon/rectum) and recurrence (total/advanced/multiple). We performed subtype analyses of white meat (poultry and fish) to further explore the association. In addition, we conducted subgroup analyses for CRA according to the main risk factors (smoking, alcohol, BMI, energy intake, physical activity, dietary fiber, family history of polyps/CRC and nonsteroidal anti-inflammatory drugs) and the main confounding factors between studies (study design, publication year, sample size and geographic area) to explore the stability of pooled estimates. Third, dose-response analyses were performed to further assess the association rather than simply conducting categorical comparisons. All the independent analyses provided detailed data and increased the statistical power and the strength of our conclusion. Fourth, the study selection and data extraction were performed independently and in duplicate by two authors, which increased the validity of our findings. Finally, the heterogeneity and publication bias of this meta-analysis was negligible, which increased the reliability of our results.
MATERIALS AND METHODS
Search strategy
We systematically searched PubMed, EMBASE and Web of Science for studies up to December 2016 using the following search terms: “meats, meat, beef, pork, mutton, veal, lamb, horse, bacon, ham, salami, sausage, hot dogs, lifestyle, food, foods, diet and dietary” in combination with “neoplasm, neoplasms, neoplasia, adenoma, adenomas, cancer, cancers, adenocarcinoma, polyp and polyps”. The two sets were combined individually, and two authors (ZZ and ZY) independently judged the eligibility criteria. Additionally, the reference lists of studies were searched manually to identify eligible literature.
Study selection
Selection criteria were as follows: studies that diagnosed patients with endoscopy by histological features and biopsy that were consistent with the diagnostic gold standard were included; data that could not be combined were excluded; data that were incomplete were excluded; studies published as original articles were included; pooled analyses, systematic reviews, meta-analyses, narrative reviews, editorials, case reports, letters and comments were excluded; colorectal adenocarcinoma, precancerous lesions and other colorectal tumors were excluded; the included studies were limited to those involving humans and the language was limited to English.
Study quality and data extraction
Two authors (ZZ and ZY) assessed the quality of included studies independently, and discrepancies in interpretation were resolved by a consensus decision made by the third author (QZ). Study quality was assessed using the Newcastle-Ottawa Scale (NOS) for observational studies [48] and the Cochrane risk of bias tool for randomized controlled trials (RCTs) [49]. A sheet of data extraction was generated for included studies that included the first author, country, publication year, study design, cases, study period, study population, dietary exposure type, dietary assessment method, dietary exposure categories, RRs (95% CI) (highest to lowest), adjusted variables of each study and NOS score.
Statistical analysis
The STATA version 12.1 (STATA Corporation, College Station, TX) and RevMan5.3 (The Cochrane Collaboration, Oxford, UK) were used for data synthesis and analysis.
A random-effects model was used if there was heterogeneity among studies, and a fixed-effects model was used without heterogeneity. The median or mean level for each category was assigned to each corresponding RR. The non-linear dose-response analysis was conducted using the method described by Greenland et al [50]. The studies that reported RRs with the corresponding 95% CIs for at least 3 quantitative exposure categories were included.
The I2 statistic (I2 < 50% was considered low heterogeneity, and I2 > 50% was considered to indicate substantial heterogeneity) [51] and the Q statistic (P < 0.1 was considered representative of significant heterogeneity) were used to detect the heterogeneity among studies. Subgroup analyses were conducted to explore the sources of heterogeneity by study design, publication year, geographic area, sample size and adjustments (smoking, alcohol, BMI, energy intake, physical activity, fiber intake, family history of polyps/CRC and non-steroidal anti-inflammatory drugs).
Publication bias was evaluated using the funnel plot, Egger’s test [52] and a sensitivity analysis. P < 0.1 of Egger’s test was considered significant publication bias. The sensitivity analysis was performed to investigate the influence of each study on the pooled risk estimate by removing one study in turn.
CONCLUSIONS
The present analysis provided evidence that the intake of red meat and processed meat was associated with an increased incidence of CRA. No associations were found between red meat and processed meat intakes and CRA recurrence.
Author contributions
Zhanwei Zhao and Chaojun Zhang wrote the main manuscript and participated in the study design and data analysis. Zifang Yin and Zhenning Hang participated in the study design and data analysis, and prepared the figures and tables. Qingchuan Zhao completed the design of the work and drafted the manuscript. All authors have reviewed the manuscript text. Zhanwei Zhao and Zifang Yin contributed equally to this work.
CONFLICTS OF INTEREST
The authors declare that they have no conflicts of interest.
REFERENCES
1. Siegel RL, Miller KD, Jemal A. Cancer Statistics, 2017. CA Cancer J Clin. 2017; 67:7–30.
2. Sun T, Liu S, Zhou Y, Yao Z, Zhang D, Cao S, Wei Z, Tan B, Li Y, Lian Z, Wang S. Evolutionary biologic changes of gut microbiota in an ‘adenoma-carcinoma sequence’ mouse colorectal cancer model induced by 1, 2-Dimethylhydrazine. Oncotarget. 2017; 8:444–457. http://doi.org/10.18632/oncotarget.13443.
3. He X, Sun LM. Dietary intake of flavonoid subclasses and risk of colorectal cancer: evidence from population studies. Oncotarget. 2016; 7:26617–26627. http://doi.org/10.18632/oncotarget.8562.
4. Gan Y, Wu J, Zhang S, Li L, Cao S, Mkandawire N, Ji K, Herath C, Gao C, Xu H, Zhou Y, Song X, Chen S, et al. Association of coffee consumption with risk of colorectal cancer: a meta-analysis of prospective cohort studies. Oncotarget. 2017; 8:18699–18711. http://doi.org/10.18632/oncotarget.8627.
5. Bouvard V, Loomis D, Guyton KZ, Grosse Y, Ghissassi FE, Benbrahim-Tallaa L, Guha N, Mattock H, Straif K. Carcinogenicity of consumption of red and processed meat. Lancet Oncol. 2015; 16:1599–1600.
6. Romaguera D, Ward H, Wark PA, Vergnaud AC, Peeters PH, van Gils CH, Ferrari P, Fedirko V, Jenab M, Boutron-Ruault MC, Dossus L, Dartois L, Hansen CP, et al. Pre-diagnostic concordance with the WCRF/AICR guidelines and survival in European colorectal cancer patients: a cohort study. BMC Med. 2015; 13:107.
7. Xu X, Yu E, Gao X, Song N, Liu L, Wei X, Zhang W, Fu C. Red and processed meat intake and risk of colorectal adenomas: a meta-analysis of observational studies. Int J Cancer. 2013; 132:437–448.
8. Aune D, Chan DS, Vieira AR, Navarro RD, Vieira R, Greenwood DC, Kampman E, Norat T. Red and processed meat intake and risk of colorectal adenomas: a systematic review and meta-analysis of epidemiological studies. Cancer Causes Control. 2013; 24:611–627.
9. Budhathoki S, Iwasaki M, Yamaji T, Sasazuki S, Takachi R, Sakamoto H, Yoshida T, Tsugane S. Dietary heterocyclic amine intake, NAT2 genetic polymorphism, and colorectal adenoma risk: the colorectal adenoma study in Tokyo. Cancer Epidemiol Biomarkers Prev. 2015; 24:613–620.
10. Cross AJ, Major JM, Rothman N, Sinha R. Urinary 1-methylhistidine and 3-methylhistidine, meat intake, and colorectal adenoma risk. Eur J Cancer Prev. 2014; 23:385–390.
11. Nimptsch K, Bernstein AM, Giovannucci E, Fuchs CS, Willett WC, Wu K. Dietary intakes of red meat, poultry, and fish during high school and risk of colorectal adenomas in women. Am J Epidemiol. 2013; 178:172–183.
12. Giovannucci E, Stampfer MJ, Colditz G, Rimm EB, Willett WC. Relationship of diet to risk of colorectal adenoma in men. J Natl Cancer Inst. 1992; 84:91–98.
13. Sandler RS, Lyles CM, Peipins LA, McAuliffe CA, Woosley JT, Kupper LL. Diet and risk of colorectal adenomas: macronutrients, cholesterol, and fiber. J Natl Cancer Inst. 1993; 85:884–891.
14. Haile RW, Witte JS, Longnecker MP, Probst-Hensch N, Chen MJ, Harper J, Frankl HD, Lee ER. A sigmoidoscopy-based case-control study of polyps: macronutrients, fiber and meat consumption. Int J Cancer. 1997; 73:497–502.
15. Lubin F, Rozen P, Arieli B, Farbstein M, Knaani Y, Bat L, Farbstein H. Nutritional and lifestyle habits and water-fiber interaction in colorectal adenoma etiology. Cancer Epidemiol Biomarkers Prev. 1997; 6:79–85.
16. Breuer-Katschinski B, Nemes K, Marr A, Rump B, Leiendecker B, Breuer N, Goebell H. Colorectal adenomas and diet: a case-control study. Colorectal Adenoma Study Group. Dig Dis Sci. 2001; 46:86–95.
17. Nagata C, Shimizu H, Kametani M, Takeyama N, Ohnuma T, Matsushita S. Diet and colorectal adenoma in Japanese males and females. Dis Colon Rectum. 2001; 44:105–111.
18. Voskuil DW, Kampman E, Grubben MJ, Kok FJ, Nagengast FM, Vasen HF, van 't Veer P. Meat consumption and meat preparation in relation to colorectal adenomas among sporadic and HNPCC family patients in The Netherlands. Eur J Cancer. 2002; 38:2300–2308.
19. Tiemersma EW, Voskuil DW, Bunschoten A, Hogendoorn EA, Witteman BJ, Nagengast FM, Glatt H, Kok FJ, Kampman E. Risk of colorectal adenomas in relation to meat consumption, meat preparation, and genetic susceptibility in a Dutch population. Cancer Causes Control. 2004; 15:225–236.
20. Chan AT, Ma J, Tranah GJ, Giovannucci EL, Rifai N, Hunter DJ, Fuchs CS. Hemochromatosis gene mutations, body iron stores, dietary iron, and risk of colorectal adenoma in women. J Natl Cancer Inst. 2005; 97:917–926.
21. Sinha R, Peters U, Cross AJ, Kulldorff M, Weissfeld JL, Pinsky PF, Rothman N, Hayes RB. Meat, meat cooking methods and preservation, and risk for colorectal adenoma. Cancer Res. 2005; 65:8034–8041.
22. Wu K, Giovannucci E, Byrne C, Platz EA, Fuchs C, Willett WC, Sinha R. Meat mutagens and risk of distal colon adenoma in a cohort of U.S. men. Cancer Epidemiol Biomarkers Prev. 2006; 15:1120–1125.
23. Cho E, Willett WC, Colditz GA, Fuchs CS, Wu K, Chan AT, Zeisel SH, Giovannucci EL. Dietary choline and betaine and the risk of distal colorectal adenoma in women. J Natl Cancer Inst. 2007; 99:1224–1231.
24. Saebo M, Skjelbred CF, Brekke LK, Bowitz LI, Hagen PC, Johnsen E, Tveit KM, Kure EH. CYP1A2 164 A—>C polymorphism, cigarette smoking, consumption of well-done red meat and risk of developing colorectal adenomas and carcinomas. Anticancer Res. 2008; 28:2289–2295.
25. Ferrucci LM, Sinha R, Graubard BI, Mayne ST, Ma X, Schatzkin A, Schoenfeld PS, Cash BD, Flood A, Cross AJ. Dietary meat intake in relation to colorectal adenoma in asymptomatic women. Am J Gastroenterol. 2009; 104:1231–1240.
26. Ramadas A, Kandiah M. Food intake and colorectal adenomas: a case-control study in Malaysia. Asian Pac J Cancer Prev. 2009; 10:925–932.
27. Rohrmann S, Hermann S, Linseisen J. Heterocyclic aromatic amine intake increases colorectal adenoma risk: findings from a prospective European cohort study. Am J Clin Nutr. 2009; 89:1418–1424.
28. Northwood EL, Elliott F, Forman D, Barrett JH, Wilkie MJ, Carey FA, Steele RJ, Wolf R, Bishop T, Smith G. Polymorphisms in xenobiotic metabolizing enzymes and diet influence colorectal adenoma risk. Pharmacogenet Genomics. 2010; 20:315–326.
29. Wang H, Yamamoto JF, Caberto C, Saltzman B, Decker R, Vogt TM, Yokochi L, Chanock S, Wilkens LR, Le Marchand L. Genetic variation in the bioactivation pathway for polycyclic hydrocarbons and heterocyclic amines in relation to risk of colorectal neoplasia. Carcinogenesis. 2011; 32:203–209.
30. Burnett-Hartman AN, Newcomb PA, Mandelson MT, Adams SV, Wernli KJ, Shadman M, Wurscher MA, Makar KW. Colorectal polyp type and the association with charred meat consumption, smoking, and microsomal epoxide hydrolase polymorphisms. Nutr Cancer. 2011; 63:583–592.
31. Fu Z, Shrubsole MJ, Smalley WE, Wu H, Chen Z, Shyr Y, Ness RM, Zheng W. Association of meat intake and meat-derived mutagen exposure with the risk of colorectal polyps by histologic type. Cancer Prev Res (Phila). 2011; 4:1686–1697.
32. Ferrucci LM, Sinha R, Huang WY, Berndt SI, Katki HA, Schoen RE, Hayes RB, Cross AJ. Meat consumption and the risk of incident distal colon and rectal adenoma. Br J Cancer. 2012; 106:608–616.
33. Mathew A, Sinha R, Burt R, Caan B, Paskett E, Iber F, Kikendall W, Lance P, Shike M, Weissfeld J, Schatzkin A, Lanza E. Meat intake and the recurrence of colorectal adenomas. Eur J Cancer Prev. 2004; 13:159–164.
34. Robertson DJ, Sandler RS, Haile R, Tosteson TD, Greenberg ER, Grau M, Baron JA. Fat, fiber, meat and the risk of colorectal adenomas. Am J Gastroenterol. 2005; 100:2789–2795.
35. Martinez ME, Jacobs ET, Ashbeck EL, Sinha R, Lance P, Alberts DS, Thompson PA. Meat intake, preparation methods, mutagens and colorectal adenoma recurrence. Carcinogenesis. 2007; 28:2019–2027.
36. Chiu BC, Gapstur SM. Changes in diet during adult life and risk of colorectal adenomas. Nutr Cancer. 2004; 49:49–58.
37. Helmus DS, Thompson CL, Zelenskiy S, Tucker TC, Li L. Red meat-derived heterocyclic amines increase risk of colon cancer: a population-based case-control study. Nutr Cancer. 2013; 65:1141–1150.
38. Rohrmann S, Overvad K, Bueno-de-Mesquita HB, Jakobsen MU, Egeberg R, Tjonneland A, Nailler L, Boutron-Ruault MC, Clavel-Chapelon F, Krogh V, Palli D, Panico S, Tumino R, et al. Meat consumption and mortality--results from the European Prospective Investigation into Cancer and Nutrition. Bmc Med. 2013; 11:63.
39. Xie L, Mo M, Jia HX, Liang F, Yuan J, Zhu J. Association between dietary nitrate and nitrite intake and sitespecific cancer risk: evidence from observational studies. Oncotarget. 2016; 7:56915–56932. http://doi.org/10.18632/oncotarget.10917.
40. Sinha R, Kulldorff M, Chow WH, Denobile J, Rothman N. Dietary intake of heterocyclic amines, meat-derived mutagenic activity, and risk of colorectal adenomas. Cancer Epidemiol Biomarkers Prev. 2001; 10:559–562.
41. Bastide NM, Chenni F, Audebert M, Santarelli RL, Tache S, Naud N, Baradat M, Jouanin I, Surya R, Hobbs DA, Kuhnle GG, Raymond-Letron I, Gueraud F, et al. A central role for heme iron in colon carcinogenesis associated with red meat intake. Cancer Res. 2015; 75:870–879.
42. Bastide N, Morois S, Cadeau C, Kangas S, Serafini M, Gusto G, Dossus L, Pierre FH, Clavel-Chapelon F, Boutron-Ruault MC. Heme Iron Intake, Dietary Antioxidant Capacity, and Risk of Colorectal Adenomas in a Large Cohort Study of French Women. Cancer Epidemiol Biomarkers Prev. 2016; 25:640–647.
43. Diallo A, Deschasaux M, Partula V, Latino-Martel P, Srour B, Hercberg S, Galan P, Fassier P, Gueraud F, Pierre FH, Touvier M. Dietary iron intake and breast cancer risk: modulation by an antioxidant supplementation. Oncotarget. 2016; 7:79008–79016. http://doi.org/10.18632/oncotarget.12592.
44. Gilsing AM, Berndt SI, Ruder EH, Graubard BI, Ferrucci LM, Burdett L, Weissfeld JL, Cross AJ, Sinha R. Meat-related mutagen exposure, xenobiotic metabolizing gene polymorphisms and the risk of advanced colorectal adenoma and cancer. Carcinogenesis. 2012; 33:1332–1339.
45. Xu R, Wang Q, Li L. A genome-wide systems analysis reveals strong link between colorectal cancer and trimethylamine N-oxide (TMAO), a gut microbial metabolite of dietary meat and fat. Bmc Genomics. 2015; 16:S4.
46. Grivennikov SI, Wang K, Mucida D, Stewart CA, Schnabl B, Jauch D, Taniguchi K, Yu GY, Osterreicher CH, Hung KE, Datz C, Feng Y, Fearon ER, et al. Adenoma-linked barrier defects and microbial products drive IL-23/IL-17-mediated tumour growth. Nature. 2012; 491:254–258.
47. Nugent JL, McCoy AN, Addamo CJ, Jia W, Sandler RS, Keku TO. Altered tissue metabolites correlate with microbial dysbiosis in colorectal adenomas. J Proteome Res. 2014; 13:1921–1929.
48. Stang A. Critical evaluation of the Newcastle-Ottawa scale for the assessment of the quality of nonrandomized studies in meta-analyses. Eur J Epidemiol. 2010; 25:603–605.
49. Green S, Higgins JPT. Cochrane handbook for systematic reviews of interventions. (Chichester, England: Wiley-Blackwell). 2008.
50. Greenland S, Longnecker MP. Methods for trend estimation from summarized dose-response data, with applications to meta-analysis. Am J Epidemiol. 1992; 135:1301–1309.
51. Higgins JP, Thompson SG, Deeks JJ, Altman DG. Measuring inconsistency in meta-analyses. BMJ. 2003; 327:557–560.
52. Egger M, Davey SG, Schneider M, Minder C. Bias in meta-analysis detected by a simple, graphical test. BMJ. 1997; 315:629–634.