
INTRODUCTION
Irritable bowel syndrome (IBS) is the most prevalent gastrointestinal disorder characterized by abdominal discomfort, pain, and altered defecation patterns; it may considerably reduce patients’ quality of life and work productivity, which affects more than 7 percent of people all around the world [1, 2]. According to the recurrent symptoms, IBS patients can experience constipation (IBS-C), diarrhea (IBS-D), mixture of diarrhea and constipation IBS (IBS-M) and un-subtyped IBS [3, 4]. IBS is a multifactorial disorder that is associated with biological and psychosocial factors [5–7]. Although genetic predisposition has been demonstrated in classical family and twin studies, unequivocal susceptibility genes have yet to be identified [2, 8]. Recently, several genetic association studies identified the guanine nucleotide binding protein (G-protein) β3 subunit gene (GNβ3) C825T polymorphism as being significantly associated with IBS [9–12].
G-protein, consisting of an α, β, and γ subunit, is an intracellular second messenger signalling protein linked to a transmembrane receptor [13, 14]. The C825T polymorphism of GNβ3 (rs5443) is associated with alternative splicing of the gene and its protein activity, and an increased intracellular signal transduction compared with unmodified Gβ3 protein [15, 16]. This single nucleotide polymorphism (SNP) has been reported to be associated with depression [17], Alzheimer’s disease (AD) [18], hypertension [19], obesity [20], Insulin-mediated venodilation [21], Vasculogenic erectile dysfunction (VED) [22], and functional dyspepsia [23]. Recently, the association between the GNβ3 C825T polymorphism and the risk of IBS has been intensively investigated. However, the community is still unable to reach a consensus, particularly regarding the data from different ethnicities and IBS subtypes [9–12, 24–30]. To date, only one meta-analyses has reported on the relationship between GNβ3 C825T polymorphism and susceptibility to IBS [31]. However, that meta-analysis only included seven studies, and missed many published articles [27–30]. Moreover, the previous meta-analysis did not analyze the association between GNβ3 C825T polymorphism and different IBS subtypes with respect to ethnicity. Therefore, we conducted an updated meta-analysis including all published studies accompanied with ethnic subgroup analyses and IBS subtype analyses to clarify whether GNβ3 C825T was associated with the development of IBS and its subtypes.
RESULTS
Characteristics of studies 26-9-11
As showed in Figure 1, eleven studies involving 1,422 cases and 2,073 controls were ultimately included in the present meta-analysis, and eight of them [10, 12, 24, 25, 27–30] specifically investigated the association between GNβ3 C825T polymorphism and different IBS subtypes (including the IBS-C, IBS-D and IBS-M) risk. The main characteristics of the included articles were summarized in Table 1. All of these included articles were case-control studies, of which nine in a hospital-based design [10–12, 25–30], two in a population-based design [9, 24]. Among these studies, six were on Caucasians [9, 11, 24, 25, 27, 28] and the other five were on Asians [10, 12, 26, 29, 30]. Additionally, all of the included studies were of high quality, as indicated by the Newcastle-Ottawa scale (NOS) scores of each study being above 6 points, and the genotype distributions in all of the controls were consistent with Hardy-Weinberg equilibrium (HWE), except one [10]. Studies with controls not in HWE were also considered for the meta-analysis, but they were excluded in the sensitivity analysis.
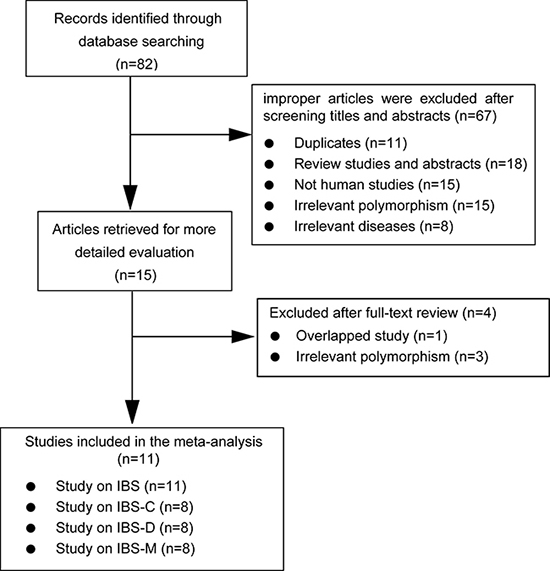
Figure 1: Flow diagram of selection of eligible studies.
Table 1: Characteristics of studies included in the meta-analysis
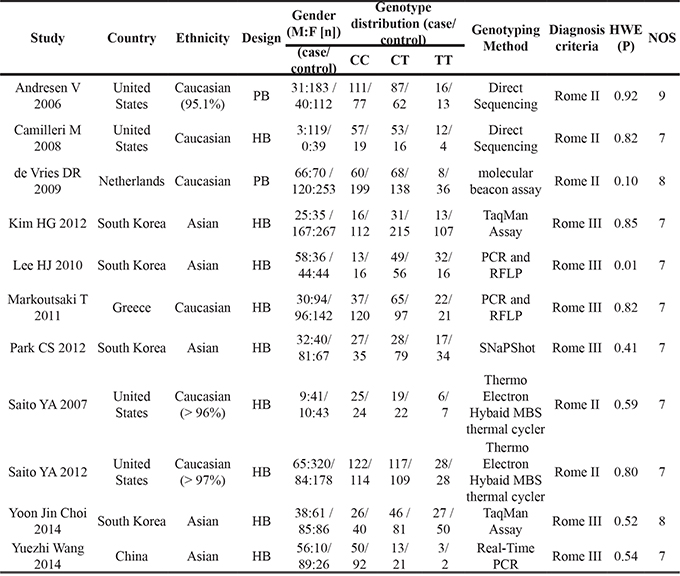
Abbreviations: HB, hospital-based study; PB, population based; RFLP, restriction fragment length polymorphism analyses
Power analysis
Before implementation of this meta-analysis, statistical power was assessed with the assumptions:α err prob = 0.05, OR = 1.25 (corresponding to a “weak to moderate” gene effect) for the SNP, and minor allele frequencies(MAF) of GNβ3 C825T(rs5443, C/T) was estimated from the 1000 Genomes. The present samples indicated that 100% power to evaluate the association between this polymorphism and IBS. And the power to evaluate the associations between this polymorphism and IBS subtypes (IBS-C, IBS-D and IBS-M) were 88.1%, 98.3% and 93.9%, respectively. The power analysis indicated that these recruited samples could provide sufficient power in identifying the association between GNβ3 C825T(rs5443, C/T) polymorphism and IBS and its subtypes.
Quantitative synthesis
GNβ3 C825T and IBS risk
Overall, no significant association between GNβ3 C825T polymorphism and risk of IBS was observed under all genetic models (C vs. T, P = 0.194; CC vs. TT, P = 0.564; CT vs. TT, P = 0.594; CC + CT vs. TT, P = 0.430; CC vs. CT+TT, P = 0.462) (Figure 2). In the subgroup analyses by ethnicity, significant associations were not found in any genetic model for Asians and Caucasians. All the results are listed in Table 2.
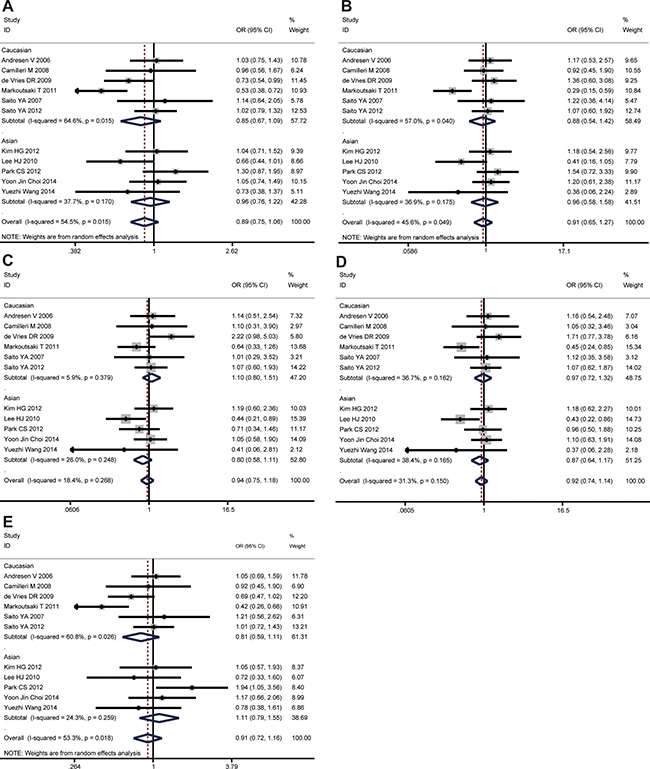
Figure 2: The associations of GNβ3 C825T with IBS in different genetic models. (A) Allele model (C vs. T). (B) Codominant model (CC vs. TT). (C) Codominant model (CT vs. TT). (D) Dominant model (CC + CT vs. TT). (E) Recessive model (CC vs. TT + CT).
Table 2: Summary of meta-analysis for the association of GNβ3 C825T polymorphism with IBS and its subtypes
Genetic models |
Stratifications |
Number of studies |
OR (95%CI) |
P value |
Heterogeneity |
|
|---|---|---|---|---|---|---|
I2 |
PH |
|||||
IBS |
||||||
C vs. T |
Overall |
11 |
0.893 [0.752, 1.060] |
0.194 |
54.5% |
0.015 |
Asians |
5 |
0.959 [0.756, 1.216] |
0.729 |
37.7% |
0.170 |
|
Caucasian |
6 |
0.852 [0.666, 1.091] |
0.205 |
64.6% |
0.015 |
|
CC vs. TT |
Overall |
11 |
0.906 [0.649, 1.266] |
0.564 |
45.6% |
0.049 |
Asians |
5 |
0.960 [0.583, 1.580] |
0.872 |
36.9% |
0.175 |
|
Caucasian |
6 |
0.879 [0.543, 1.421] |
0.599 |
57.0% |
0.040 |
|
CT vs. TT |
Overall |
11 |
0.940 [0.748, 1.180] |
0.594 |
18.4% |
0.268 |
Asians |
5 |
0.800 [0.578, 1.107] |
0.179 |
26.0% |
0.248 |
|
Caucasian |
6 |
1.096 [0.796, 1.509] |
0.574 |
5.9% |
0.379 |
|
CC+CT vs. TT |
Overall |
11 |
0.917 [0.739, 1.137] |
0.430 |
31.3% |
0.150 |
Asians |
5 |
0.866 [0.639, 1.175] |
0.356 |
38.4% |
0.165 |
|
Caucasian |
6 |
0.970 [0.715, 1.316] |
0.845 |
36.7% |
0.162 |
|
CC vs. CT+TT |
Overall |
11 |
0.914 [0.718, 1.162] |
0.462 |
53.3% |
0.018 |
Asians |
5 |
1.110 [0.794, 1.552] |
0.542 |
24.3% |
0.259 |
|
Caucasian |
6 |
0.814 [0.595, 1.113] |
0.197 |
60.8% |
0.026 |
|
IBS-C |
||||||
C vs. T |
Overall |
8 |
0.788 [0.622, 0.997] |
0.048 |
24% |
0.238 |
Asians |
4 |
0.520 [0.329, 0.821] |
0.005 |
0% |
0.503 |
|
Caucasian |
4 |
0.926 [0.701,1.225] |
0.592 |
0% |
0.461 |
|
CC vs. TT |
Overall |
8 |
0.622 [0.370, 1.046] |
0.073 |
0% |
0.532 |
Asians |
4 |
0.258 [0.094, 0.707] |
0.008 |
0% |
0.736 |
|
Caucasian |
4 |
0.974 [0.506, 1.877] |
0.938 |
0% |
0.827 |
|
CT vs. TT |
Overall |
8 |
0.709 [0.449, 1.120] |
0.140 |
0% |
0.552 |
Asians |
4 |
0.431 [0.221, 0.842] |
0.014 |
0% |
0.749 |
|
Caucasian |
4 |
1.094 [0.571, 2.093] |
0.787 |
0% |
0.839 |
|
CC+CT vs. TT |
Overall |
8 |
0.653 [0.422, 1.011] |
0.056 |
6.4% |
0.381 |
Asians |
4 |
0.378 [0.200, 0.714] |
0.003 |
0% |
0.652 |
|
Caucasian |
4 |
1.035 [0.556, 1.929] |
0.913 |
0% |
0.848 |
|
CC vs. CT+TT |
Overall |
8 |
0.835 [0.597, 1.168] |
0.292 |
0% |
0.731 |
Asians |
4 |
0.513 [0.218, 1.208] |
0.126 |
0% |
0.668 |
|
Caucasian |
4 |
0.927 [0.641, 1.340] |
0.686 |
0% |
0.621 |
|
IBS-D |
||||||
C vs. T |
Overall |
8 |
1.162 [0.977, 1.381] |
0.089 |
30.9% |
0.181 |
Asians |
4 |
1.316 [1.019, 1.700] |
0.035 |
55.8% |
0.079 |
|
Caucasian |
4 |
1.046 [0.827, 1.321] |
0.709 |
0% |
0.635 |
|
CC vs. TT |
Overall |
8 |
1.246 [0.866, 1.793] |
0.236 |
14.8% |
0.314 |
Asians |
4 |
1.609 [0.963, 2.690] |
0.069 |
43.9% |
0.148 |
|
Caucasian |
4 |
0.957 [0.571, 1.603] |
0.867 |
0% |
0.802 |
|
CT vs. TT |
Overall |
8 |
0.843 [0.592, 1.201] |
0.345 |
0% |
0.822 |
Asians |
4 |
0.796 [0.493, 1.287] |
0.352 |
9.1% |
0.348 |
|
Caucasian |
4 |
0.902 [0.543, 1.525] |
0.701 |
0% |
0.979 |
|
CC+CT vs. TT |
Overall |
8 |
0.996 [0.716, 1.384] |
0.980 |
0% |
0.542 |
Asians |
4 |
1.048 [0.674, 1.630] |
0.836 |
43.6% |
0.150 |
|
Caucasian |
4 |
0.934 [0.570, 1.529] |
0.785 |
0% |
0.901 |
|
CC vs. CT+TT |
Overall |
8 |
1.268 [1.000, 1.608] |
0.050 |
27.8% |
0.206 |
Asians |
4 |
1.688 [1.157, 2.463] |
0.007 |
29.2% |
0.237 |
|
Caucasian |
4 |
1.054 [0.777, 1.432] |
0.735 |
0% |
0.644 |
|
IBS-M |
||||||
C vs. T |
Overall |
8 |
0.789 [0.576, 1.080] |
0.139 |
51.5% |
0.044 |
Asians |
4 |
0.672 [0.403, 1.121] |
0.128 |
50.1% |
0.111 |
|
Caucasian |
4 |
0.926 [0.660, 1.299] |
0.655 |
34.5% |
0.205 |
|
CC vs. TT |
Overall |
8 |
0.798 [0.402, 1.587] |
0.521 |
38.1% |
0.126 |
Asians |
4 |
0.464 [0.126, 1.713] |
0.249 |
53.1% |
0.094 |
|
Caucasian |
4 |
1.253 [0.678, 2.316] |
0.472 |
0.0% |
0.513 |
|
CT vs. TT |
Overall |
8 |
0.994 [0.662, 1.495] |
0.979 |
0% |
0.614 |
Asians |
4 |
0.755 [0.431, 1.325] |
0.327 |
0% |
0.622 |
|
Caucasian |
4 |
1.337 [0.732, 2.440] |
0.345 |
0% |
0.540 |
|
CC+CT vs. TT |
Overall |
8 |
0.941 [0.639, 1.387] |
0.760 |
11.6% |
0.340 |
Asians |
4 |
0.689 [0.404, 1.174] |
0.170 |
9.5% |
0.346 |
|
Caucasian |
4 |
1.306 [0.736, 2.318] |
0.361 |
0.0% |
0.529 |
|
CC vs. CT+TT |
Overall |
8 |
0.788 [0.500, 1.240] |
0.303 |
45.2% |
0.078 |
Asians |
4 |
0.622 [0.216, 1.789] |
0.378 |
61.5% |
0.050 |
|
Caucasian |
4 |
0.935 [0.623, 1.403] |
0.746 |
21.6% |
0.281 |
|
GNβ3 C825T and IBS-C risk
The C allele of GNβ3 C825T was found to be significantly associated with a decreased risk of IBS-C in allele model (C vs. T, OR = 0.788, 95% CI: 0.622-0.997, P = 0.048), while no evidence of significance was identified in other genetic models (CC vs. TT, P = 0.073; CT vs. TT, P = 0.140; CC+CT vs. TT, P = 0.056; CC vs. CT+TT, P = 0.292). In the subgroup analyses by ethnicity, the significant association was found among Asians under all genetic models (C vs. T, OR = 0.520, 95% CI: 0.329-0.821, P = 0.005; CC vs. TT, OR = 0.258, 95% CI: 0.094-0.707, P = 0.008; CT vs. TT, OR = 0.431, 95% CI: 0.221-0.842, P = 0.014; CC+CT vs. TT, OR = 0.378, 95% CI: 0.200-0.714, P = 0.003) except for the recessive model (CC vs. CT+TT, P = 0.126) (Figure 3). However, there was no significant association between this polymorphism and IBS-C development in the Caucasian population under any genetic model. All the results are listed in Table 2.
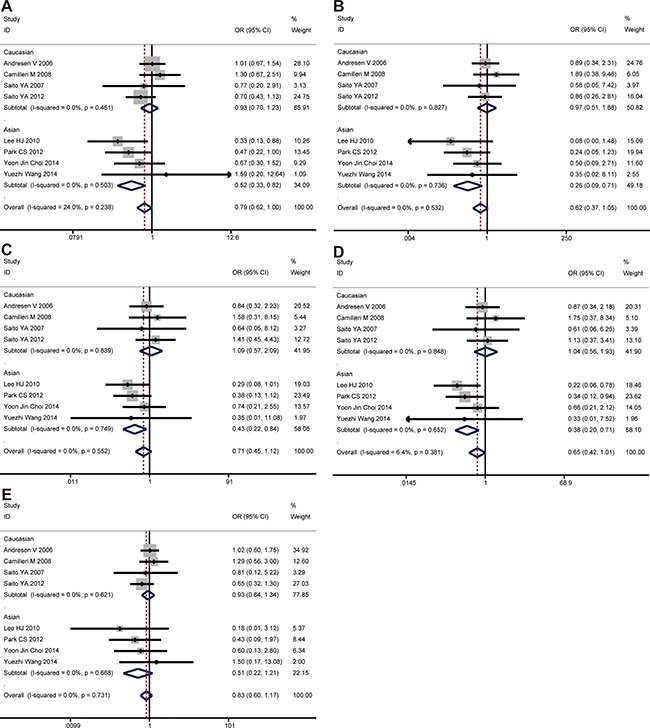
Figure 3: The associations of GNβ3 C825T with IBS-C in different genetic models. (A) Allele model (C vs. T). (B) Codominant model (CC vs. TT). (C) Codominant model (CT vs. TT). (D) Dominant model (CC + CT vs. TT). (E) Recessive model (CC vs. TT + CT).
GNβ3 C825T and IBS-D risk
The CC genotype of GNβ3 C825T was found to be significantly associated with an increased risk of IBS-D in recessive model (CC vs. CT + TT, OR = 1.268, 95% CI: 1.000-1.608, P = 0.050), while no evidence of significance was identified in other genetic models (C vs. T, P = 0.089; CC vs. TT, P = 0.236; CT vs. TT, P = 0.345; CC + CT vs. TT, P = 0.980). In the subgroup analyses by ethnicity, the significant association was found among Asians under allele model (C vs. T, OR = 1.316, 95% CI: 1.019–1.700, P = 0.035) and recessive model (CC vs. CT+TT, OR = 1.688, 95% CI: 1.157–2.463, P = 0.007), while no evidence of significance was identified in other two genetic models (Figure 4). However, there was no significant association between this polymorphism and IBS-D development in the Caucasian population under any genetic model. All the results are listed in Table 2.
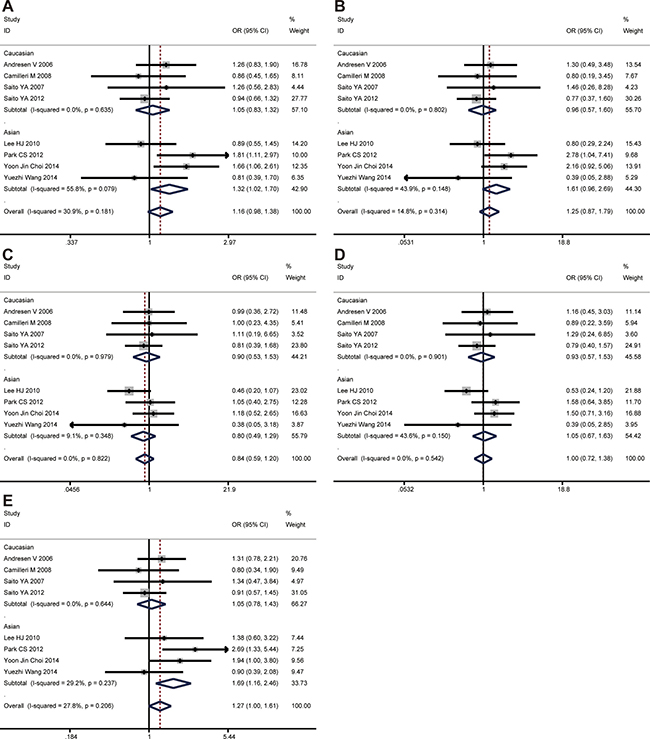
Figure 4: The associations of GNβ3 C825T with IBS-D in different genetic models. (A) Allele model (C vs. T). (B) Codominant model (CC vs. TT). (C) Codominant model (CT vs. TT). (D) Dominant model (CC + CT vs. TT). (E) Recessive model (CC vs. TT + CT).
GNβ3 C825T and IBS-M risk
No significant association was found between GNβ3 C825T polymorphism and IBS-M in the overall population. In subgroup analysis, there was no significant association between this polymorphism and IBS-M development in the Caucasian and Asian population. All the results are listed in Table 2.
Sensitivity analysis
Sensitivity analysis of the summary odds ratio coefficients on the relationship of the SNP and the risk of IBS is computed by omitting each study in turn. The corresponding pooled ORs were not significantly altered after excluding each eligible study at a time (Figure 5).
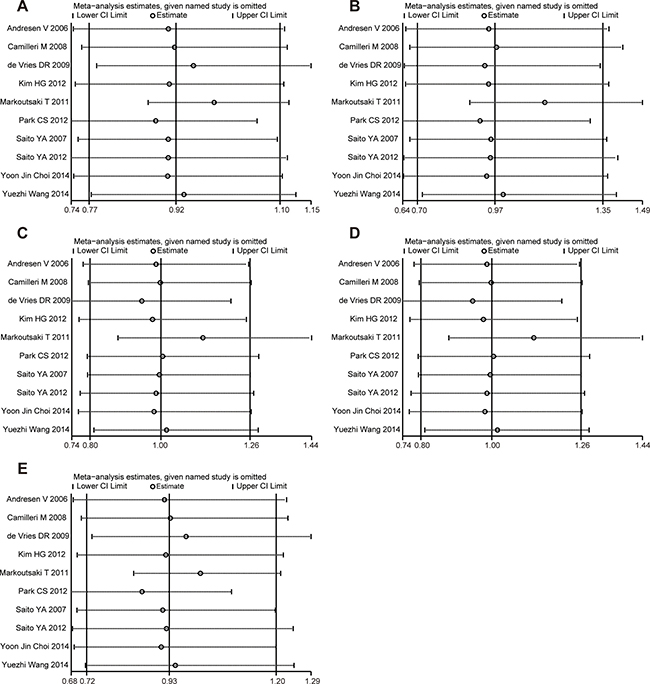
Figure 5: Sensitivity analysis of the association of GNβ3 C825T and IBS in the different genetic models. (A) Allele model (C vs. T). (B) Codominant model (CC vs. TT). (C) Codominant model (CT vs. TT). (D) Dominant model (CC + CT vs. TT). (E) Recessive model (CC vs. TT + CT).
Publication bias
No evidence of publication bias was detected regarding the ORs of the SNP in this study by either Begg’s or Egger’s test (Table 3).
Table 3: Publication bias tests for association of the GNβ3 C825T polymorphism with IBS
Comparisons |
Egger test |
Begg test |
||
|---|---|---|---|---|
Coefficient |
P value |
95% CI |
P value |
|
GNβ3 C825T |
||||
C vs. T |
0.48 |
0.80 |
(–3.70, 4.67 ) |
0.76 |
CC vs. TT |
–0.96 |
0.60 |
(–4.92, 3.01 ) |
0.64 |
CT vs. TT |
–0.22 |
0.87 |
(–3.02, 2.59 ) |
0.76 |
CC+CT vs. TT |
–0.34 |
0.80 |
(–3.39, 2.70 ) |
0.64 |
CC vs. CT+TT |
0.93 |
0.59 |
(–2.75, 4.64 ) |
0.64 |
DISCUSSION
Recently, several genetic association studies identified a novel association between GNβ3 C825T polymorphism and IBS. In Asia, Lee et al. [10] demonstrated that GNβ3 825T allele is associated with IBS in Koreans, especially among IBS with constipation. Likewise, Park et al. [12] found that the TT genotype of GNβ3 C825T is common in IBS-C while the CC genotype is common in IBS-D. In Europe, Markoutsaki T [11] found that TT genotype and T allele of GNβ3 are significantly associated with IBS predisposition in Greeks. Besides, in a Netherlands study CT genotype of GNβ3 showed significant association with IBS [9]. However, other studies [24–30] revealed that the GNβ3 C825T polymorphism may be not associated with the development of IBS or its subtypes. Generally, this disparity might be partly due to ethnic differences or to the limited numbers of subjects involved in the studies. To derive a more precise estimation of this association, we performed a meta-analysis to clarify the associations between the GNβ3 C825T mutation and the presence of IBS and its subtypes. Eleven case-control studies [9–12, 24–30] with a total of 1,422 IBS patients and 2,073 healthy controls were included in our meta-analysis, which was sufficiently powered to detect IBS susceptibility associated with GNβ3 C825T gene polymorphism.
In the present study, we used four models to estimate the relationship between GNB3 C825T polymorphism and IBS and its subtypes. The C allele of GNβ3 C825T was demonstrated to be significantly associated with a decreased risk of IBS-C in allele model. While the results of the recessive model supported CC genotype of GNβ3 could increase the risk of IBS-D. Additionally, subgroup analyses by ethnicity indicated that the SNP of GNβ3 C825T was only significantly associated with a decreased risk of IBS-C in Asian population, while the CC genotype was only associated with increased IBS-D risk in the Asian population. Besides that, neither the overall results with the whole population nor the subgroup analysis by Asian and Caucasian ethnicity indicated the associations between GNβ3 C825T polymorphism and the development of IBS and IBS-M. Obviously, our results are not consistent with some previous studies [9–12] that GNβ3 C825T was associated with IBS. A possible explanation for this phenomenon is that the previous single studies of IBS had small samples size, and thus the significance of current work may not be justified; thus, further studies are needed to clarify the effects of this SNP on the development of IBS and its subtypes. In addition, the differential allele frequencies of the SNP exerted disproportionate levels of influence on the IBS risks in different populations. For example, the minor allele frequencies (MAF) of the SNP GNβ3 C825T (rs5443) is 0.50 in the East Asian population (EAS), whereas the MAF is 0.31 in the European population (EUR) and the MAF is 0.38 in the Ad Mixed American population (AMR) based on the data from the 1000 G. In accordance with our partial findings, a previous meta-analysis performed by Pan ZG et al. [31] found that no associations of GNB3 C825T polymorphism with IBS risk either in Asian population or Caucasian population. However, that previous meta-analysis based on seven studies still had some differences from our results, and suggested that no significant associations between GNβ3 C825T polymorphism and 3 IBS subtypes (IBS-C, IBS-D and IBS-M). The major reason of this discrepancy is that this previous meta-analysis did not include all the published articles and did not assess the association between this polymorphism and IBS subtypes with respect to ethnicity. In contrast, our meta-analysis included all the eleven relevant published studies with a larger sample size of cases and controls, which gave a greater statistical power to evaluate the association than the previous study. Additionally, our study included four studies in Asian group and four studies in Caucasian group to evaluate the association between GNβ3 C825T polymorphism and IBS subtypes, which gave a more detailed analysis to assay the association and showed a more reliable result.
To the best of our knowledge, this is the first meta-analysis to explore the relationships between GNβ3 C825T gene polymorphism and IBS and its subtypes with respect to ethnicity. The genotype distributions in all of the controls were consistent with HWE, except one for one study reported by Lee et al. [10]. However, the association was not significant change when excluded the study. The NOS results indicated that the included studies were credible. Moreover, sensitivity analysis did not significantly alter in overall and subgroup results under all genetic models. In addition, no evidence of publication bias was identified by either Begg’s or Egger’s tests. Taken together, the outcomes of our meta-analysis are relatively reliable and stable.
Nevertheless, there were some limitations in the current study. First, only articles in English and Chinese language were included; thus, studies written in other languages were neglected. Second, although we performed a systematic searching strategy to identify eligible studies, there was still probability that few studies so called “grey literatures” were not included. Third, due to the limited data, we did not carry out subgroup analysis to other factors, which may participate in the progression of IBS, such as age, infection, social psychology, and other living habits. Finally, IBS is a common gastrointestinal disorder in the human population; particularly in females (two thirds of patients are female). However, none of the original studies accounted for gene-gender interactions. Further studies are needed to clarify whether gender-related differences affected the polymorphism of GNβ3 C825T and subsequent IBS.
In summary, this meta-analysis suggested that the C allele of GNβ3 C825T may be associated with a decreased risk of IBS-C, while the CC genotype of GNβ3 may be associated with increased IBS-D risk. However, due to the above-mentioned limitations, a well-designed large-scale study that includes ethnicities, IBS subtypes and psychosocial factors is required to confirm the findings of the current meta-analysis.
MATERIALS AND METHODS
Search strategy and selection criteria
According to the Preferred Reporting Items for Systematic Reviews and Meta-Analyses (PRISMA) statement [32], we searched the related literature of the electronic records of the PubMed, Embase, Science Direct, Chinese National Knowledge Infrastructure (CNKI) and WANFANG databases prior to April 2017. The search terms included the following key words: (“Irritable bowel syndrome” or “IBS”) AND (“polymorphism” or “allele” or “gene” or “mutation” or “variant”) AND (“G protein beta3” or “G protein β3” or “GNβ3”). Furthermore, the references of all retrieved articles were also checked by hand to identify additional potential studies. The languages were limited to English and Chinese. We inclusion all studies that (1) evaluated the association between GNβ3 polymorphism and the risk of IBS; (2) used a case control design; (3) provided sufficient data of allele and genotype frequencies of SNPs or required information could be calculated; and (4) if serial studies on the same population were published, only the most recent or the largest research study was included. Additionally, we excluded reviews, abstracts, and redundant and animal studies.
Data extraction
Two independent investigators extracted relevant data from all included studies on the basis of the inclusion criteria, and a third investigator verified them. The following information was extracted from all of enrolled studies: the surname of the first author, publication year, country of origin, ethnicity, sample size, genotyping method, and the GNβ3 genotype distributions and alleles in the case and control groups.
Quality assessment
The quality of included studies were assessed by two investigators independently on the basis of Newcastle-Ottawa Scale (NOS) [33], which based on three aspects: selection, comparability and exposure. Studies with a score of 5 points or higher were considered to be of high quality.
Statistical analysis
The HWE of the genotype distributions in the controls of the include studies were tested by the Chi-square test, P < 0.05 was considered statistically significant. Studies with the controls not in HWE were subjected to a sensitivity analysis [34]. The power analysis was calculated by using the Power and Sample Size Program software [35]. The associations of the GNβ3 polymorphism with the risk of IBS was assessed by the pooled ORs with the corresponding 95% CIs under the following genetic models: allele model (C vs. T), codominant model (CC vs. TT and CT vs. TT), dominant model (CC + CT vs. TT), and recessive model (CC vs. CT + TT). The heterogeneity between studies was determined by the Cochrane’s Q-statistic test [36], and the inconsistency was quantified with the I2 statistic. When I2 > 50% or PQ ≤ 0.1, which suggest substantial heterogeneity, a random-effects model (DerSimonian-Laird method) [37] was used; otherwise, the fixed-effects model (Mantel-Haenszel method) [32] was applied. Sensitivity analysis was conducted by sequentially omitting each study to evaluate the stability of statistical results. Furthermore, Begg’s funnel plot and Egger’s test [38] was used to evaluate the potential publication bias (P < 0.05 was considered statistically significant). All analyses were conducted using the STATA 12.0 software packages.
Abbreviations
IBS:Irritable bowel syndrome; IBS-C:constipation predominant IBS; IBS-D:diarrhea predominant IBS; IBS-M:mixture of diarrhea and constipation IBS; ORs:odds ratios; 95% CIs:95% confidence intervals; G-protein:Guanine nucleotide binding protein; GNβ3:G-protein β3 subunit gene; SNP:single nucleotide polymorphism; HWE:Hardy-Weinberg equilibrium; NOS:Newcastle- Ottawa Scale; MAF: minor allele frequencies; EAS:East Asian population; AMR:Ad Mixed American population; EUR:European population; PRISMA:Preferred Reporting Items for Systematic Reviews and Meta-Analyses; CNKI:Chinese National Knowledge Infrastructure.
Author contributions
Study Conception and Design: TMG, DBJ and DH. Acquisition of data: DH, TL and WMC. Preparation of Figures: DH, TL and YW. Preparation of tables: TL, DH, HYC and YW. Writing and revision of the manuscript: TMG and XLM.
ACKNOWLEDGMENTS
We thank the hospital for providing a good research platform for us, and thank the family for their support and understand in work and study.
CONFLICTS OF INTEREST
The authors declare no conflicts of interest.
REFERENCES
1. Chey WD, Kurlander J, Eswaran S. Irritable bowel syndrome: a clinical review. JAMA. 2015; 313:949–58. https://doi.org/10.1001/jama.2015.0954.
2. Sperber AD, Dumitrascu D, Fukudo S, Gerson C, Ghoshal UC, Gwee KA, Hungin APS, Kang JY, Minhu C, Schmulson M, Bolotin A, Friger M, Freud T, et al. The global prevalence of IBS in adults remains elusive due to the heterogeneity of studies: a Rome Foundation working team literature review. Gut. 2017; 66:1075–82. https://doi.org/10.1136/gutjnl-2015-311240.
3. Drossman DA. The functional gastrointestinal disorders and the Rome III process. Gastroenterology. 2006; 130:1377–90. https://doi.org/10.1053/j.gastro.2006.03.008.
4. Longstreth GF, Thompson WG, Chey WD, Houghton LA, Mearin F, Spiller RC. Functional bowel disorders. Gastroenterology. 2006; 130:1480–91. https://doi.org/10.1053/j.gastro.2005.11.061.
5. Holtmann G, Goebell H, Jockenhoevel F, Talley NJ. Altered vagal and intestinal mechanosensory function in chronic unexplained dyspepsia. Gut. 1998; 42:501–6.
6. Camilleri M. Peripheral mechanisms in irritable bowel syndrome. N Engl J Med. 2012; 367:1626–35. https://doi.org/10.1056/NEJMra1207068.
7. Zheng Z, Tang H. Decreased neuroplasticity may play a role in irritable bowel syndrome: implication from the comorbidity of depression and irritable bowel syndrome. J Neurogastroenterol Motil. 2015; 21:298–9. https://doi.org/10.5056/jnm14158.
8. Gazouli M, Wouters MM, Kapur-Pojskic L, Bengtson MB, Friedman E, Nikcevic G, Demetriou CA, Mulak A, Santos J, Niesler B. Lessons learned--resolving the enigma of genetic factors in IBS. Nat Rev Gastroenterol Hepatol. 2016; 13:77–87. https://doi.org/10.1038/nrgastro.2015.206.
9. de Vries DR, ter Linde JJ, van Herwaarden MA, Smout AJ, Samsom M. Gastroesophageal reflux disease is associated with the C825T polymorphism in the G-protein beta3 subunit gene (GNB3). Am J Gastroenterol. 2009; 104: 281–5. https://doi.org/10.1038/ajg.2008.139.
10. Lee HJ, Lee SY, Choi JE, Kim JH, Sung IK, Park HS, Jin CJ. G protein beta3 subunit, interleukin-10, and tumor necrosis factor-alpha gene polymorphisms in Koreans with irritable bowel syndrome. Neurogastroenterol Motil. 2010; 22:758–63. https://doi.org/10.1111/j.1365-2982.2010.01496.x.
11. Markoutsaki T, Karantanos T, Gazouli M, Anagnou NP, Ladas SD, Karamanolis DG. Serotonin transporter and G protein beta 3 subunit gene polymorphisms in Greeks with irritable bowel syndrome. Dig Dis Sci. 2011; 56:3276–80. https://doi.org/10.1007/s10620-011-1726-7.
12. Park CS, Uhm JH. Polymorphisms of the Serotonin Transporter Gene and G-Protein beta3 Subunit Gene in Korean Children with Irritable Bowel Syndrome and Functional Dyspepsia. Gut Liver. 2012; 6:223–8. https://doi.org/10.5009/gnl.2012.6.2.223.
13. Melien O. Heterotrimeric G proteins and disease. Methods Mol Biol. 2007; 361:119–44. https://doi.org/10.1385/1-59745-208-4:119.
14. Siffert W. G-protein beta3 subunit 825T allele and hypertension. Curr Hypertens Rep. 2003; 5:47–53.
15. Klenke S, Kussmann M, Siffert W. The GNB3 C825T polymorphism as a pharmacogenetic marker in the treatment of hypertension, obesity, and depression. Pharmacogenet Genomics. 2011; 21:594–606. https://doi.org/10.1097/FPC.0b013e3283491153.
16. Siffert W, Rosskopf D, Siffert G, Busch S, Moritz A, Erbel R, Sharma AM, Ritz E, Wichmann HE, Jakobs KH, Horsthemke B. Association of a human G-protein beta3 subunit variant with hypertension. Nat Genet. 1998; 18:45–8. https://doi.org/10.1038/ng0198-45.
17. Fang L, Zhou C, Bai S, Huang C, Pan J, Wang L, Wang X, Mao Q, Sun L, Xie P. The C825T Polymorphism of the G-Protein beta3 Gene as a Risk Factor for Depression: A Meta-Analysis. PLoS One. 2015; 10: e0132274. https://doi.org/10.1371/journal.pone.0132274.
18. Bullido MJ, Ramos MC, Ruiz-Gomez A, Tutor AS, Sastre I, Frank A, Coria F, Gil P, Mayor F Jr, Valdivieso F. Polymorphism in genes involved in adrenergic signaling associated with Alzheimer’s. Neurobiol Aging. 2004; 25:853–9. https://doi.org/10.1016/j.neurobiolaging.2003.10.006.
19. Bagos PG, Elefsinioti AL, Nikolopoulos GK, Hamodrakas SJ. The GNB3 C825T polymorphism and essential hypertension: a meta-analysis of 34 studies including 14,094 cases and 17,760 controls. J Hypertens. 2007; 25:487–500. https://doi.org/10.1097/HJH.0b013e328011db24.
20. Hwang IC, Kim KK, Ahn HY, Suh HS, Oh SW. Effect of the G-protein beta3 subunit 825T allele on the change of body adiposity in obese female. Diabetes Obes Metab. 2013; 15:284–6. https://doi.org/10.1111/dom.12023.
21. Mitchell A, Pace M, Nurnberger J, Wenzel RR, Siffert W, Philipp T, Schafers RF. Insulin-mediated venodilation is impaired in young, healthy carriers of the 825T allele of the G-protein beta3 subunit gene (GNB3). Clin Pharmacol Ther. 2005; 77:495–502. https://doi.org/10.1016/j.clpt.2005.03.002.
22. Safarinejad MR, Safarinejad S, Shafiei N, Safarinejad S. G-protein beta3 subunit gene 825C/T polymorphism and its association with the presence, severity, and duration of vasculogenic erectile dysfunction. Fertil Steril. 2013; 99:69–75. https://doi.org/10.1016/j.fertnstert.2012.08.033.
23. Holtmann G, Siffert W, Haag S, Mueller N, Langkafel M, Senf W, Zotz R, Talley NJ. G-protein beta 3 subunit 825 CC genotype is associated with unexplained (functional) dyspepsia. Gastroenterology. 2004; 126:971–9.
24. Andresen V, Camilleri M, Kim HJ, Stephens DA, Carlson PJ, Talley NJ, Saito YA, Urrutia R, Zinsmeister AR. Is there an association between GNbeta3-C825T genotype and lower functional gastrointestinal disorders? Gastroenterology. 2006; 130:1985–94. https://doi.org/10.1053/j.gastro.2006.03.017.
25. Saito YA, Larson JJ, Atkinson EJ, Ryu E, Almazar AE, Petersen GM, Talley NJ. The role of 5-HTT LPR and GNbeta3 825C>T polymorphisms and gene-environment interactions in irritable bowel syndrome (IBS). Dig Dis Sci. 2012; 57:2650–7. https://doi.org/10.1007/s10620-012-2319-9.
26. Kim HG, Lee KJ, Lim SG, Jung JY, Cho SW. G-Protein Beta3 Subunit C825T Polymorphism in Patients With Overlap Syndrome of Functional Dyspepsia and Irritable Bowel Syndrome. J Neurogastroenterol Motil. 2012; 18:205–10. https://doi.org/10.5056/jnm.2012.18.2.205.
27. Saito YA, Locke GR 3rd, Zimmerman JM, Holtmann G, Slusser JP, de Andrade M, Petersen GM, Talley NJ. A genetic association study of 5-HTT LPR and GNbeta3 C825T polymorphisms with irritable bowel syndrome. Neurogastroenterol Motil. 2007; 19:465–70. https://doi.org/10.1111/j.1365-2982.2007.00905.x.
28. Camilleri M, Busciglio I, Carlson P, McKinzie S, Burton D, Baxter K, Ryks M, Zinsmeister AR. Pharmacogenetics of low dose clonidine in irritable bowel syndrome. Neurogastroenterol Motil. 2009; 21:399–410. https://doi.org/10.1111/j.1365-2982.2009.01263.x.
29. Wang Y, Wu Z, Qiao H, Zhang Y. A genetic association study of single nucleotide polymorphisms in GNbeta3 and COMT in elderly patients with irritable bowel syndrome. Med Sci Monit. 2014; 20:1246–54. https://doi.org/10.12659/MSM.890315.
30. Choi YJ, Hwang SW, Kim N, Park JH, Oh JC, Lee DH. Association Between SLC6A4 Serotonin Transporter Gene Lainked Polymorphic Region and ADRA2A -1291C>G and Irritable Bowel Syndrome in Korea. J Neurogastroenterol Motil. 2014; 20:388–99. https://doi.org/10.5056/jnm14020.
31. Pan ZG, Xiao C, Su DX. No association of G-protein beta polypeptide 3 polymorphism with irritable bowel syndrome: evidence from a meta-analysis. World J Gastroenterol. 2014; 20:6345–52. https://doi.org/10.3748/wjg.v20.i20.6345.
32. Mantel N, Haenszel W. Statistical aspects of the analysis of data from retrospective studies of disease. J Natl Cancer Inst. 1959; 22:719–48.
33. Stang A. Critical evaluation of the Newcastle-Ottawa scale for the assessment of the quality of nonrandomized studies in meta-analyses. Eur J Epidemiol. 2010; 25:603–5. https://doi.org/10.1007/s10654-010-9491-z.
34. Thakkinstian A, McElduff P, D’Este C, Duffy D, Attia J. A method for meta-analysis of molecular association studies. Stat Med. 2005; 24:1291–306. https://doi.org/10.1002/sim.2010.
35. Dupont WD, Plummer WD Jr. Power and sample size calculations. A review and computer program. Control Clin Trials. 1990; 11:116–28.
36. Colditz GA, Burdick E, Mosteller F. Heterogeneity in meta-analysis of data from epidemiologic studies: a commentary. Am J Epidemiol. 1995; 142:371–82.
37. DerSimonian R. Meta-analysis in the design and monitoring of clinical trials. Stat Med. 1996; 15:1237–48; discussion 49-52. https://doi.org/10.1002/(SICI)1097-0258(19960630)15:12<1237::AID-SIM301>3.0.CO;2-N.
38. Egger M, Davey Smith G, Schneider M, Minder C. Bias in meta-analysis detected by a simple, graphical test. BMJ. 1997; 315:629–34.