
INTRODUCTION
Acute myeloid leukemia (AML) is characterized by excessive expansion of myeloblasts in the bone marrow. Regardless of their morphologic subtypes, only a fraction of these cells can recapitulate leukemia generation in sublethally irradiated NOD/SCID mice [1]. These leukemia generating cells, the LSCs, can arise from the neoplastic transformation of normal HSPCs [2, 3]. Like normal HSPCs, LSCs are enriched in the CD34+CD38- cell subpopulation [4, 5]. Immunophenotype alone is not reliable to accurately define LSCs. LSCs have been defined as CD34+CD38-CD90-CD71-, in contrast to HSPCs which have a phenotype most consistent with CD34+CD38-CD90+CD71+ [5]. But still, LSCs may also be CD90+ or even CD34- [6, 7]. Furthermore, LSCs are not successfully targeted or particularly sensitive to current chemotherapy or immunotherapy regimens because they are mostly quiescent, express multidrug resistant genes (MDRs), and are likely less immunogenic than more mature progenitors [8]. Because they share essential cellular pathways with normal HSPCs like Bmi1, PTEN and quiescence genes [9, 10]. one major challenge in targeting LSCs is identifying pathways that are not required for normal HSPC survival and differentiation to minimize detrimental hematopoietic toxicity.
Sall1 is one of four members of the Spalt (‘Spalt-like’ (Sall/HSAL)) family of evolutionarily conserved genes that were originally identified in Drosophila and are critical for organogenesis [11]. SALL1, is zinc-finger transcription factor and a member of the transcriptional network that regulates embryonic stem cell pluripotency, in association with Nanog and Sox2 [12]. It has a unique expression profile in adult tissues, which includes the kidneys and brain but it is not significantly expressed in normal marrow [13, 14]. Mice lacking Sall1 expression are not viable as a result of a severe kidney dysgenesis [15]. In humans, heterozygous mutations of SALL1 can lead to Townes-Brocks syndrome, an autosomal dominant developmental disorder that is characterized by kidney and heart anomalies together with other phenotypic abnormalities [16]. SALL1 silencing via promoter hypermethylation was described in human breast cancer [17]. and lymphoid leukemia [18]. On the other hand SALL1 is highly expressed in Wilm’s tumors and is associated with aggressive behavior suggesting dual oncogenic and tumor suppressor function [19, 20]. More recently Sall1 was reported to regulate an inflammatory program in the otherwise ‘immunologically unique central nervous system via maintaining microglia as resting tissue macrophages rather than proinflammatory phagocytes. Sall1 deletion in microglia produced up- regulation of genes encoding proinflammatory proteins and activation of genes associated with the identity of other tissue macrophages [21]. This suggests a role for SALL1 in immune regulation at least in the brain. Two SALL1 transcript variants encoding different protein isoforms (isoforms A and B) have been reported (NCBI data base).
Here we report on the constitutive expression of SALL1 in human AML and its potential role in AML development. Most importantly, we present SALL1 as a potential unique molecular marker for LSCs.
RESULTS
SALL1 is expressed in human primary AML samples and in AML cell lines but not significantly in NBM samples
Expression assay by immunohistochemistry revealed positive nuclear SALL1 immunostaining in 50 randomly selected AML samples, Figure 1A. The genetic characterization of these samples are shown in Table 1. Positive staining was defined as > 15% of cells demonstrating a nuclear staining. In the majority of the cases, more than 30% of the cells were positive, and there was a strong correlation between SALL1 positivity and blast count. In occasional cases, weak cytoplasmic staining was observed, however, this was regarded as nonspecific as only definitive nuclear staining was considered to be positive. None of the ten NBM samples showed any SALL1 expression by immunostaining.
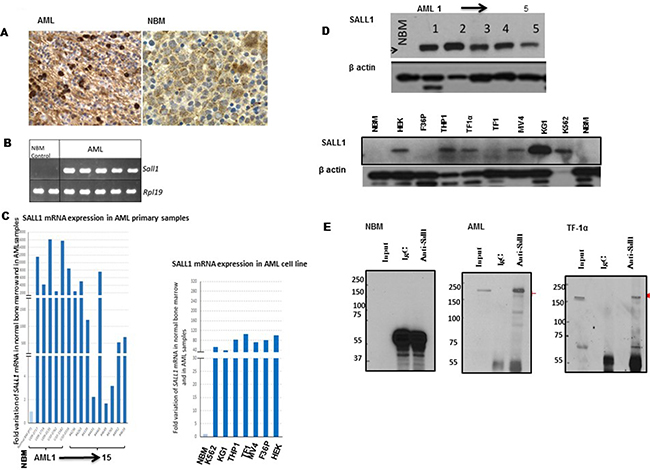
Figure 1: SALL1 is expressed in human AML samples and cell lines (A) Positive nuclear IHC staining for SALL1 in AML compared to NBM. (B) RT-PCR and (C) qRT-PCR analysis of SALL1 expression in AML samples and AML cell lines as well as in NBM samples. The expression data were normalized to Rpl19 standard invariant gene levels. (D) Western blotting analyses of SALL1 protein expression in AML samples, and cell lines and in NBM sample. (E). Immunoprecipitation of RIPA buffer harvested total protein. Proteins were then analyzed by SDS-PAGE and membranes probed with monoclonal anti-SALL1 antibodies.
Table 1: Genetic characteristics of AML samples
Normal karyotype (NO = 25) |
Monosomy 7 (NO = 10) |
Monosomy 8 (NO = 3) |
CBF t(8;21) (NO = 7) |
inv16 (NO = 3) |
Unknown (NO = 2) |
|---|---|---|---|---|---|
FLT3-ITD: 7 |
FLT3-ITD: 3 |
FLT3-TKD: |
Reverse transcription (RT)-PCR, Figure 1B, and quantitative reverse transcription Q-RT-PCR, Figure 1C were used to evaluate mRNA expression patterns of SALL1 in AML primary samples (15 shown, 50 examined), AML cell lines (n = 7) and in NBM (2 shown, 10 examined). HEK293 cells were used as positive control. SALL1 mRNA was expressed in leukemia cells and cell lines at a much higher level than in NBM. Relative expression of SALL1 is illustrated in relation to ribosomal protein gene RPL19 expression as a housekeeping gene. There was significant inter-sample variation of SALL1 m-RNA level compared to normal marrow expression, ranging from 2- to 16000-fold. This wide variation was not observed across AML cell lines in which expression levels ranged between 40-to 110-fold compared to NBM.
We next examined SALL1 protein patern of expression by WB. AML samples (5 shown, 20 examined) and AML cell lines (No = 7) were tested. SALL1 is reported to be expressed at two sizes, a ~150 kDa and a ~200 kDa protein bands, possibly reflecting the two variants of coding mRNA (A: NM_002968.2 and B: NM_001127892.1). In our study, these two variants were both expressed in HEK293 cells. In contrast, one SALL1 protein band was detecetd in AML patients’ samples and in the majority of AML cell lines, while no SALL1 protein was detected in NBM, Figure 1D. Immunoprecipitation confirmed that SALL1 is undetectable in NBM, Figure 1E. Furthermore, SALL1 peptides were isolated from the corresponding band stained by 1% Coomassie brilliant blue and analysed by mass spectrometry, Supplementary Figure 1. Unlike the specific SALL1 expression in AML and AML cell lines, other SALL family proteins, SALL2 and SALL4 were also expressed in NBM, Supplementary Figure 2.
SALL1 is preferentially expressed in LSCs enriched CD34+/CD38- cell subpopulation in AML
SALL1 expression has been associated with stem cell signature patterns [30]. LSCs enriched CD34+/CD38- cell subpopulation preferentially expressed SALL1 mRNA, Figure 2A, and SALL1 protein, Figure 2B. SALL1 was not detected in NBM.
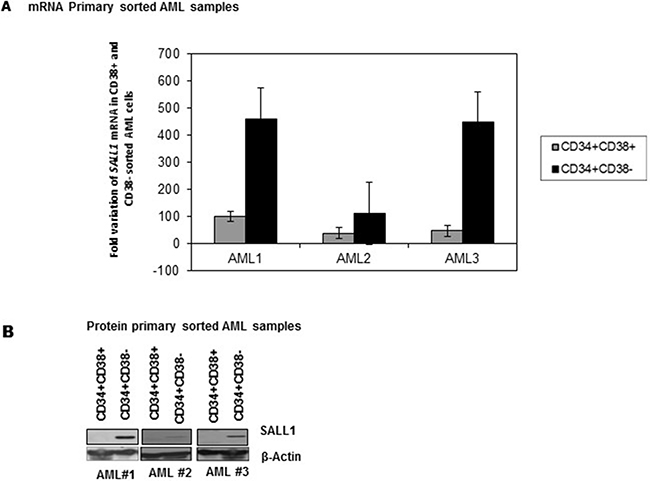
Figure 2: Preferential SALL1 expression in LSCs enriched CD34+/CD38- cell subpopulation. (A) qRT-PCR analysis of SALL1 mRNA expression in sorted LSCs enriched CD34+/CD38- subpopulation compared to CD34+/CD38+ subpopulation (B). Western blotting analysis of SALL1 protein expression in sorted AML cells.
SALL1 exonal pattern and protein size in AML indicate the presence of a novel protein isoform
Four transcripts of protein coding SALL1 are reported with NM_001127892.1 (isoform B) and NM_002968.2 (isoform A) being the most studied. Protein coding regions of transcript variant 1 and variant 2 are illustrated in Figure 3A (dark sections). To determine which SALL1 transcript is activated in AML, we first examined the presence of each of SALL1’s three exons. Both genomic DNA and cDNA were examined, Figure 3B. All three exons of SALL1 genomic DNA were detected in HEK293T, primary AML, and AML cell lines and in NBM alike, first panel Figure 3B. Reverse transcriptase was used to determine mRNA expression. All three exons were expressed in HEK293 cells while exon 1 was not detected in transcripts from AML and AML cell lines. We further verified this expression pattern with long range PCR. HEK293T cells expressed the three SALL1 mRNA encoding exons as well as exons 2 and 3 in one transcript. Only transcripts expressing exons 2 and 3 were confirmed to exist in AML cells and cell lines. SALL1 mRNA expression was not detected in NBM. The absence of exon 1 expression in AML suggested that SALL1 transcript variant 2 (NM_001127892.1) is the activated transcript in AML. However the first peptide that was detected by mass spectrometry sequence GQPSRPTK, Supplementary Figure 1, is in fact encoded in the presence of transcript 1 exon 2 cDNA and not transcript 2. To explain this finding, we examined the SALL1 transcripts as reported in Ensembl genome browser 90. As reported, in transcript 1 (NM_002968.2) translation starts at the beginning of exon 1 (ATG 017-020) and continues through the 5′ of exon 2 and deep into exon 3. In transcript 2 (NM_001127892.1) translation begins deeper in exon 2 (ATG 433-435) missing the beginning of exon 2 3′. Consistent with the primer location that worked best to detect SALL1 (5′ GAGACACAGAAAAGGGTCAACCG 3′- 108–130), we believe that translation in AML starts at the beginning of exon 2 (ATG 105–107) of transcript variant 1. This will account for a protein that is missing the first 25aa of isoform 1, and explain the SALL1 band size in AML that is close to the 200Kd band reported for isoform 1 protein. This also is supported by that our data clearly show that exon1 mRNA is not detected in AML.
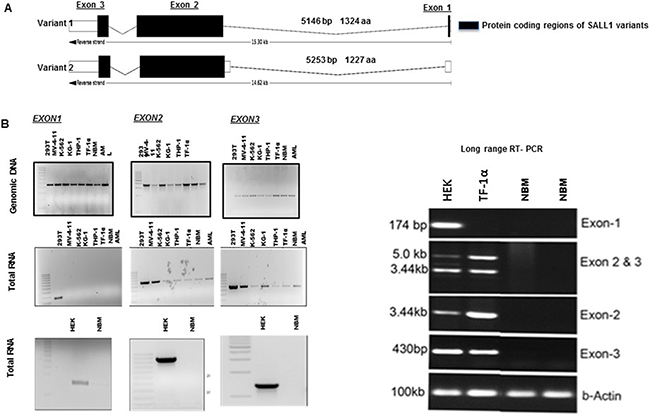
Figure 3: Exonal pattern of SALL1 expression on AML (A) Schematic illustration of SALL1 gene: All three exons of variant 1 are protein coding, while only exons 2 and 3 are in variant 2. (B). PCR of SALL1 genomic DNA and RT-PCR of SALL1 mRNA expression in HEK293, AML cells, AML cell lines and in NBM: All three exons of SALL1 are detected in genomic DNA of HEK293, AML cell lines, NBM, and AML. cDNA from SALL1 exon1 was expressed in HEK293 cells, but not in AML cells and cell lines. Exons 2 and 3 were detected in HEK293 cells and malignant cells. SALL1 mRNA was not detected in NBM. (C). Long-range RT-PCR using exon specific primers: exons 1, 2 and 3 were detected HEK293. Exons 2 and 3 but not exon1 were detected in AML TF1-α cell line at one length. SALL1 was not detected in NBM. Our primer is designed to detect the 3’ end of exon 2.
SALL1 inhibition results in inferior cell proliferation and inferior AML engraftment in mice
To determine the effects of SALL1 inhibition on cellular proliferation and leukemia engraftment in mice, HEK293 cells, AML cell lines MV4-11 and THP1cells were stably infected with either sh-RNA constructs (NO 4) directed against SALL1 (sh-SALL1) or against GFP (ctrl-GFP-SALL1) with over 80% transfection efficiency. Primary AML CD34+ positive cells and NBM cells were transiently infected without puromycin selection with either sh-RNA against SALL1 or against GFP. These sh-RNA constructs were aligned with SALL1 variants sequence to confirm specificity. SALL1 protein expression and residual target mRNA levels following SALL1 inhibition were determined via WB and q RT–PCR, Figure 4A. SALL1 expression was downregulated the most, by over 90% in HEK293 cells, and in MV4-11 AML cell lines, while 60% level of expression reduction was achieved in THP-1 cell lines and only modestly in primary AML samples. NBM CD34 + cells were treated as a control; no expression (or downregulation) was detected and shRNA treatment did not affect these cells (see proliferation assay, Figure 4B). sh-SALL1 MV4-11 cells demonstrated inferior proliferation when treated with Proliferation Reagent WST-1 compared to ctrl-GFP-SALL1 MV4-11 cells. No difference was seen in HEK293 proliferation with SALL1 inhibition (data not shown) . NBM CD34+ cells showed similar proliferation in both sh-SALL1 treated and ctrl-GFP-SALL1 treated plates. Of note, proliferation difference was more apparent in MV4-11 cells that have less residual SALL1 than THP-1(data not shown). This may indicate that SALL1 affects cellular proliferation in a dose dependent manner, although experiments involved two different cell lines. SALL1 inhibition was associted with improved granulocytic and monocytic colony forming unit capacity (GM-CFUs) compared to ctrl-GFP-SALL1 treated cells , Figure 4C, suggesting that loss of SALL1 lead to differentiation of leukemic cells. GM-CFUs were identified by morphology.
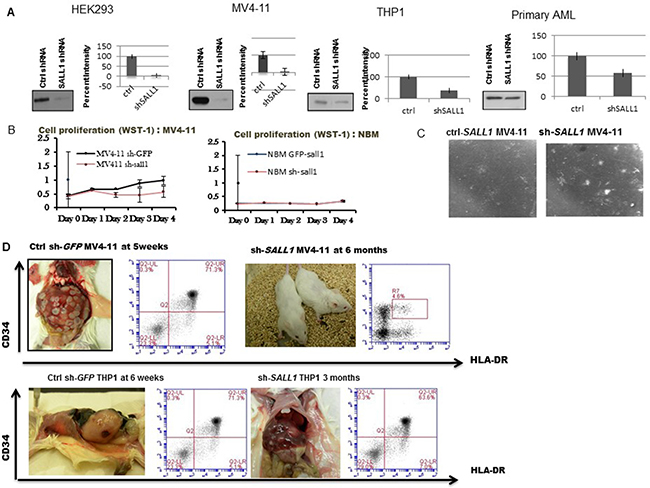
Figure 4: SALL1 Inhibition is associated with decreased cellular proliferation, improved GM-CFUs formation and inferior AML engraftment in NSG mice. (A) qRT-PCR and western blot analysis of SALL1 inhibition: HEK293 cells, 2 AML cell lines (MV4-11 and THP1) were stably infected and 1 AML primary patient sample was transiently infected with shRNAs of SALL1. Transfection efficiency was different amongst different cells ranging between >90% in MV4-11 to 40% in AML primary cells. (B) Cell proliferation: MV4-11 cells treated with sh-RNA against SALL1 or against GFP were incubated with cell proliferation WST-1 reagent. Sh-SALL1 treated cells showed a significant reduction in proliferation. And in (C) induced GM-colony formation. (D) In vivo engraftment of sh-SALL1 and of ctr-GFP MV4-11 and THP1 cells: SALL1 inhibition in MV4-11 cells resulted in AML engraftment and mice became morbid at an average of 5 weeks compared to mice injected with GFP-SALL1 MV4-11 cells which were alive and looked healthy at 6 months after treatment and with no evidence of leukemia when sacrificed. Spleen cells are sorted to HLA-DR and CD34 human AML markers. Less efficient SALL1 inhibition in THP1 cells resulted in delayed AML engraftment by an average of 9 weeks.
To examine the effect of SALL1 downregulation on leukemia engraftment in vivo, we traced human AML cell lines engraftment and leukemia progression in irradiated NSG mice injected with MV4-11 or THP1 cells treated with either sh-SALL1 or ctrl-GFP-SALL1, 5 mice in each group, Figure 4D. Human cells engraftment was documented in all mice via flowcytometric analysis for (GFP+)/CD45+. Mice engrafted with MV4-11 ctrl-GFP-SALL1 treated cells developed AML and died on an average of 5 weeks, significantly earlier than those engrafted with MV4-11 sh-SALL1 cells. The latter remained alive and showed no symptoms of sickness at 6 months with no experiment related death in this mice cohort and a p value of < 0.01 based on a non parametric Wilcoxon rank test. In the THP1 group, mice engrafted with ctrl-GFP-SALL1 THP1 cells developed AML and died at an average of 6 weeks, about 9 weeks earlier compared to those injected with sh-SALL1 THP1 who developed AML and died at average of 16 weeks with a p value 0.0122. Again SALL1 inhibition in THP1 was not as efficient as it was with MV4-11 (~60% downregulation versus 90%). When sacrificed after 6 months, sh-SALL1 MV4-11 were found to be engrafted with CD45+ human cells yet they remained leukemia free.
SALL1 inhibition was associated with alterations in cellular protein expression including PTEN upregulation
There is only limitted information about SALL1’s role in cellular signaling and transcriptional regulation apart from the few described in embryonic development and in breast and renal cell cancers [17, 18]. To learn about its protein interactions in AML, we hypothesized that SALL1 may interact with proteins or interfere with signaling pathways in LSC differentiation arrest and proliferation. The tumor suppressor gene phosphatase and tensin homolog (PTEN) plays an important role in the balance between proliferation and differentiation of blood cells progenitors. In 2006, two independent studies reported that PTEN deletion in HSPCs leads to their lineage fate determination restriction, exhaustion and, importantly, to leukemogenesis [22, 23]. SALL1 and PTEN were reported to have direct interactions with SALL4 promotors and possibly inter-regulating effects [24, 25]. Thus, we evaluated PTEN expression in AML samples and cell lines with and without SALL1 inhibition. As shown in Figures 5A and 5B, SALL1-inhibition resulted in PTEN protein upregulation in AML cell lines and primary samples. This was accompanied by downregulation of total and phosphorylated m-TOR. In the THP1 cell line, where PTEN is reported to be deleted at the genomic leve [26], SALL1 inhibition did not affect total or phospho-m-TOR, Figure 5C. It however downregulated both NF-κB, which is aberrantly expressed in AML progenitor cells, and β-catenin, which exerts control on AML blast proliferation and engraftment [27, 28]. Figure 5D. β catenin was previously reported to be regulated by SALL1 [29]. β catenin and NF-κB were also downregulated when SALL1 was inhibitied in MV4-11.
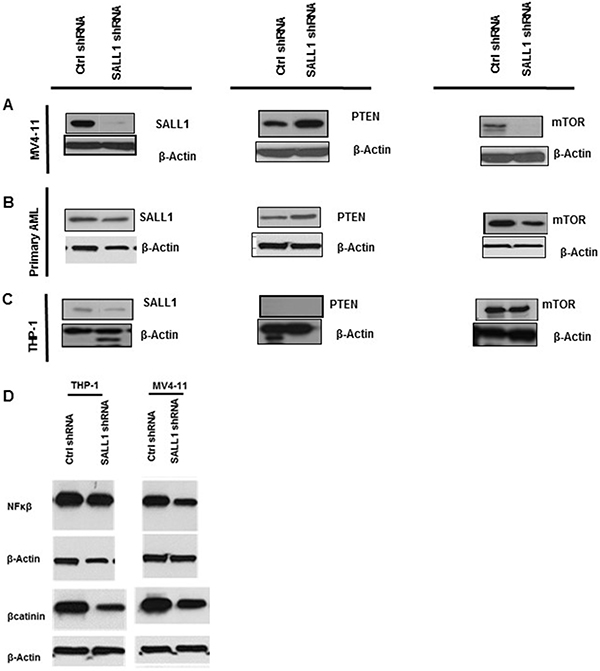
Figure 5: SALL1 inhibition resulted in upregulation of PTEN expression and inhibition of down-stream m-TOR and in downregulation of B-catenin and NF-κB: (A, B) SALL1 inhibition resulted in upregulation of PTEN and inhibition of m-TOR in MV4-11 and primary AML, more prominent with MV4-11 where SALL1 downregulation efficiency was almost 100%, than in primary AML. (C) In genomic PTEN deleted THP1 cells, mTOR did not change. (D) SALL1 inhibition is shown with decreased B-catinin, and NF-κB expression in in both MV4-11 and THP1.
DISCUSSION
The important role of SALL1, a homeotic gene and a transcription factor, in human development was recognized because heterozygous SALL1 mutations lead to Townes-Brocks syndrome. SALL1′s oncogenic role in leukemogenesis is described here for the first time.
Biochemical cellular operations vital survival of normal HSPCs and LSCs are mostly similar. Oncogenic alterations confer self-renewing potential by affecting pathways that are also functional in normal stem cells [30]. Hence, targeting such common pathways is often limited by significant toxicity to normal cells. Pursuing genes, proteins or signaling pathways involved in leukemogenesis, but with little or no involvement in normal HPCs survival and differentiation would be ideal for therapeutic target development [10, 31]. We identified a SALL1 isoform that is expressed in AML, and preferentially in the LSCs enriched CD34+/CD38- subpopulation, but not in NBM. Reports on normal marrow expression of SALL1 amongst available data sets such as the human protein atlas (http://www.proteinatlas.org/search/sall1) and uniProt (http://www.uniprot.org/uniprot/Q9NSC2) are inconsistant. The former reports one case displaying a weak cytoplasmic and membranous staining for SALL1 in NBM and the latter excludes NBM from SALL1 tissue expression. In this study we showed that SALL1 protein is not expressed in NBM And that it is expression pattern in AML is strictly nuclear. These findings demonstrate that it is possible to identify transcriptional circuits and biomarkers that are unique to neoplastic LSCs and not functionally required in their normal HSPCs counterparts within the exact same tissue. SALL1 distinct expression in LSCs and lack of expression in HSPCs suggests that SALL1 is a potential unique biomarker for AML. SALL1 expression is not limited to a subset of AML patients . Moreover, it is not a mutation or an overexpression above a cetrtain baselin in NBM, but rather de novo distinctive expression in LSCs. Such a decisive pattern of a biomarker expression is direly needed in the MRD setting in the absence of another AML specific phenotypic or molecular marker, which occurs in 40% of AMLs. Verification study that SALL1 could offer this important distinction in this critical setting is ongoing.
SALL1 inhibition conferred weaker proliferation on AML cells and AML cell lines. We and others have previously reported that loss of Sall1 in developing kidney leads to ectopic or accelerated differentiation of multipotent renal progenitor cells [32]. Here we show that consistent with its role as a differentiation repressor, SALL1 inhibition in AML cells promoted them towards differentiation by forming more mature monocytic and granulocytic colonies upon morphological exam of CFU assay. Further studies are necessary to test the differentiation advantage of SALL1 inhibition in vivo.
To directly test the impact that SALL1 loss has on leukemogenic in vivo, we generated a humanized mouse xenograft using human AML cell lines with shRNA SALL1 inhibition or sh-GFP. We showed that SALL1 inhibition was associated with inferior leukemia engraftment and prolonged survival compared to GFP- xenografted control cells. Our investigation of the potential mechanism of SALL1 involvement in leukemogenesis demonstrated that SALL1 inhibition restored or increased PTEN expression in AML cells and cell lines. Leukemogenesis is sensitive to even subtle changes in PTEN dosage. Consequently, mechanisms regulating PTEN protein expression could potentially play a critical role in leukemia development and possibly its course, response to treatment and prognosis [22]. Thus restoring PTEN functions directly or indirectly holds potential therapeutic promise. Inhibition of SALL1 may potentially be an indirect way to upregulate PTEN as a therapeutic goal. SALL1 inhibition did not upregulate PTEN levels “further” in HEK293 cells in which PTEN was abundant with and without SALL1 inhibition. Of note, PTEN also plays an important role in balancing HSCs normal proliferation and differentiation [10, 22]. Additionally our xenograft model suggests that other leukemogenic pathways such as β-catenin and NF- қB were also impacetd by the loss of SALL1, particularly interesting in THP1 cells (PTEN-deleted).
In ongoing work, the potential for the clinical application of SALL1 as a molecular marker for monitoring of MRD in AML as compared to other standard methods will be validated. Concurrently, we will examine if SALL1 expression level according to a standerized expression score on IHC and on a standarized fold-expression assessment by RT PCR is of prognostic value that could impact treatment outcomes. Additionally, our ongoing work will examine if SALL1 inhibition in vivo preclinical models can lay foundations for future clinical therapeutic targetting.
MATERIALS AND METHODS
Cell cultures, lentiviral infections, mRNAi, cell proliferation and CFU colony formation assay
Embryonic kidney cell line HEK293T, known to express SALL1, and AML cell lines (MV4-11, THP-1,KG-1, K-562, TF-1, TF-1α) as well as CD34+ cells sorted from normal BM were purchased from ATCC ( American Type Culture Collection, Manassas, VA, USA). HEK293T cell line was grown at 37°C with 5% CO2 in Dulbecco’s modified Eagle medium (DMEM from Gibco/Life Technologies, Carlsbad, CA, USA) and used as positive control for SALL1 expression. AML cell lines were grown at 37°C with 10% CO2 in RPMI 1640 (Gibco/Life Technologies), both supplemented with 10% fetal bovine serum (ATLANTA biologicals, Inc., Flowery Branch, GA, USA) and 50 U/mL penicillin and 50 μg/mL streptomycin (Gibco/Life Technologies). Patients’ primary AML cells were provided as a courtesy of Dr. Guido Marcucci (Ohio State University, Columbus, OH, USA) and by the Georgia Regents University Tumor Bank (Augusta, GA, USA). Primary AML cells were cultured in serum free conditions in StemSpanTM SFEM (STEMCELL Technologies, Vancouver, BC, V5Z 1B3, Canada).
Primary cells and cell lines were infected with a lentiviral supernatant (≥ 5 × 10⁶ CFU/μL) produced in HEK293 cells (Thermo Scientific The RNAi Consortium Lentiviral shRNA and Thermo Scientific Trans-Lentiviral Packaging Kits) with a Dharmacon™ shRNA or ORF transfer plasmid. A pool of 4 specific 29mer target-specific shRNA, and one scramble control (OriGene) directed against human SALL1 mRNA or GFP were used to stably infect HEK293 cells, 2 AML cell lines (MV4-11 and THP1). 1 AML primary patient sample and NBM CD34 positive cells (ATCC) were transiently infected with the SALL1 shRNAs for 72 hours and then selected for 4 days in the presence of 2 μg/mL and 1.5 μg/mL puromycin (ThermoFisher Scientific, Waltham, MA, USA). The sequences of the 4 constructs are: AGCGAAGCCTCAACATTTCCAATCCGACC, CTCAAGGTACTTTACGAACATCTGCCAAC, CCAGCCATCTCAGAGTCTACCTCTTCCAT and TTGCTTGTCAGAGTGCCTTGGACATTCAC and all aligned with SALL1 variants of interest sequence.
Cell proliferation assay was performed with the Cell Proliferation Reagent WST-1 following the manufacturer’s instructions (Roche, San Francisco, CA, USA). Cells were seeded in 96 well plate (5,000 cells in 90 μL of culture medium/well) for different time points. Cells were incubated in presence of 10 μL of WST-1 reagent for 1 h before measuring the absorbance of the samples at 450 nm. For colony formation assay, MV4-11 Cells treated with sh-SALL1 or ctrl-GFP-SALL1 were suspended in RPMI and diluted into a final volume of 400 μL RPMI. The final 400 μL cell suspensions were added to 4.0 mL of MethoCult H4320 and plated in triplicate and incubated at 37ºC/5% CO2 in a humidified environment for 10 d prior to counting. Only colonies with ≥ 50 cells were counted and analyzed by morphology.
Extraction of total proteins and SDS--polyacrylamide gel electrophoresis (SDS-PAGE) western blot and immunoprecipitation analysis
Cells were harvested in lysis buffer containing 20 mM Tris-HCL pH 7.5, 150 mM NaCl, 1 mM EDTA, 1 mM EGTA, 1% Triton X-100 or RIPA, 2.5 mM Na4P2O7 (ThermoFisher Scientific) and 1% protease and phosphatase inhibitor cocktail (Roche). Concentration of total proteins was determined with Bio-Rad Protein Assay (Bio-Rad, Hercules, CA, USA).
Different quantities of proteins per sample were analyzed by SDS-PAGE and membranes were probed with anti-SALL1 antibody (1:1000; Abcam, Cambridge, MA, USA, #ab41974), anti-PTEN antibody (1:2000; Cell Signaling Technology,Danvers, MA, USA, #9559), anti-mTOR antibody (1:1000; Cell Signaling Technology, #2972), anti-phosphorylated-mTOR antibody (1:5000; Abcam, #ab109268), anti-NF-κB antibody (1:1000; Cell Signaling Technology, #3987), anti-phosphorylated-NF-κB antibody (1:1000; Cell Signaling Technology, #3031), anti-TRIB2 antibody (1:1000; Cell Signaling Technology, #13533) and anti-β-Actin-Peroxidase antibody (1:50,000; Sigma-Aldrich, Saint-Louis, MO, USA, #A3854). Proteins were incubated with primary antibodies overnight at 4°C. Secondary HRP-conjugated mouse or rabbit (both from Thermo Fisher Scientific, #31432 and #31462 respectively) antibodies were used at a dilution of 1:5000. Membranes were developed using the SuperSignal® West Femto Maximum Sensitivity Substrate (Thermo Fisher Scientific, #34094). Protein quantification was performed with the Image J software (Research Services Branch (RBS), Image Processing and Analysis in Java (http://rsb.info.nih.gov)). For immunoprecipitation, total proteins were extracted using the RIPA buffer containing 50 mM Tris-HCl pH 7.4, 1% Nonidet-P40, 0.5% C24H39NaO4 (sodium deoxycholate), 0.1% SDS, 150 mM NaCl, 2mM EDTA, 50 mM NaF (all from Thermo Fisher Scientific) and 1% protease and phosphatase inhibitor cocktail (Roche). Two micrograms of total proteins were incubated overnight, at 4°C with either 15 μL anti-SALL1 antibody (Abiocode, Agoura Hills, CA, USA, #R1428-1) or 2 μg anti-Rabbit IgG antibody (Rockland, Gilbertsville, PA, USA, #KCC003). The next day, 50 μL of Protein A/G coupled to magnetic beads (Thermo Fisher Scientific) were added to total proteins for 3 h at 4°C. Total proteins were then submitted for magnetic sorting, following the manufacturer’s instructions. Proteins associated to the beads were resuspended into 80 μL of 2X Laemmli buffer, containing 50 mM Tris-HCl pH 6.8, 2% SDS, 0.1% Bromophenol blue, 100 mM Dithiothreitol (DTT) and 10% glycerol. Proteins were then analyzed by SDS-PAGE and membranes were probed with anti-SALL1 antibody (Abcam).
Preparation of total proteins for SDS-PAGE and mass spectrometry (MS)
Total proteins from KG1 leukemic cell line were extracted as described above and separated by SDS-PAGE in 8% polyacrylamide gel. Proteins were stained by 1% Coomassie brilliant blue G250 (Sigma-Aldrich) in 1% phosphoric acid, 5% ammonium sulfate and 8% ethanol. De-staining of the slab gel was achieved with distilled water. Pieces of gel containing proteins of interest were cut out and sent to Applied Biomics, Inc, Proteomics Service (Hayward, CA, USA) for mass spectrometry and protein/peptides identification. Gel pieces were then treated and proteins contained in gel pieces were digested with trypsin. Peptides were extracted and MALDI-TOF/TOF MS analysis was performed. Protein identification was based on peptide fingerprint mass mapping using mass spectrometry data and on peptide fragmentation mapping using MS/MS data. The peaklist files were searched against the UniProtKB/Swiss-Prot or NCBI database using MASCOT search engine to identify proteins.
Extraction of genomic DNA, total RNA, RT-PCR and quantitative-PCR
Total gDNA was prepared from HEK293T, leukemic cell lines and one AML sample from patient with the DNAzol® Reagent (Gibco / Life Technologies) following the manufacturer’s instructions. SALL1 exons were amplified by PCR with specific primers: exon 1 was amplified with the forward primer 5′GCTCGATTTCCGTAATTTTGAG 3′ and the reverse primer 5′ AAAGCAGGGACGGAGAAGCC 3′; exon 2 was amplified with the forward primer 5′ TACAGTTTTGAGTTTTGCAGGTG 3′ and the reverse primer 5′ TTCCCTTGCAAGAGCTCTCTC 3′; and exon 3 was amplified with the forward primer 5′ GTTGCCTTCACTGTCTGTCAC 3′ and the reverse primer 5′ GGAGTAGGAGGCCACCATAG 3′. PCR products were analyzed on agarose gel and bands containing the DNA of interest were cut out. DNA was extracted from agarose gel with the MinElute Gel Extraction Kit (Qiagen) following the manufacturer’s instructions. Concentration of the total amount of gDNA was determined by measuring the absorbance at 260 nm with a NanoDrop spectrophotometer (Thermo Fisher Scientific). Purified PCR products were send to ACGT, INC (Wheeling, IL, USA) for single pass DNA Sequencing.
Total RNA was extracted with the RNeasy Mini Kit (Qiagen, Hilden, Germany), followed by a DNAse treatment (Ambion, Austin, TX, USA). Concentration of the total amount of RNA was determined by measuring the absorbance at 260 nm with a NanoDrop spectrophotometer (Thermo Fisher Scientific). Reverse transcription (RT) assays were performed on 3 μg of total RNA with the SuperScript™ III Reverse Transcriptase (Invitrogen/Life Technologies). PCR experiments were performed with the Platinum® Taq DNA Polymerase High Fidelity (Invitrogen/Life Technologies) and analyzed by Bio-Rad C1000™ Thermal Cycler (Bio-Rad). Quantitative PCR experiments were performed with the iQ™ SYBR® Green Supermix (Bio-Rad) and analyzed by Bio-Rad CFX96™ Real-time System (Bio-Rad).
Primers for qRT-PCR: forward sequence: 5′GAGACACAGAAAAGGGTCAACCG 3′ and reverse sequence: 5′ TTCTCGATGATGACGTTGCTG 3′. Standard invariant gene used for quantification of SALL1 total mRNA was ribosomal protein L19 (RPL19; UniProtKB accession number: P84098). For each pair of primers, the efficiency of qRT-PCR was determined using a standard curve generated by a dilution series of the sample that had the highest expression rate for the selected gene. The global quantification for each gene was based on the published mathematical formula 2.
In vivo studies
We chose two cell lines for our in vivo studies. MV4-11 and THP1 AML cell lines treated with either shSALL1 or ctrl-GFP-SALL1 were injected in the tail vein of irradiated Nonobese diabetic/severe combined immunodeficiency/interleukin (IL) 2Rnull (NSG) mice. Each mouse was injected with 1.5 x10⁶ cells, 5 mice in each group. Mice were evaluated daily for morbidity, weight loss, failure to thrive, and splenomegaly. Peripheral blood (PB) was obtained from the retro-orbital venous plexus and samples were analyzed periodically for green fluorescent protein (GFP+)/CD45+ human cells engraftment and for leukemia generation by flowcytometry. Premorbid animals were sacrificed by CO2 asphyxiation, and then hematopoietic tissues were removed for subsequent analysis.
The relevant institutional review boards approved the research.
Ethics approval and consent to participate
All animal procedures were approved by the local ethical and met the guidelines for Use of Laboratory Animals
Abbreviations
AML: Acute Myeloid Lekemia. HSPCs: Hematopoietic Stem and Progenitor Cells, LCSs: Leukemia Stem Cells. NBM: Normal Bone Marrow. GM-CFUs: Granulocytic and Monocytic Colony Forming Unit capacity. RT-PCR: Reverse Transcriptase Polymerase Chain Reaction. qPCR: Quantitative Polymerase Chain Reaction. WB: Western Blot. IHC: Immunohisochemestry. ctrl: Contro/. GFP: Green Florescent Protein.
Author contributions
ATN PhD, XS PhD and BG PhD: post doctorate fellows, performed the experimental work and blotted the data. MR PhD helped with the in-vivo experiments. MR MD and LR verified Sall1 antibodies that were used for the immunohisochemestry as well as primer sequenses to detect SALL1 mRNA. They also provided scientific advice and assisted in manuscript preparation. YM MD PHD reviewed and discussed the immunohistochemestry and morphology and provided mentoring and experimenta design advice. HK PhD reviewed the work and assisted in experimental design and provided continous data review. HS MD is the Principal Investigator and corresponding author conceived the study, designed and performed experiments, analyzed and plotted the data and wrote the manuscrip.
CONFLICTS OF INTEREST
The authors declare that they have no conflicts of interest.
FUNDING
This study was supported by research funding from Georgia Regent Cancer Center and Stony Brook Cancer Center.
REFERENCES
1. Hope KJ, Jin L, Dick JE. Acute myeloid leukemia originates from a hierarchy of leukemic stem cell classes that differ in self-renewal capacity. Nat Immunol. 2004; 5:738–43.
2. Lapidot T, Sirard C, Vormoor J, Murdoch B, Hoang T, Caceres-Cortes J. Minden M, Paterson B, Caligiuri MA, Dick JE. A cell initiating human acute myeloid leukemia after transplantation into SCID mice. Nature. 1994; 367:645–648.
3. Krivtsov AV, Twomey D, Feng Z, Stubbs MC, Wang Y, Faber J, Levine JE, Wang J, Hahn WC, Gilliland DG, Golub TR, Armstrong SA. Transformation from committed progenitor to leukaemia stem cell initiated by MLL-AF9. Nature. 2006; 442:818–822.
4. Bonnet D, Dick JE. Human acute myeloid leukemia is organized as a hierarchy that originates from a primitive hematopoietic cell. Nat Med. 1997; 3:730–737.
5. Blair A, Hogge DE, Sutherland HJ. Most acute myeloid leukemia progenitor cells with long-term proliferative ability in vitro and in vivo have the phenotype CD34 (+)/CD71 (-)/HLA-DR-. Blood. 1998; 92:4325–4335.
6. Brendel C, Mohr B, Schimmelpfennig C, Muller J, Bornhauser M, Schmidt M Ritter M, Ehninger G, Neubauer A. Detection of cytogenetic aberrations both in CD90 (Thy-1)-positive and (Thy-1)-negative stem cell (CD34) subfractions of patients with acute and chronic myeloid leukemias. Leukemia. 1999; 13:1770–1775.
7. Sutherland HJ, Blair A, Zapf RW. Characterization of a hierarchy in human acute myeloid leukemia progenitor cells. Blood. 1996; 87:4754–4761.
8. Costello RT, Mallet F, Gaugler B, Sainty D, Arnoulet C, Gastaut JA, Olive D. Human Acute Myeloid Leukemia CD34+/CD38- Progenitor Cells Have Decreased Sensitivity to Chemotherapy and Fas-induced Apoptosis, Reduced Immunogenicity and Impaired Dendritic and Cell Transformation Capacities. Cancer Res. 2000; 60:4403–4411.
9. Lessard J, Sauvageau G. Bmi-1 determines the proliferative capacity of normal and leukaemic stem cells. Nature. 2003; 423:255–260.
10. Eppert K, Takenaka K, Lechman ER, Waldron L, Nilsson B, van Galen P, Metzeler KH, Poeppl A, Ling V, Beyene J, Canty AJ, Danska JS, Bohlander SK, et al. Stem cell gene expression programs influence clinical outcome in human leukemia. Nat Med. 2011; 17:1086–1093.
11. Sweetman D, Münsterberg A. The vertebrate spalt genes in development and disease. Dev Biol. 2006; 293:285–293.
12. Karantzali E, Lekakis V, Ioannou M, Hadjimichael C, Papamatheakis J, Kretsovali A. Sall1 regulates embryonic stem cell differentiation in association with nanog. J Biol Chem. 2011; 286:1037–1045.
13. Buck A, Archangelo L, Dixkens C, Kohlhase J. Molecular cloning, chromosomal localization, and expression of the murine SALL1 ortholog Sall1. Cytogenet Cell Genet. 2000; 89:150–153.
14. Based on a work at www.proteinatlas.org
15. Nishinakamura R, Matsumoto Y, Nakao K, Nakamura K, Sato A, Copeland NG, Gilbert DJ, Jenkins NA, Scully S, Lacey DL, Katsuki M, Asashima M, Yokota T. Murine homolog of SALL1 is essential for ureteric bud invasion in kidney development. Development. 2001; 128:3105–3115.
16. Kiefer SM, Ohlemiller KK, Yang J, McDill BW, Kohlhase J, Rauchman M. Expression of a truncated Sall1 transcriptional repressor is responsible for Townes-Brocks syndrome birth defects. Hum Mol Genet. 2003; 12:2221–2227.
17. Hill VK, Hesson LB, Dansranjavin T, Dallol A, Bieche I, Vacher S, Tommasi S, Dobbins T, Gentle D, Euhus D, Lewis C, Dammann R, Ward RL, et al. Identification of 5 novel genes methylated in breast and other epithelial cancers. Mol Cancer. 2010; 9:51–63.
18. Fu HY, Wu DS, Zhou HR. CpG island methylator phenotype and its relationship with prognosis in adult acute leukemia. Hematology. 2014; 19:329–337.
19. Ma Y, Singer DB, Gozman A, Ford D, Chai L, Steinhoff MM, Hansen K, Maizel AL. Hsal 1 is related to kidney and gonad development and is expressed in Wilms tumor. Pediatr Nephrol. 2001; 16:701–709.
20. Brown KW, Charles A, Dallosso A, White G, Charlet J, Standen GR, Malik K. Characterization of 17.94, a novel anaplastic Wilms' tumor cell line. Cancer Genet. 2012; 205:319–326.
21. Buttgereit A, Lelios I, Yu X, Vrohlings M, Krakoski NR, Gautier EL, Nishinakamura R, Becher B. Greter M. Sall1 is a transcriptional regulator defining microglia identity and function. Nat Immunol. 2016; 17:1397–1406.
22. Yilmaz OH, Valdez R, Theisen BK, Guo W, Ferguson DO, Wu H, Morrison SJ. Pten dependence distinguishes haematopoietic stem cells from leukemia-initiating cells. Nature. 2006; 441:475–482.
23. Zhang J, Grindley JC, Yin T, Jayasinghe S, He XC, Ross JT, Haug JS, Rupp D, Porter-Westpfahl KS, Wiedemann LM, Wu H, Li L. PTEN maintains haematopoietic stem cells and acts in lineage choice and leukaemia prevention. Nature. 2006; 441:518–522.
24. Yang J, Gao C, Chai L, Ma Y. A novel SALL4/OCT4 transcriptional feedback network for pluripotency of embryonic stem cells. PLoS One. 2010; 5:e10766.
25. Lu J, Jeong HW, Kong N, Yang Y, Carroll J, Luo HR, Silberstein LE, Yupoma, Chai L. Stem cell factor SALL4 represses the transcriptions of PTEN and SALL1 through an epigenetic repressor complex. PLoS One. 2009; 4:e5577.
26. Adati N, Huang MC, Suzuki T, Suzuki H, Kojima T. High-resolution analysis of aberrant regions in autosomal chromosomes in human leukemia THP-1 cell line. BMC Research Notes. 2009; 2:153–159.
27. Guzman ML, Neering SJ, Upchurch D, Grimes B, Howard DS, Rizzieri DA, Luger SM, Jordan CT. Nuclear factor-κB is constitutively activated in primitive human acute myelogenous leukemia cells. Blood. 2001; 98:2301–2307.
28. Siapati EK, Papadaki M, Kozaou Z, Rouka E, Michali E, Savvidou I, Gogos D, Kyriakou D, Anagnostopoulos NI, Vassilopoulos G. Proliferation and bone marrow engraftment of AML blasts is dependent on β-catenin signaling. Br J Haematol. 2011; 152:164–174.
29. Kiefer SM, Robbins L, Stumpff KM, Lin C, Ma L, Rauchman M. Sall1-dependent signals affect Wnt signaling and ureter tip fate to initiate kidney development. Development. 2010; 137:3099–3106.
30. Pardal R, Clarke M, Morrison S. Applying the principles of stem cell biology to cancer. Nature Rev Cancer. 2003; 12:895–902.
31. Ren M, Qin H, Kitamura E, Cowell JK. Dysregulated signaling pathways in the development of CNTRL-FGFR1-induced myeloid and lymphoid malignancies associated with FGFR1 in human and mouse models. Blood. 2013; 122:1007–1016.
32. Basta JM, Robbins L, Denner DR, Kolar GR, Rauchman M. A Sall1-NuRD interaction regulates multipotent nephron progenitors and is required for loop of Henle formation. Development. 2017;144:3080–3094.