
INTRODUCTION
Hepatocellular carcinoma (HCC) is responsible for significant morbidity and mortality. It is the most common primary liver cancer and represents the 2nd most common cause of cancer mortality worldwide [1]. The identification of accurate predictive factors to guide therapy was subject of numerous studies and several robust predictors of death as portal vein invasion (PVI), tumor size, serum alpha-fetoprotein (AFP) level, Child-Pugh class [2], the tumor-node-metastasis (TNM), the Okuda [3] and Barcelona-Clinic Liver Cancer (BCLC) systems [4] or the Cancer of the Liver Italian Program (CLIP) score [5] have been described. In many of these factors, imaging is essential and therefore plays an important role in the management. Multiple studies have shown a correlation between standardized uptake value (SUV) of HCC on 18F-fluorodeoxyglucose positron emission tomography (18F-FDG PET) and outcomes following different systemic and locoregional treatments [6–16], including more recently transarterial radioembolization with Yttrium-90 (90Y-TARE) [17–19].
Recently, radiomics has been introduced in the field of oncology [20]. Radiomics is a fast evolving medical field consisting in the extraction of high-throughput quantitative imaging features that may quantify in vivo and noninvasively intra and inter- tissue textural heterogeneity [21]. Indeed, radiomics allows virtual biopsies [20] that captures the inner organization processes of an entire volume with the surrounding tissue without being limited to the sampling site contrary to conventional biopsies. Additionally, virtual biopsies are noninvasive, instantaneous, can be repeated over the time and permit the monitoring of the host tumor relationships and of the treatment sequence. Radiomics does not have a consensual definition but its aim is to provide a characterization of images phenotypes [22] using extracted parameters from medical images (often more than 200+ features [21]) which can be used as biomarkers. They may include first order statistic (intensity, histogram analysis), shape (such as sphericity), textural features (sometimes intensity features or shape are confounded with textural features) or wavelets decompositions. The emerging field of radiomics have sparked large interest the past few years for different imaging modalities (computed tomography [CT], magnetic resonance imaging [MRI], PET) and many cancers such as esophagus, non-small cell lung cancer [21–23] or breast cancer [24].
For the HCC, interest of radiomics has already been reported. Using an integrated imaging-genomic approach with semiquantitative CT features relative to the poorly defined tumor margin, Kuo et al. were able to identify HCC imaging phenotypes at CT that correlate with a doxorubicin drug response gene expression program [25]. In another study Segal et al. [26] demonstrated that combinations of 28 imaging phenotypes can reconstruct 78% of the global gene expression programs of primary human liver cancer.
Despite the growing evidence for radiomics, no predictive studies in HCC using this technique exist. The aim of the current study was to generate a predictive PET radiomics scoring system for progression-free survival (PFS-pPET-RadScore) and overall survival (OS-pPET-RadScore) in patients undergoing 90Y-TARE for unresectable HCC (uHCC) using a pretreatment 18F-FDG PET whole-liver radiomics signature. When compared to the previous studies listed above, we used intensity and texture analyses of the entire liver volume, providing an advanced signature of the metabolic heterogeneity and morphology for the subtle distinction of HCC and liver cirrhosis.
RESULTS
Patients and subgroups characteristics
The characteristics of the whole-population and low-risk and high-risk groups are given in Table 1. Data of 90Y-TARE and associated treatments are given in Table 2. The mean interval between 18F-FDG PET/CT and 90Y-TARE was 18 days (range, 1–85 days). Patients did not receive any treatment between 18F-FDG PET/CT and 90Y-TARE. Using the BCLC staging system, 3 patients (6.5%) were stage A, 18 (38.5%) stage B and 26 (55%) stage C. Three patients had normal livers, all others (94%) had cirrhotic liver disease including 36 patients Child-Pugh A and 8 patients Child-Pugh B (≤ B7). Two patients have periportal lymphadenopathy. Among the 47 patients, 19 (40%) were treatment naïve and 28 (60%) had already received various procedures before 90Y-TARE including targeted therapy by Sorafenib or Everolimus with an association of 2 or more treatment modalities in 7 patients (15%). With regards to the comparison between low-risk and high-risk groups, the analysis revealed a significant higher tumor size in the high-risk group for OS-pPET-RadScore (P = 0.02). A trend for higher tumor size was seen for PFS-pPET-RadScore (P = 0.05). The hepatic control rate at 6 months of lesions treated by 90Y-TARE was better (but not statistically significant probably explained by the limited number of patients) in low-risk group compared to high-risk group for both PFS-pPET-Radscore (76 vs. 60%; P = 0.43) and OS-pPET-Radscore (79 vs. 64; P = 0.29).
Table 1: Characteristics of the whole-population and low-risk and high-risk groups based on PFS and OS-pPET-RadScores
Characteristics |
All patients |
PFS-pPET-RadScore |
OS-pPET-RadScore |
||||
|---|---|---|---|---|---|---|---|
Low-risk group |
High-risk group |
P |
Low-risk group |
High-risk group |
P |
||
Subjects |
47 |
42 |
5 |
33 |
14 |
||
Cutoff pPET-RadScore |
NA |
<0.09 |
>0.09 |
<0.11 |
>0.11 |
||
Age, years |
68 (61–73) |
68 (62–72) |
73 (51–75) |
0.64 |
69 (66–72) |
63 (55–74) |
0.31 |
Female |
6 (12.8) |
5 (11.9) |
1 (20) |
0.61 |
4 (12.1) |
2 (14.3) |
0.84 |
Comorbidities |
|||||||
Hypertension |
17 (36.2) |
16 (38.1) |
1 (20) |
0.43 |
13 (39.4) |
4 (28.6) |
0.48 |
Type 2 diabetes mellitus |
15 (31.9) |
15 (35.7) |
0 (0) |
0.11 |
13 (39.4) |
2 (14.3) |
0.09 |
Coronary artery disease |
6 (12.8) |
6 (14.3) |
0 (0) |
0.37 |
5 (15.2) |
1 (7.1) |
0.45 |
HCC characteristics |
|||||||
Tumor size, cm |
6.0 (4.3–9.0) |
5.5 (3.8–8.4) |
8.9 (8.6–9.4) |
0.05 |
4.8 (3.4–7) |
8.8 (6.2–11) |
0.02 |
<5 cm |
19 (40.4) |
19 (45.2) |
0 (0) |
0.05 |
17 (51.5) |
2 (14.3) |
0.02 |
≥5 cm |
28 (59.6) |
23 (54.8) |
5 (100) |
0.05 |
16 (48.5) |
12 (85.7) |
0.02 |
Uni-nodular |
24 (51.1) |
21 (50) |
3 (60) |
0.67 |
14 (42.4) |
10 (71.4) |
0.07 |
Multi-nodular (2–5 nodules) |
5 (10.6) |
5 (11.9) |
0 (0) |
0.41 |
5 (15.2) |
0 (0) |
0.12 |
Diffuse (> nodules) |
18 (38.3) |
16 (38.1) |
2 (40) |
0.93 |
14 (42.4) |
4 (28.6) |
0.37 |
PVI |
21 (44.7) |
20 (47.6) |
1 (20) |
0.24 |
14 (42.4) |
7 (50) |
0.63 |
Serum AFP level, kUI/l |
17 (6–192) |
15 (6–124) |
1507 (6–4430) |
0.42 |
12.7 (5-81) |
119 (6–3699) |
0.37 |
BCLC staging system |
|||||||
Stage A |
3 (6.4) |
3 (7.1) |
0 (0) |
0.54 |
3 (9.1) |
0 (0) |
0.24 |
Stage B |
18 (38.3) |
17 (40.5) |
1 (20) |
0.37 |
14 (42.4) |
4 (28.6) |
0.37 |
Stage C |
26 (55.3) |
22 (52.4) |
4 (80) |
0.24 |
16 (48.5) |
10 (71.4) |
0.15 |
Ascites |
7 (14.9) |
7 (16.7) |
0 (0) |
0.32 |
5 (15.2) |
2 (14.3) |
0.94 |
Cirrhosis |
44 (93.6) |
40 (95.2) |
4 (80) |
0.19 |
32 (97) |
12 (85.7) |
0.15 |
Child-Pugh score A |
36 (76.6) |
33 (78.6) |
3 (60) |
0.35 |
27 (81.8) |
9 (64.3) |
0.19 |
Child-Pugh score B (≤B7) |
8 (17) |
7 (16.7) |
1 (20) |
0.85 |
5 (15.2) |
3 (21.4) |
0.60 |
Chronic alcoholism |
24 (51.1) |
22 (52.4) |
2 (40) |
0.60 |
17 (51.5) |
7 (50) |
0.92 |
Viral infection type B, C |
17 (36.2) |
16 (38.1) |
1 (20) |
0.43 |
12 (36.4) |
5 (35.7) |
0.97 |
Hemochromatosis |
2 (4.3) |
2 (4.8) |
0 (0) |
0.62 |
2 (6.1) |
0 (0) |
0.35 |
NASH |
5 (10.6) |
5 (11.9) |
0 (0) |
0.41 |
5 (15.2) |
0 (0) |
0.12 |
Values are median (25th; 75th interquartile range) or n (%). AFP, alpha-fetoprotein; HCC, hepatocellular carcinoma; BCLC, barcelona-clinic liver cancer; PVI, portal vein invasion; NASH, non-alcooholic steatohepatitis; TARE, transarterial radioembolization
Table 2: 90Y-TARE and treatment associated data
Characteristics |
All patients |
PFS pPET-RadScore |
OS-pPET-RadScore |
||||
|---|---|---|---|---|---|---|---|
Low-risk group |
High-risk group |
P |
Low-risk group |
High-risk group |
P |
||
Subjects, n |
47 |
42 |
5 |
33 |
14 |
||
90Y-TARE data |
|||||||
90Y-resin |
31 (66) |
27 (64.3) |
4 (80) |
0.48 |
19 (57.6) |
12 (85.7) |
0.06 |
90Y-glass |
16 (34) |
15 (35.7) |
1 (20) |
0.48 |
14 (42.4) |
2 (14.3) |
0.06 |
90Y-administered activity, GBq |
1.6 (1.2–2.5) |
1.5 (1.1–2.1) |
2.4 (1.6–2.5) |
0.26 |
1.5 (1.1–2.0) |
1.9 (1.5–2.6) |
0.22 |
TV based on 99mTc-MAA SPECT/CT, cm3 |
170 (80–615) |
157 (80–600) |
430 (220–560) |
0.65 |
150 (60–300) |
435 (148–646) |
0.15 |
90Y-administered activity per unit of TV, MBq/cm3 |
7.3 (4.9–16.2) |
7.9 (4.9–16.3) |
6.4 (5.6–7.3) |
0.81 |
9.8 (5.2–16.7) |
6.0 (3.9–8.4) |
0.31 |
90Y-tumor liver absorbed dose, Gy |
170 (115–281) |
170 (114–286) |
205 (155–230) |
0.86 |
170 (115–290) |
159 (119–224) |
0.91 |
90Y-normal liver absorbed dose, Gy |
40 (22–63) |
40 (21–64) |
36 (30–54) |
0.33 |
43 (24–70) |
33 (23–50) |
0.05 |
Unilobar |
26 (55.4) |
24 (57.1) |
2 (40) |
0.47 |
20 (60.6) |
6 (42.9) |
0.26 |
Bilobar |
8 (17) |
6 (14.3) |
2 (40) |
0.15 |
5 (15.2) |
3 (21.4) |
0.60 |
Segmental |
8 (17) |
7 (16.7) |
1 (20) |
0.85 |
5 (15.2) |
3 (21.4) |
0.60 |
Lobar and segmental |
5 (10.6) |
5 (11.9) |
0 (0) |
0.41 |
3 (9.1) |
2 (14.3) |
0.60 |
Treatments pre-90Y-TARE |
|||||||
Targeted therapy (Sorafenib) |
4 (8.5) |
3 (7.1) |
1 (20) |
0.45 |
3 (9.1) |
1 (7.1) |
0.55 |
Embolization |
3 (6.4) |
3 (7.1) |
0 (0) |
0.54 |
3 (9.1) |
0 (0) |
0.24 |
TACE |
11 (23.4) |
10 (23.8) |
1 (20) |
0.85 |
9 (27.3) |
2 (14.3) |
0.34 |
Radiofrequency ablation |
6 (12.8) |
6 (14.3) |
0 (0) |
0.37 |
5 (15.2) |
1 (7.1) |
0.45 |
Ethanol ablation |
3 (6.4) |
3 (7.1) |
0 (0) |
0.54 |
2 (6.1) |
1 (7.1) |
0.24 |
90Y-TARE |
1 (2.1) |
1 (2.4) |
0 (0) |
0.73 |
1 (3) |
0 (0) |
0.51 |
Treatments after 90Y-TARE |
|||||||
Targeted therapy (Sorafenib) |
4 (8.5) |
3 (7.1) |
1 (20) |
0.33 |
3 (9.1) |
1 (7.1) |
0.83 |
Embolization |
1 (2.1) |
1 (2.4) |
0 (0) |
0.73 |
1 (3) |
0 (0) |
0.51 |
TACE |
10 (21.3) |
10 (23.8) |
0 (0) |
0.22 |
9 (27.3) |
1 (7.1) |
0.12 |
Radiofrequency ablation |
7 (14.9) |
7 (16.7) |
0 (0) |
0.32 |
6 (18.2) |
1 (7.1) |
0.33 |
Ethanol ablation |
1 (2.1) |
1 (2.4) |
0 (0) |
0.73 |
1 (3) |
0 (0) |
0.51 |
Hepatectomy |
1 (2.1) |
1 (2.4) |
0 (0) |
0.73 |
1 (3) |
0 (0) |
0.51 |
90Y-TARE |
1 (2.1) |
1 (2.4) |
0 (0) |
0.73 |
1 (3) |
0 (0) |
0.51 |
Values are median (25th; 75th interquartile range) or n (%).
TV, tumor volume; TARE, transarterial radioembolization; TACE, transarterial chemoembolization; SPECT/CT, single-photon emission computed tomography 99mTC-MAA, technetium-macroaggregated albumin.
Construction of PFS and OS-pPET-RadScores
As shown in Figure 1, out of a total 108 radiomics features, 69 were highly correlated and were excluded from the analysis. On the 39 remaining features, a LASSO Cox regression analysis was performed to assess variables with non-zero coefficients. The contribution of the selected parameters with their regression coefficient for the radiomics signature construction is illustrated in Figure 2 by a histogram which shows the importance of each regression coefficients used to generate PFS and OS-pPET-RadScores. PFS and OS-pPET-RadScores were calculated using regression coefficients from the LASSO regression as follow:
PFS PETRadScore = 0.1201883 * Strength
OS PETRadScore = 0.13444452 * Variance + 0.12018832 * Strength
– 0.01887273 * Low Intensity Run Short Emphasis
– 0.01046038 * Contrast
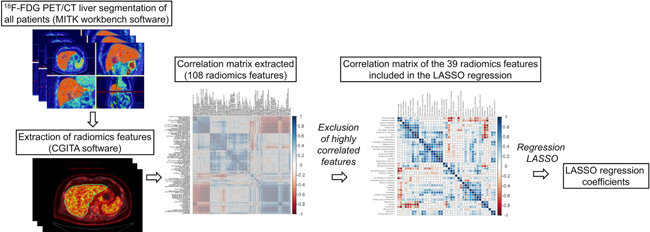
Figure 1: Steps of radiomics process.
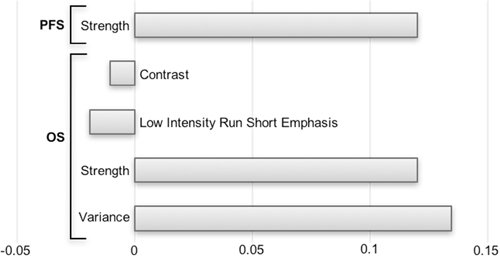
Figure 2: Histogram of the LASSO regression coefficients used to generate PFS and OS-pPET-RadScores.
Survival analysis
The median duration of follow-up was 11.1 mo (range, 2.2–53.7 mo). Hepatic relapse occurred in 30 patients (64%) at a median of 6.9 mo (range, 0.7–31.1 mo) after 90Y-TARE and 33 (70%) patients died from tumor progression. As shown in Figure 3, the generated pPET-RadScores were significantly correlated with survival for PFS (median of 11.4 mo [95% confidence interval CI: 6.3–16.5 mo] in low-risk group [PFS-pPET-RadScore < 0.09] vs. 4.0 mo [95% CI: 2.3–5.7 mo] in high-risk group [PFS-pPET-RadScore > 0.09]; P = 0.0004) and OS (median of 20.3 mo [95% CI: 5.7–35 mo] in low-risk group [OS-pPET-RadScore < 0.11] vs. 7.7 mo [95% CI: 6.0–9.5 mo] in high-risk group [OS-pPET-RadScore > 0.11]; P = 0.007). The multivariate analysis confirmed PFS-pPET-RadScore (hazard ratio [HR]: 120, 95% CI: 3.98–3625; P = 0.006) and OS-pPET-RadScore (HR: 16.1, 95% CI: 2.94–88.3; P = 0.001) as independent negative predictors. The prognostic value of generated PFS and OS-pPET-RadScores did not differ when stratified by BCLC staging system or tumor size (Table 3).
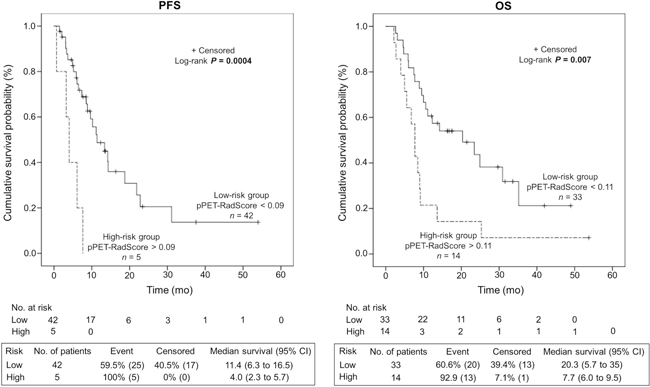
Figure 3: Kaplan-Meier estimates of progression-free survival (PFS) and overall survival (OS) according to the risk profile based on PFS and OS-pPET-RadScores.
Table 3: Multivariable regression for PFS and OS
PFS |
OS |
||||
|---|---|---|---|---|---|
Characteristics |
HR (95% CI) |
P |
Characteristics |
HR (95% CI) |
P |
PFS-pPET-RadScore |
120 (3.98–3625) |
0.006 |
OS-pPET-RadScore |
16.1 (2.94–88.3) |
0.001 |
BCLC staging system |
BCLC staging system |
||||
Stages A vs. B |
0.57 (0.07–4.65) |
0.60 |
Stages A vs. B |
1.31 (0.28–6.18) |
0.73 |
Stages A vs. C |
0.72 (0.33–1.59) |
0.42 |
Stages A vs. C |
0.66 (0.31–1.42) |
0.29 |
Serum AFP level |
0.98 (0.68–1.40) |
0.89 |
Serum AFP level |
0.75 (0.45–1.26) |
0.28 |
Size <5 vs. ≥5 cm |
0.87 (0.37–2.02) |
0.75 |
Size <5 vs. ≥5 cm |
1.0 (0.45–2.26) |
0.99 |
Stratified for BCLC staging system |
|||||
PFS pPET-RadScore |
92.2 (2.91–2916) |
0.01 |
OS-pPET-RadScore |
24.8 (3.78–162) |
0.001 |
Serum AFP level |
0.99 (0.69–1.40) |
0.93 |
Serum AFP level |
0.76 (0.45–1.28) |
0.30 |
Size < 5 vs. ≥ 5 cm |
0.86 (0.36–2.07) |
0.73 |
Size < 5 vs. ≥ 5 cm |
0.89 (0.39–2.04) |
0.79 |
Stratified for tumor size |
|||||
PFS-pPET-RadScore |
146 (3.97–5333) |
0.007 |
OS-pPET-RadScore |
16.97 (2.90–99.3) |
0.002 |
Serum AFP level |
0.96 (0.67–1.38) |
0.83 |
Serum AFP level |
0.75 (0.45–1.26) |
0.28 |
BCLC staging system |
BCLC staging system |
||||
Stages A vs. B |
0.64 (0.08–5.44) |
0.68 |
Stages A vs. B |
1.0 (0.21–4.72) |
1.00 |
Stages A vs. C |
0.76 (0.34–1.70) |
0.50 |
Stages A vs. C |
0.57 (0.26–1.22) |
0.15 |
AFP, alpha-fetoprotein; HR, hazard ratio; CI; confidence interval; PFS, progression-free survival; OS, overall survival; BCLC, barcelona-clinic liver cancer.
DISCUSSION
The aim of the current study was to generate a predictive radiomics scoring system based on the whole-liver (tumor and non-tumoral liver) segmentation of 18F-FDG PET in patients undergoing 90Y-TARE for uHCC. This study which describes whole-liver (tumor and non-tumoral) radiomics, might be an interesting concept to integrate liver function and tumor biology. This integrative model may be able to separate patients in low-risk and high-risk groups and to predict survival. This is of interest since 90Y-TARE is costly and sometimes associated with side effects in this vulnerable patient population. By introducing the whole-liver and not isolated tumors in the radiomics model, we aim to integrate liver function and tumor biology, thus representing the liver biology in one system. This approach in our view might represent the fragile balance between HCC and liver cirrhosis.
Two predictive radiomics scores were generated to predict survival. These radiomics scores successfully classified patients between low-risk and high-risk in either PFS and OS and remains statistically significant in the multivariate analysis independently of the BCLC staging system which includes variables related to tumor stage, liver functional status, performance status, and cancer-related symptoms [4]. Our score furthermore remained an independent factor against the tumor size and the AFP level in our patient population.
Comparison between low-risk and high-risk revealed that a higher tumor size was seen in the high-risk group for the PFS-pPET-RadScore and OS-pPET-RadScore. Indeed, the tumor size is a well-known factor associated with outcome. Interestingly, our approach replaces the tumor size and functional parameters of the BCLC classification as performance status, PVI and Child-Pugh score with a whole-liver radiomics approach taking into account the lesion size as well as the metabolic activity of the non-tumoral but cirrhotic liver. The generated radiomics score of this study remained significant in the multivariate analysis, mandating an independent value of our mathematical model. Furthermore, a whole-liver radiomics model is more less prone to failure due to lesion interpretation by the radiologist/nuclear physician and can capture much more complex patterns than reported by the BCLC scoring system. The mandated segmentation can be performed easily on the CT scan and then translated on the 18F-FDG PET images. Furthermore, in the future, this process of segmentation will be even more fast, reproducible and user-friendly with fully automated liver segmentation integrated into clinical routine [27]. Finally, the segmentation of the whole-liver metabolism could have an additional potential clinical significance if a predictive model of toxicity were identified in future studies.
The main textural features in our predictive radiomics scoring system were Strength and Variance. The presence of the Strength in both PFS and OS models confirmed the relevant predictive value of this parameter. Strength is a textural feature based on the neighborhood gray-tone difference matrix that is first described in 1989 by Amadasun et al. [28] and means if a pattern is perceivable within the texture and if it can be recognized. Variance is a textural feature derived from texture feature coding method and describes a deviation from the mean of textural feature numbers (a transformation of the image voxels that represent a certain type of local texture). Variance is one of the textural feature that was initially used by Horng et al. to classify ultrasonic liver images into 3 liver states (normal liver, hepatitis and cirrhosis) with a correct classification rate of 86.7% and a false-negative rate of 4.4% [29]. We believe that this publication strengthens our integrative whole-liver approach using radiomics and emphasizes once more the importance to include not only tumor lesions to predict outcome but also have to a tool to assess the non-tumoral liver. Our current analysis also has shortcomings, whereas the most important is the lack of an external cohort to verify our findings. This criticism is certainly justified, however we see the current work rather as a generation of hypothesis that the reading of imaging especially in the fragile context of liver function versus tumor control could be performed on a much more complex level than for example the BCLC staging. A further shortcoming is that some patients received prior treatment as Sorafenib™ (Bayer, Leverkusen, Germany) which might influence the outcome of PFS. The preceding treatments are summarized in Table 2 and reflect a standard population receiving radioembolization where this treatment is used rather in later therapy lines. However, prospective studies showed the feasibility and tolerability of anti-angiogenic treatment as Sorafenib followed by radioembolization [30]. This presented analysis is to our knowledge the first whole-liver radiomics approach, representing the fragile balance between liver function and tumor burden, which is the clinical reality in these patients. However, our results have to be verified in future prospective studies.
MATERIALS AND METHODS
Patient characteristics
All pretreatment 18F-FDG PET images of patients undergoing 90Y-TARE for uHCC between December 2010 and December 2015 were retrospectively analyzed. The American Association for the Study of Liver Diseases (AASLD) guidelines [31] were used to diagnose HCC and the BCLC staging system have been used to stage HCC [4]. Patients included in the study had unresectable HCC because of a locally advanced tumor, multifocal disease or PVI. Also, inclusion criteria consisted of patients with a liver-dominant or liver-only disease, an adequate hematologic, renal and hepatic function, a good (ECOG PS) <2 and a life expectancy >3 months and a Child-Pugh score ≤ B7. Exclusion criteria were an inadequate liver reserve (bilirubin >34 μmol/L, ascites), a Child-Pugh score > B7, a poor ECOG PS ≥ 2, distant metastases, a higher lung shunt fraction > 20%, an estimated lung absorbed dose of >30 Gray per session and 50 Gray in total and an uncorrectable extrahepatic flow on the pretreatment 99mtechnetium-macroaggregated albumin single-photon emission computed tomography (99mTc-MAA SPECT/CT). All patients underwent imaging procedures and 90Y-TARE as standard care. The local Ethics Research Committee of the State of Vaud took into account the retrospective analysis of our database, approved the protocol (Number 2016–00640) and waived the need for patient informed consent for the study analysis.
18F-FDG PET
All patients underwent 18F-FDG PET/CT on a Discovery D690 TOF (GE HealthCare, Waukesha, WI) 50–70 minutes after a planned intravenous injection of 3.6 ± 0.4 MBq/kg of 18F-FDG. All patients fasted for at least 6 hours and blood glucose levels were less than 140 mg/dL before administration of 18F-FDG. A low-dose helical CT (120kV, 80–200mA) was first performed for anatomical correlation and attenuation correction. Then, whole-body emission images were acquired using 7 to 9 overlapping bed positions of 2 min each (starting from the top of skull and ending at the mid-thigh). Images were reconstructed using iterative protocols with body weight-normalized SUV computation.
Radiomics features segmentation and extraction
All CT livers were semi-automatically segmented using The Medical Imaging Interaction Toolkit (MITK) workbench software [32] to generate a three-dimensional mask that was further incorporated and translated to the 18F-FDG PET images. Three-dimensional texture analysis was applied to the pretreatment 18F-FDG PET study using an open-source software Chang Gung Image Texture Analysis toolbox (CGITA) [33] implemented in Matlab 2015b (Mathworks Inc., Natick, MA). A total of 108 radiomics features from the three-dimensional segmented livers of 18F-FDG PET images were extracted according from following categories: SUV statistics, co-occurrence matrix, voxel alignment matrix, neighborhood intensity difference matrix, intensity size zone matrix, normalized co-occurrence matrix, voxel statistics, texture spectrum, texture feature coding co-occurrence matrix and neighborhood gray level dependence. Steps of the radiomics process are illustrated in Figure 1.
90Y-TARE procedure
The 90Y-TARE planning and procedure was made as previously described [34]. Briefly, before 90Y-TARE, all patients underwent a pretherapy SPECT/CT with intra-arterial administration of 120–180 MBq of 99mTc-MAA. The required 90Y administered activity was calculated from partition model dosimetry as reported by Gnesin et al. [35]. 90Y-resin (SIR-Spheres™; SIRTex Medical, Sydney, Australia) or 90Y-glass (TheraSphere™; BTG Biocompatibles Ltd, Farnham, UK) microspheres were injected by a nuclear physician into a percutaneous catheter inserted into the femoral artery and directed to the selected hepatic artery. Patients with small-tumor volumes were preferentially addressed to 90Y-glass microspheres due to their higher specific 90Y activity and lower particle number aiming at avoiding lesion saturation and consecutive reflux to non-target volumes. A post-90Y-TARE SPECT/CT was performed to confirm the distribution of 90Y microspheres.
Study endpoints
Study endpoints were PFS and OS. PFS was defined as time from the date of the 90Y-TARE until the date of the first occurrence of hepatic tumor progression based on imaging data with contrast-enhanced CT or MRI using Response Evaluation Criteria in Solid Tumors, distant recurrence, death or last known consultation (censored). OS was defined as time from the date of the 90Y-TARE until death from any cause or last known consultation (censored).
Statistical analysis
The statistical analysis was performed with R software (The R Project for Statistical Computing, www.r-project.org, version 3.3.2) [32]. The packages in R used in the present study were “glmnet“ [36], “Survival“ [37], “ggplot2“ [38], “caret“ [39], “matcor“ [40]. All continuous variables were checked for normality and described with conventional statistics. All continuous numeric data were centered and scaled from the mean and standard deviation. According to the Harrell guideline as the number of events should exceed the number of included covariates by at least 10 times in a multivariate analysis [41], an initial reduction of variables was necessary. To address this issue, highly correlated variables were removed (which were defined as a Spearman’s correlation > 0.9). On the remaining variables, the least absolute shrinkage and selection operator (LASSO) Cox regression model [42, 43] which is suitable for the regression of high-dimensional data, was used to select the most useful prognostic features in the data set. The selected imaging features were then combined into a radiomics signature. For each patient, PFS and OS predictive scores based on 18F-FDG PET radiomics signature (pPET-RadScore) were computed through a linear combination of selected features weighted by their respective coefficients. Using X-tile software version 3.6.1 (Yale University School of Medicine, New Haven, Conn) [44], the optimal pPET-RadScore value to predict PFS and OS served as cutoff to separate high- and low-risk patients. Survival curves of the high-risk and low-risk groups were estimated using the Kaplan-Meier method and differences between subgroups were compared with the log-rank test. Using SPSS software (version 23, SPSS Inc., Chicago, IL, USA), the differences in demographic, clinical, pathological and treatment data between these two groups were compared by using χ2 test with Pearson’s correction for discrete variables and t test or Mann-Whitney test for continuous variables. The influence of PFS and OS-pPET-RadScores, BCLC staging system and serum AFP level was investigated using a Cox proportional hazards model. Stratified analyses were performed to explore the potential association of the radiomics signature with the PFS and OS using subgroups within clinical-pathologic risk factors from the whole data set. For all statistical analyses, P values < 0.05 were considered statistically significant.
Abbreviations
AASLD: American Association for the Study of Liver Diseases; AFP: Alpha-fetoprotein; BCLC: Barcelona-Clinic Liver Cancer; CGITA: Chang Gung Image Texture Analysis; CLIP: Cancer of the Liver Italian Program; CT: Computed tomography; FDG: Fluorodeoxyglucose; LASSO: Least absolute shrinkage and selection operator; MAA: Macroaggregated albumin; MITK: Medical Imaging Interaction Toolkit; MRI: Magnetic resonance imaging; OS: Overall survival; PET: Positron emission tomography; PFS: Progression-free survival overall survival; PVI: Portal vein invasion; Rad: Radiomics; SPECT: Single-photon emission computed tomography; SUV: Standardized uptake value; T/L: Tumor-to-liver; TARE: Transarterial radioembolization; TNM: Tumor-node-metastasis; uHCC: Unresectabble hepatocellular carcinoma.
Author contributions
PBD: acquisition of data, analysis and interpretation of data, drafting of the manuscript; AVDG: interpretation of data, drafting of the manuscript; NS: study concept and design, interpretation of data, drafting of the manuscript, critical revision of the manuscript for important intellectual content; MJ, MNL, AD, JP: interpretation of data, critical revision of the manuscript for important intellectual content.
CONFLICTS OF INTEREST
The authors have no potential conflicts of interest to report.
FUNDING
This work was partly supported by the Swiss National Science Foundation with grant agreement PZ00P2_154891 (AD).
REFERENCES
1. Torre LA, Bray F, Siegel RL, Ferlay J, Lortet-Tieulent J, Jemal A. Global cancer statistics, 2012. CA Cancer J Clin. 2015; 65:87–108.
2. Tandon P, Garcia-Tsao G. Prognostic indicators in hepatocellular carcinoma: a systematic review of 72 studies. Liver Int. 2009; 29:502–510.
3. Okuda K, Obata H, Nakajima Y, Ohtsuki T, Okazaki N, Ohnishi K. Prognosis of primary hepatocellular carcinoma. Hepatol Baltim Md. 1984; 4:3S–6S.
4. Llovet JM, Brú C, Bruix J. Prognosis of hepatocellular carcinoma: the BCLC staging classification. Semin Liver Dis. 1999; 19:329–338.
5. Daniele B, Annunziata M, Barletta E, Tinessa V, Di Maio M. Cancer of the Liver Italian Program (CLIP) score for staging hepatocellular carcinoma. Hepatol Res. 2007; 37:S206–209.
6. Lee JW, Yun M, Cho A, Han KH, Kim DY, Lee SM, Lee JD. The predictive value of metabolic tumor volume on FDG PET/CT for transarterial chemoembolization and transarterial chemotherapy infusion in hepatocellular carcinoma patients without extrahepatic metastasis. Ann Nucl Med. 2015; 29:400–408.
7. Parikh U, Marcus C, Sarangi R, Taghipour M, Subramaniam RM. FDG PET/CT in Pancreatic and Hepatobiliary Carcinomas: Value to Patient Management and Patient Outcomes. PET Clin. 2015; 10:327–343.
8. Song HJ, Cheng JY, Hu SL, Zhang GY, Fu Y, Zhang YJ. Value of 18F-FDG PET/CT in detecting viable tumour and predicting prognosis of hepatocellular carcinoma after TACE. Clin Radiol. 2015; 70:128–137.
9. Asman Y, Evenson AR, Even-Sapir E, Shibolet O. [18F]fludeoxyglucose positron emission tomography and computed tomography as a prognostic tool before liver transplantation, resection, and loco-ablative therapies for hepatocellular carcinoma. Liver Transplant. 2015; 21:572–580.
10. Cho E, Jun CH, Kim BS, Son DJ, Choi WS, Choi SK. 18F-FDG PET CT as a prognostic factor in hepatocellular carcinoma. Turk J Gastroenterol. 2015; 26:344–350.
11. Pant V, Sen IB, Soin AS. Role of 18F-FDG PET CT as an independent prognostic indicator in patients with hepatocellular carcinoma. Nucl Med Commun. 2013; 34:749–757.
12. Kim MJ, Kim YS, Cho YH, Jang HY, Song JY, Lee SH, Jeong SW, Kim SG, Jang JY, Kim HS, Kim BS, Lee WH, Park JM, et al. Use of 18F-FDG PET to predict tumor progression and survival in patients with intermediate hepatocellular carcinoma treated by transarterial chemoembolization. Korean J Intern Med. 2015; 30:308–315.
13. Lee JH, Park JY, Kim DY, Ahn SH, Han KH, Seo HJ, Lee JD, Choi HJ. Prognostic value of 18F-FDG PET for hepatocellular carcinoma patients treated with sorafenib. Liver Int. 2011; 31:1144–1149.
14. Kornberg A, Küpper B, Tannapfel A, Büchler P, Krause B, Witt U, Gottschild D, Friess H. Patients with non-[18 F]fludeoxyglucose-avid advanced hepatocellular carcinoma on clinical staging may achieve long-term recurrence-free survival after liver transplantation. Liver Transplant. 2012; 18:53–61.
15. Lee JW, Paeng JC, Kang KW, Kwon HW, Suh KS, Chung JK, Lee MC, Lee DS. Prediction of tumor recurrence by 18F-FDG PET in liver transplantation for hepatocellular carcinoma. J Nucl Med. 2009; 50:682–687.
16. Kim YI, Paeng JC, Cheon GJ, Suh KS, Lee DS, Chung JK, Kang KW. Prediction of Posttransplantation Recurrence of Hepatocellular Carcinoma Using Metabolic and Volumetric Indices of 18F-FDG PET/CT. J Nucl Med. 2016; 57:1045–1051.
17. Abuodeh Y, Naghavi AO, Ahmed KA, Venkat PS, Kim Y, Kis B, Choi J, Biebel B, Sweeney J, Anaya DA, Kim R, Malafa M, Frakes JM, et al. Prognostic value of pre-treatment F-18-FDG PET-CT in patients with hepatocellular carcinoma undergoing radioembolization. World J Gastroenterol. 2016; 22:10406–10414.
18. Jreige M, Mitsakis P, Van Der Gucht A, Pomoni A, Silva-Monteiro M, Gnesin S, Boubaker A, Nicod-Lalonde M, Duran R, Prior JO, Denys A, Schaefer N. (18)F-FDG PET/CT predicts survival after (90)Y transarterial radioembolization in unresectable hepatocellular carcinoma. Eur J Nucl Med Mol Imaging. 2017; 44:1215–1222.
19. Van Der Gucht A, Jreige M, Denys A, Blanc-Durand P, Boubaker A, Pomoni A, Mitsakis P, Silva-Monteiro M, Gnesin S, Nicod-Lalonde M, Duran R, Prior JO, Schaefer N. Resin versus Glass Microspheres for Yttrium-90 Transarterial Radioembolization: Comparing Survival in Unresectable Hepatocellular Carcinoma using Pretreatment Partition Model Dosimetry. J Nucl Med Off Publ Soc Nucl Med. 2017; 44:1215–1222.
20. Aerts HJ, Velazquez ER, Leijenaar RTH, Parmar C, Grossmann P, Carvalho S, Bussink J, Monshouwer R, Haibe-Kains B, Rietveld D, Hoebers F, Rietbergen MM, Leemans R, et al. Decoding tumour phenotype by noninvasive imaging using a quantitative radiomics approach. Nat Commun. 2014; 5:4006.
21. Lambin P, Rios-Velazquez E, Leijenaar R, Carvalho S, van Stiphout RG, Granton P, Zegers CM, Gillies R, Boellard R, Dekker A, Aerts HJ. Radiomics: extracting more information from medical images using advanced feature analysis. Eur J Cancer. 2012; 48:441–446.
22. Aerts HJ. The Potential of Radiomic-Based Phenotyping in Precision Medicine: A Review. JAMA Oncol. 2016; 2:1636–1642.
23. Huang Y, Liu Z, He L, Chen X, Pan D, Ma Z, Liang C, Tiang J, Liang C. Radiomics Signature: A Potential Biomarker for the Prediction of Disease-Free Survival in Early-Stage (I or II) Non-Small Cell Lung Cancer. Radiology. 2016; 281:947–957.
24. Soussan M, Orlhac F, Boubaya M, Zelek L, Ziol M, Eder V, Buvat I. Relationship between tumor heterogeneity measured on FDG-PET/CT and pathological prognostic factors in invasive breast cancer. PloS One. 2014; 9:e94017.
25. Kuo MD, Gollub J, Sirlin CB, Ooi C, Chen X. Radiogenomic Analysis to Identify Imaging Phenotypes Associated with Drug Response Gene Expression Programs in Hepatocellular Carcinoma. J Vasc Interv Radiol. 2007; 18:821–830.
26. Segal E, Sirlin CB, Ooi C, Adler AS, Gollub J, Chen X, Chan BK, Matcuk GR, Barry CT, Chang HY, Kuo MD. Decoding global gene expression programs in liver cancer by noninvasive imaging. Nat Biotechnol. 2007; 25:675–680.
27. Wang X, Li C, Eberl S, Fulham M, Feng D. Automated liver segmentation for whole-body low-contrast CT images from PET-CT scanners. Conf Proc Annu Int Conf IEEE Eng Med Biol Soc. 2009; 2009:3565–8.
28. Amadasun M, King R. Textural features corresponding to textural properties. IEEE Trans Syst Man Cybern. 1989; 19:1264–1274.
29. Horng MH, Sun YN, Lin XZ. Texture feature coding method for classification of liver sonography. Comput Med Imaging Graph. 2002; 26:33–42.
30. Salman A, Simoneau E, Hassanain M, Chaudhury P, Boucher LM, Valenti D, Cabrera T, Nudo C, Metrakos P. Combined sorafenib and yttrium-90 radioembolization for the treatment of advanced hepatocellular carcinoma. Curr Oncol. 23:e472–e480.
31. Murray KF, Carithers RL, AASLD. AASLD practice guidelines: Evaluation of the patient for liver transplantation. Hepatol Baltim Md. 2005; 41:1407–1432.
32. The Medical Imaging Interaction Toolkit (MITK). Available from: http://mitk.org/wiki/MITK.
33. Fang YH, Lin CY, Shih MJ, Wang HM, Ho TY, Liao CT, Yen TC. Development and evaluation of an open-source software package “CGITA” for quantifying tumor heterogeneity with molecular images. BioMed Res Int. 2014; 2014:248505.
34. Van Der Gucht A, Jreige M, Denys A, Blanc-Durand P, Boubaker A, Pomoni A, Mitsakis P, Silva-Monteiro M, Gnesin S, Nicod-Lalonde M, Duran R, Prior JO, Schaefer N. Resin versus Glass Microspheres for Yttrium-90 Transarterial Radioembolization: Comparing Survival in Unresectable Hepatocellular Carcinoma using Pretreatment Partition Model Dosimetry. J Nucl Med. 2017; 58:1334–1340.
35. Gnesin S, Canetti L, Adib S, Cherbuin N, Silva-Monteiro M, Bize P, Denys A, Prior JO, Baechler S, Boubaker A. Partition model based 99mTc-MAA SPECT/CT predictive dosimetry compared to 90Y TOF PET/CT post-treatment dosimetry in radioembolisation of hepatocellular carcinoma: a quantitative agreement comparison. J Nucl Me. 2016; 57:1672–1678.
36. Friedman J, Hastie T, Tibshirani R. Regularization Paths for Generalized Linear Models via Coordinate Descent. J Stat Softw. 2010; 33:1–22.
37. Therneau T. A Package for Survival Analysis in S. version 2.38. https://CRAN.R-project.org/package=survival/.
38. Wickham H. ggplot2 - Elegant Graphics for Data Analysis. Springer-Verlag New York. 2009.
39. Kuhn M. Building Predictive Models in R Using the caret. http://www.jstatsoft.org/article/view/v028i05/v28i05.pdf. Accessed December 15, 2008.
40. Gonzalez I, Dejean S, Martin P, Baccini A. CCA: An R Package to Extend Canonical Correlation Analysis. J Stat Softw. 2008; 23:1–14.
41. Harrell F. Regression modeling strategies with applications to linear models, logistic and ordinal regression, and survival analysis. Springer-Verlag. New York, 2015.
42. Tibshirani R. The lasso method for variable selection in the Cox model. Stat Med. 1997; 16:385–395.
43. Gui J, Li H. Penalized Cox regression analysis in the high-dimensional and low-sample size settings, with applications to microarray gene expression data. Bioinforma Oxf Engl. 2005; 21:3001–3008.
44. Camp RL, Dolled-Filhart M, Rimm DL. X-tile: a new bio-informatics tool for biomarker assessment and outcome-based cut-point optimization. Clin Cancer Res. 2004; 10:7252–7259.