
INTRODUCTION
Colorectal cancer is the third most common cancer and the fourth leading cause of cancer mortality worldwide. Rectal cancer accounts for approximately one third of all colorectal cancer cases [1, 2]. In recent years, neoadjuvant chemoradiotherapy (nCRT), followed by surgical treatment, has been widely used for treating patients with locally advanced rectal cancer (LARC). Prospective regression of tumor lesions caused by nCRT is beneficial for local control, surgical resection and survival rates [3–5]. Furthermore, nCRT leads to an effective tumor regression in 15% to 34% patients with pathologically complete response (pCR) based on present literature [6–10], which in turn is associated with improved local control, reduced incidence of distant metastases and a survival prognosis [6, 11, 12]. Limited resection or non-operative ‘wait and see’ policy was introduced as an alternative modality to conventionally total mesorectal excision (TME) for patients with clinical complete response (cCR) after nCRT [13, 14]. In a meta-analysis study, Li et al have compared the oncological outcomes in 251 patients with rectal cancer achieving cCR after nCRT with nonsurgical management and in 344 patients with cCR treated with radical surgery. Briefly, no differences were found in distant metastasis rates, disease-free and overall survival between the two groups [14]. Accordingly, new predictors of pCR after nCRT need to be investigated in order to avoid over treatment and to improve the quality of life.
Currently, magnetic resonance imaging (MRI) is considered the best non-invasive imaging approach for predicting pCR in patients with rectal cancer treated with nCRT [15–18]. Quantitative measurements of signal intensity obtained using T2-weighted or diffusion weighted MR images (DWI) before and after nCRT, showed to be useful for evaluation of pCR [8, 16–18]. Nevertheless, the primary disadvantage of this technique is the poor repeatability and the relatively controversial results [9, 19]. Significant correlations between reduction rate of tumor volume and pCR have been reported by some studies [19–22]. However, its calculation requires a lot of effort and is time-consuming. Therefore, the alternative and less tedious methods are more than necessary in busy clinical practice.
In this study, we evaluated the value of morphological parameters that can be obtained more conveniently by MRI for predicting pCR in patients with rectal cancers.
RESULTS
Surgical treatment and pathological findings
The basic clinical information of patients are displayed in Table 1. Among 101 patients included in the study, the performed surgical treatments included laparoscopic abdominoperineal resection (n=53), low anterior resection (n=42), Hartmann’s procedure (n=2), extralevator abdominoperineal excision (n=1), and extended radical resection (n=3). pCR were observed in 18 out of 101 (17.8%) patients with locally advanced rectal tumor after nCRT, while other 83 patients (82.2%) received non-pCR.
Table 1: Distribution of the clinical characteristics in the pCR or non-pCR groups
variables/Groups |
pCR |
Non-pCR |
p |
|---|---|---|---|
Gender (n) |
0.92a |
||
Male |
13 |
59 |
|
Female |
5 |
24 |
|
Age, mean (SD) |
54.3(12.9) |
58.0(12.2) |
0.25b |
CEA, median (IQR) |
2.5(3.0) |
3.8(7.2) |
0.14 c |
Note- CEA: carcinoembryonic antigen; SD: standard deviation; IQR: interquartile range.
a : Chi-square test; b: t-test; c: Kruskal-Wallis test.
MRI and clinical parameters
Table 2 summarizes the distribution of the parameters between the pCR and non-pCR groups for the two readers.
Table 2: Distribution of the MR morphologic parameters in the pCR or non-pCR groups for the two readers
Variables\Groups |
Reader 1 |
Reader 2 |
Kappa/ICC |
||||
|---|---|---|---|---|---|---|---|
pCR |
Non-pCR |
p |
pCR |
Non-pCR |
p |
||
MTA, median (IQR) |
|||||||
MTApre (mm2) |
332.0(193.0) |
399.0(276.0) |
0.14d |
394.0(181.0) |
418.0(293.0) |
0.72 d |
0.950Δ |
MTApost (mm2) |
100.5(94.5) |
198.0(153.0) |
<0.001 d |
106.0(104.0) |
213.0(178.0) |
<0.001 d |
0.950Δ |
MTARR (%) |
75.4(28.8) |
53.4(31.1) |
0.02 d |
76.8(14.2) |
50.7(21.3) |
<0.001 d |
0.919Δ |
MTL |
|||||||
MTLpre (mm), median (IQR) |
36.0(9.0) |
40.0(17.0) |
0.12 d |
35.5(10.0) |
40.0(17.0) |
0.28 d |
0.977Δ |
MTLpost (mm), mean (SD) |
18.1(7.7) |
24.8(8.29) |
0.002 c |
17.5(8.0) |
24.0(11.0) |
0.02 c |
0.973Δ |
MTLRR (%), mean (SD) |
50.4(19.0) |
36.2(17.0) |
0.002 c |
51.7(19.7) |
38.0(15.7) |
0.002 c |
0.949Δ |
MTT |
|||||||
MTTpre (mm), median (IQR) |
13.5(4.0) |
14.0(5.0) |
0.94d |
13.5(5.0) |
14.0(4.0) |
1.00 d |
0.953Δ |
MTTpost (mm), median (IQR) |
7.0(5.0) |
8.0(4.0) |
0.23d |
6.5(6.0) |
9.0(4.0) |
0.15d |
0.960Δ |
MTTRR (%), mean (SD) |
48.0(23.0) |
36.0(19.0) |
0.02c |
51.1(22.7) |
36.4(17.2) |
0.003 c |
0.930Δ |
CATV, median (IQR) |
|||||||
CATVpre (cm3) |
12.5(9.3) |
15.6(14.7) |
0.14d |
13.9(9.8) |
16.4(19.3) |
0.33 d |
0.984 |
CATVpost (cm3) |
1.7(2.5) |
5.1(5.2) |
0.002 d |
1.6(2.4) |
5.3(5.8) |
0.003 d |
0.977 |
CATVRR (%), |
86.3(24.0) |
72.8(29.0) |
0.01 d |
89.0(15.0) |
73.0(26.0) |
<0.001 d |
0.954 |
DTA, (mm), median (IQR) |
39.5(26.0) |
66.0(39.0) |
0.01 d |
36.0(23.0) |
65.0(40.0) |
0.006 d |
0.987Δ |
TP (n) |
0.83b |
0.83 b |
0.973* |
||||
1 |
8 |
28 |
1 |
30 |
|||
2 |
1 |
13 |
4 |
12 |
|||
3 |
4 |
22 |
5 |
22 |
|||
4 |
5 |
20 |
8 |
19 |
|||
CPpre (n) |
0.70 b |
0.59 b |
0.814* |
||||
1 |
1 |
3 |
0 |
4 |
|||
2 |
7 |
26 |
7 |
23 |
|||
3 |
5 |
26 |
6 |
26 |
|||
4 |
5 |
28 |
5 |
30 |
|||
CPpost (n) |
0.05 b |
0.04b |
0.873* |
||||
1 |
9 |
24 |
10 |
21 |
|||
2 |
8 |
27 |
7 |
31 |
|||
3 |
1 |
20 |
1 |
20 |
|||
4 |
0 |
12 |
0 |
11 |
|||
Note – MTA: maximum tumor area; MTARR: maximum area reduction rate; MTL: maximum tumor length;
MTLRR: maximum tumor length reduction rate; MTT: maximum tumor thickness;
MTTRR: maximum tumor thickness reduction rate; CATV: cylindrical approximated tumor volume;
CATVRR: cylindrical approximated tumor volume reduction rate; DTA: distance from tumor to anal verge;
TP: tumor position; CP: circumferential percentage; SD: standard deviation; IQR: interquartile range.
a : Chi-square test; b: Fisher exact test; c: t-test; d: Kruskal-Wallis test; Δ : inter-observer correlation coefficient (ICC);
*: Kappa statistics.
The median values of MTApre were 332.0±193.0 mm2 and 399.0±276.0 mm2 in the pCR and non-pCR groups for reader 1, and 394.0±181.0 mm2 and 418.0±293.0 mm2 for reader 2, respectively. There was no significant difference in the parameter of MTApre between the two groups for both readers (p=0.14, 0.72, respectively). Additionally, after nCRT, the parameters of MTApost and MTARR revealed significant differences between the pCR and non-pCR groups for both readers (p<0.05). The inter-observer agreement was excellent with ICC values of 0.950 and 0.919, respectively.
The values of maximum tumor length and maximum tumor thickness were decreased obviously after nCRT compared to those before treatment. There were significant differences in MTLpost and MTLRR between pCR and non-pCR groups for the two readers (p<0.05). Moreover, significant differences were observed for the predictor of MTTRR between the two groups for both readers (p=0.02, 0.003). Nevertheless, there were no significant differences in terms of MTLpre, MTTpreand MTTpost for the two readers (p>0.05).
Similar to the parameters of MTA and MTL, significant differences for the predictors of CATVpost and CATVRR between the two groups (p=0.002, 0.01 for reader 1, and 0.003, <0.001 for reader 2) were found, while no significant difference was observed for the variable of CATVpre for the two readers (p=0.14, 0.33, respectively).
There were significant differences for pre-treatment DTA between the two groups for the two readers (p=0.01, 0.006, respectively) with the excellent inter-observer agreements (ICC=0.987). The parameter of CPpost differs between pCR and non-pCR for reader 2 (p=0.04).
No significant differences were observed for the parameters of TP, gender, age, and pre-treatment serum CEA level between the two groups for the independent readers.
Diagnostic performances of the significant predictors
The ROC curves of those significant predictors for differentiating pCR from non-pCR are shown in Figure 1, while corresponding sensitivity and specificity data are shown in Table 3. The AUCs of 0.672-0.853 were obtained for the predictors with the highest value for MTARR for reader 2 and the lowest value for MTTRR for reader 1. When the cut-off values were chosen based on the Youden index, the relative sensitivity of 61.1%-88.9% and specificity of 59.0%-75.9% were achieved, while the cut-off values were selected according to the specificity above 90.0%, the corresponding sensitivity was relatively low with the values of under 50.0%.
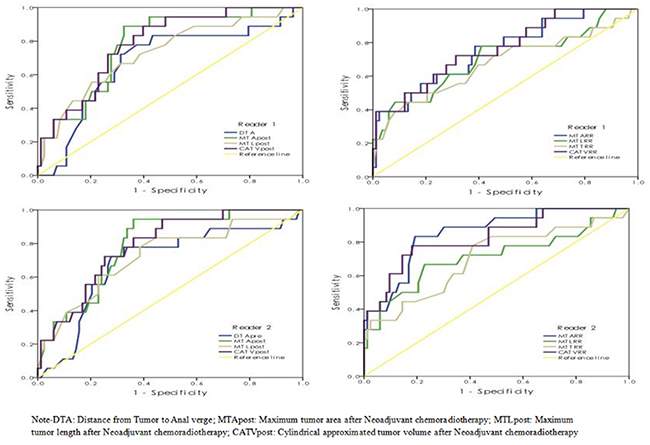
Figure 1: The ROC curves of selected significant parameters in predicting pCR vs. Non-pCR.
Table 3: Sensitivity and specificity of the significant parameters for predicting a pCR
AUC |
Cutoff 1 |
Sensitivity (%) |
Specificity (%) |
Cutoff 2 |
Sensitivity (%) |
Specificity (%) |
|
|---|---|---|---|---|---|---|---|
Reader 1 |
|||||||
MTApost (mm2) |
0.777 |
122.5 |
72.2 |
72.3 |
54.5 |
33.3 |
94.0 |
MTLpost (mm) |
0.728 |
22.5 |
72.2 |
61.4 |
14.5 |
33.3 |
91.6 |
CATVpost (cm3) |
0.783 |
2.5 |
72.2 |
73.5 |
0.9 |
33.3 |
94.0 |
DTApre (mm) |
0.676 |
50.5 |
72.2 |
68.7 |
29.5 |
16.7 |
90.2 |
MTARR (%) |
0.752 |
67.9 |
61.1 |
75.9 |
85.0 |
38.9 |
97.6 |
MTLRR(%) |
0.701 |
47.5 |
61.1 |
71.1 |
58.5 |
44.4 |
91.6 |
MTTRR (%) |
0.672 |
42.5 |
61.1 |
62.7 |
61.0 |
38.9 |
90.4 |
CATVRR (%) |
0.764 |
79.3 |
72.2 |
68.7 |
93.3 |
38.9 |
98.8 |
Reader 2 |
|||||||
MTApost (mm2) |
0.789 |
134.5 |
72.2 |
69.9 |
52.5 |
33.3 |
94.0 |
MTLpost (mm) |
0.723 |
21.5 |
77.8 |
61.4 |
14.5 |
38.9 |
90.2 |
CATVpost (cm3) |
0.787 |
2.6 |
72.2 |
74.7 |
1.0 |
33.3 |
92.8 |
DTApre (mm) |
0.686 |
48.5 |
72.2 |
72.3 |
29.0 |
11.1 |
90.2 |
MTARR (%) |
0.853 |
65.5 |
88.9 |
69.9 |
85.5 |
38.9 |
98.8 |
MTLRR(%) |
0.712 |
50.5 |
66.7 |
77.1 |
58.5 |
44.4 |
94.0 |
MTTRR (%) |
0.702 |
39.0 |
77.8 |
59.0 |
61.5 |
33.3 |
92.7 |
CATVRR (%) |
0.829 |
83.8 |
77.8 |
80.7 |
89.9 |
44.4 |
94.0 |
Note – Cutoff 1: the value with Youden index; Cutoff 2: the value with specificity above 90.0%;
MTA: maximum tumor area; MTL: maximum tumor length; CATV: cylindrical approximated tumor volume;
DTA: distance from tumor to anal verge; MTARR: maximum tumor area reduction rate;
MTLRR: maximum tumor length reduction rate; MTTRR: maximum tumor thickness reduction rate;
CATVRR: cylindrical approximated tumor volume reduction rate.
DISCUSSION
The benefits of pCR to nCRT in rectal cancer are well elucidated. The reliable and practical predictors are thereby preventing clinicians from potentially offering less invasive treatment options. Several previous studies have indicated that the whole tumor volume after nCRT, which is calculated by multiplying each cross-section area by section thickness, and the reduction rate of whole tumor volume based on the pre- and post-nCRT MRI, are good criteria for predicting pCR [1, 17, 19, 21, 23]. However, this method is extremely time-consuming and is not suitable for routine clinical practice.
In the present study, we used the relatively convenient measurements to achieve the similar positive results. The results showed the predictors of MTApost, MTLpost and CATVpostthat was defined as multiplying MTApost by MTLpost, were useful for assessing pCR with the AUCs of 0.723-0.789, thus suggesting that the size of the residual tissue after nCRT is associated with the tumor response. The smaller post-nCRT tumor area, length and cylindrical approximated volume predicted an increased pCR rate. However no correlation was observed between tumor thickness after nCRT and pCR. A possible explanation was that, the post-nCRT tumor thickness was relatively small compared to the tumor area and tumor length. Our study found that the median value of post-nCRT tumor thickness was less than 10 mm in either pCR or non-pCR group according to both readers, hence the inevitable minor deviation that may affect the statistical result obviously. Currently, there are very few studies that have described parameters of post-nCRT tumor area or diameter for assessing a pCR. For example, Park et al [24] have shown that the parameter of post-nCRT tumor diameter was associated with pCR. The tumor with largest diameter that is smaller than 3 cm may predict a potential pCR (p<0.001).
Significant correlation between the reduction rates of maximum tumor area, length, thickness and cylindrical approximated tumor volume and pCR was found in the study. Among these predictors, the reduction rates of tumor area and cylindrical approximated tumor volume were relatively better compared to tumor length and thickness for identification of pCR with the AUCs of 0.752-0.853 vs. 0.672-0.712.
So for, only a few articles have reported on the relationship between tumor response and size measurement based on MR imaging, other than volumetry analysis. Kim et al [25] have reported that the largest diameter reduction rate of the tumor was significantly associated with pCR or near pCR after nCRT. By using the diameter reduction rate together with visual assessment, the authors obtained AUCs of 0.735-0.791 in ROC curve analysis. Additionally, another recent study evaluated the relationship between MR measurements and pathological tumor regression. Their result suggested that both the diameter and the area reduction rate are correlated with tumor regression, and the AUCs for the former predictors (0.708-0.770) were larger compared to latter ones [26]. By contrast, Patel et al have demonstrated that there is no consistent relation between maximum tumor length and tumor response [27].
In our study, the diagnostic performances of those significant predictors were evaluated on ROC curve analysis. The sensitivity of 61.1-88.9% and specificity of 61.4-80.7% were obtained based on the Youden index associated cutoff values for assessing a pCR. According to the previous studies, similar or slightly better results were reported by using the predictor of whole tumor volume for prediction of tumor response [14, 28, 29]. Although many authors suggested the wait-and-see strategy for the patients with clinical complete response after nCRT, the higher risk of local recurrence was reported for the patients achieving a cCR with non-surgical management compared to those achieving a pCR through radical surgery [14, 28, 29]. So, it is crucial to apply strict criteria for selecting the patients with cCR as the candidates for non-operative managements in clinical practice. Consequently, in the present study, we recommended another cutoff value with high specificity of above 90% for each predictor to select the appropriate patients to perform the nonsurgical management. It was noted that the corresponding sensitivity was relatively low. Thus specific situation of a patient like age, health status and private aspiration, should be more considered in clinical management.
The pre-treatment parameters referring to tumor size measured detected by MR imaging were not associated with higher possibility of pCR in our study, which was consistent with the previous studies based on tumor volumetry method [19, 30]. In the study published by Park et al [24], the pre-nCRT tumor volume was reported to be useful for evaluation of tumor response, but with limited diagnostic efficiency.
We demonstrated that the tumor distance from anal verge was proved to be significantly associated with pCR. The smaller distance to anal verge predicted a greater likelihood of pCR. Some previous studies also showed that the distance from anal verge smaller than 5 or 6 cm was correlated with favorable response [31–34]. The reason for this finding remains unclear, nevertheless one potential explanation is that the tumor close to anal verge may be related to a relative lack of organ mobility in comparison with mid and high tumors. Hence, low rectal tumors may have a reduced incidence of a geographic miss, in terms of radiation therapy volumes and a greater possibility of receiving the prescribed dose compared to the rectal tumors with higher location [31]. Nevertheless, there were several studies with contrary findings [35–37]. They showed no association found between tumor height and pathologic response [35, 36]. Patel et al [37] have reported that the patients with low tumors (<4 cm) were less likely to have a pCR. Still further investigation is needed to determine the relationship between distance from anal verge and tumor response to nCRT.
Several previous studies have found that lower pre-treatment serum CEA level may be a predictive factor of pCR [24, 34, 38]. Our data indicated that 83.3% of patients with pCR had a normal pre-treatment serum CEA level compared with 57.8% in the non-pCR group, but without significant difference. Additionally, Garland et al [36] have indicated that pre-treament serum CEA was not a reliable predictor for assessing pCR.
Parameters of tumor position, tumor circumferential percentage, patient’s age and gender were not significantly correlated with pCR in the study, which was consistent with previously published data [24, 34, 39].
There were some limitations to this study. The first was not as many patients with pCR compared to those with non-pCR in a single institution study, therefore, the diagnostic performance of those predictors should be further explored in multi-central research. Second, tumor signal intensity on T2 weighted MR imaging and apparent diffusion coefficient (ADC) values on diffusion weighted imaging were not evaluated. The drawback of T2 signal and ADC measurements had poor repeatability between different equipment and different MR protocols, while the value for prediction of complete response remains controversial. The relationship between pre-CRT staging and PCR was not evaluated in this study. It was reported that a higher complete pathological response rate was observed in early T3 disease in comparison with more extensive T3 invasion [40]. Here we focused on the diagnostic performance of these morphological predictors in this study, while interesting and worth exploring, further studies on T2 signal, ADC changes and pre-CRT staging will be pursued to further improve diagnostic efficacy. Third, the tumors with mucinous components were also included in this study, and three of these lesions were detected as pCR after surgery. The reduction rate for the tumor with mucous components may be less than that without it due to the presence of mucous lake, possibly leading to misevaluation.
MR tumor regression grade (mrTRG) has been reported to be an excellent method for differentiating good from poor response in patients with rectal cancer [41–42]. Further studies need to be carried out in order to improve the interobserver consistency.
In conclusion, the convenient morphologic measurements are significantly correlated with pCR in patients with rectal cancer. The post-treatment tumor area, length, and CATV, and the corresponding reduction rate before and after nCRT are useful for predicting a pCR with moderate sensitivity and specificity. Since strict criteria are necessary for selection of candidates to participate in watch-and see strategy after nCRT, use and combination of the predictors that are needed to build the diagnostic models should be furthermore explored.
MATERIALS AND METHODS
Patient population
The study was approved by our institutional ethic committee. The written informed consent was obtained from each patient. A prospective study was conducted between October 2012 and August 2014. Inclusion criteria for enrollment were as follows: (1) patients diagnosed with rectal carcinoma by proctoscopic biopsy, (2) no evidence of distant metastases. CT scans of chest and abdomen were performed in all patients to exclude the possibility of metastasis. Hepatic, brain MR examination or bone scan was also performed to exclude suspicious metastases in some patients.(3) no prior treatment was applied before baseline MRI (4) no contraindications to MR examination. A total of consecutive 158 patients underwent pre-treatment MR examination. 57 patients were excluded because of the following reasons: underwent direct surgery without nCRT (n=35), incompletion of CRT (n=2), lack of MR examination during 4-6 weeks after nCRT (n=14) and the time interval between the end of nCRT and surgery beyond 6-8 weeks (n=6). Ultimately, a total cohort of 101 patients were enrolled in the study (72 men, mean age 56.3 years, range 29 to 80; 29 women, mean age 59.8 years, range 31 to 79).
Preoperative nCRT
All patients underwent nCRT before surgery. Radiotherapy was performed by delivering 50Gy (25 fractions of 2 Gy for five times) within 35 days. Concomitant oral capecitabine was given at a dose of 1650mg/m2 daily for 7 periods.
MR imaging acquisition
MR imaging was acquired on a 3.0T system (GE Discovery MR 750, General Electric Medical Systems, USA) with an eight-element phased-array wrap-around surface coil. Patients underwent rectal cleansing using Glycerin enema with a dosage of 10 ml To reduce intestinal peristalsis or rectal spasm, 10 mg of raceanisodamine hydrochloride was injected intramuscularly 20-30 min before MR examination except in patients with contraindications. The ultrasound transmission gel was administered using a rectal tube with the volume of 100-150 ml to highlight the tumor borders within the lumen. All pre- and post-CRT rectal MRI examinations were performed in the supine position by the same system. The oblique axial and sagittal T2-weighted fast-spin echo images without saturation, which were obtained orthogonal or parallel to the long axis of tumor, were regular sequences for patients in our study. Coronal T2-weighted imaging was performed to evaluate the relationship between the tumor and the levator ani muscle or anal sphincters for the patients with distal rectal cancers. The pelvic axial T1-weighted imaging, T2-weighted sequence with fat saturation and diffusion-weighted imaging were also obtained to detect the overall situation of tumor and peripheral structures. The detailed protocols are listed in Table 4. The examination protocols were stable during the study period.
Table 4: Protocols for the MR imaging sequences
Parameter |
Oblique T2WI |
Sagittal T2WI |
Coronal T2WI |
T1WI |
T2WI/FS |
|---|---|---|---|---|---|
TR |
4800 |
4800 |
4800 |
5600 |
5700 |
TE |
115 |
115 |
115 |
min |
85 |
FOV |
16 |
24 |
24 |
34 |
34 |
Matrix |
256x320 |
256x320 |
256x320 |
288×224 |
288×224 |
Band-width |
41 |
41 |
41 |
41 |
31 |
NEX |
4 |
4 |
4 |
2 |
2 |
Frequency direction |
R/L |
A/P |
S/I |
R/L |
R/L |
ETL |
21 |
21 |
21 |
4 |
21 |
Slice thickness (mm) |
3 |
4 |
4 |
5 |
5 |
Intersection gap |
0 |
0.4 |
0.4 |
0.5 |
0.5 |
Imaging analysis
All data were transferred to a PACS workstation. Imaging analysis was performed independently bytwo specialist radiologists with 17 and 14 years’ experience in gastrointestinal imaging. The two readers were both blinded to the pathological and clinical information. The high-resolution T2-weighted imaging was used as the key sequence for evaluation. In case the tumor could not be discerned clearly based only on T2WI, the other sequences were used for assistance. The values were recorded by the average of two repetitive measurements by each reader. These evaluated parameters were defined specifically as follows.
Maximum tumor area (MTA)
Maximum tumor area was measured on the section with largest tumor dimension on the oblique axial T2-weighted imaging (Figure 2). The region of interest (ROI) was manually traced along the bounder of tumor while the corresponding area was calculated automatically. The image was traced twice and the mean value was recorded by the two readers independently. The MTA was measured on MRI before and after nCRT (MTApre, MTApost). The Maximum Tumor Area Reduction Rate (MTARR) was calculated using the following formula: (MTApre-MTApost/ MTApre) × 100%.
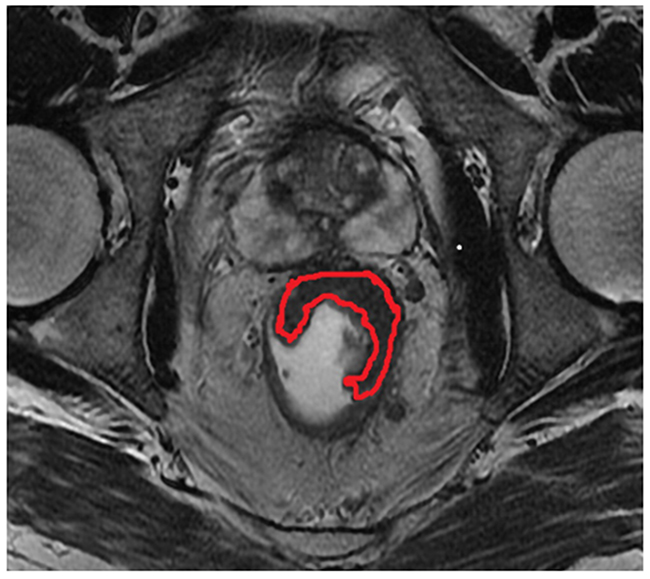
Figure 2: The region delineated by red curved line indicates indicates the measurement of maximum tumor area(MTA) on the oblique axial T2-weighted imaging.
Maximum tumor length (MTL) and maximum tumor thickness (MTT)
MTL and MTT were obtained on the section with largest tumor on sagittal and oblique axial T2-weighted imaging respectively (Figure 3A and 3B). A correspondingly bending line was used for evaluating MTL for the bending tumor. The obscure composition area at the connective band between tumor and rectal wall or other peripheral tissues was avoided during the measurements. MTL and MTT were obtained on MRI before and after nCRT and labeled as MTLpre, MTLpost, MTTpre, and MTTpost, respectively. The Maximum TumorLength Reduction Rate and Maximum Tumor Thickness Reduction Rate (MTLRR, MTTRR) was calculated using the following formula: (MTLpre-MTLpost/ MTLpre) × 100% and (MTTpre-MTTpost/ MTTpre) × 100% respectively.
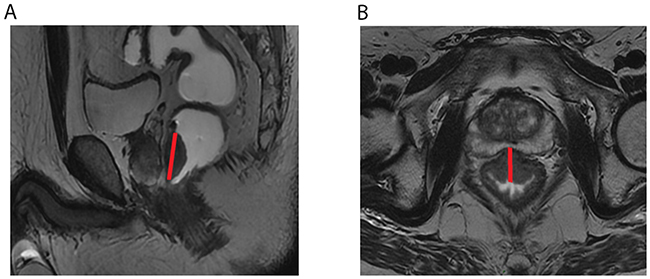
Figure 3: The red straight lines across the lesion indicate the measurement of maximum tumor length (MTL) (A) and maximum tumor thickness (MTT) (B) on sagittal and oblique axial T2-weighted imaging.
Cylindrical approximated tumor volume (CATV)
A crude measurement, cylindrical approximated tumor volume (CATV) was defined as multiplying MTA by MTL on MRI before and after nCRT and recorded as CATVpre and CATVpost. The cylindrical approximated tumor volume reduction rate (CATVRR) was calculated using the equation CATVRR (%) = (CATVpre-CATVpost/ CATVpre) × 100%.
Distance from tumor to anal verge (DTA)
The DTA was measured on the pre-treatment sagittal T2-weighted imaging from the inferior part of the tumor to the anal verge (Figure 4).
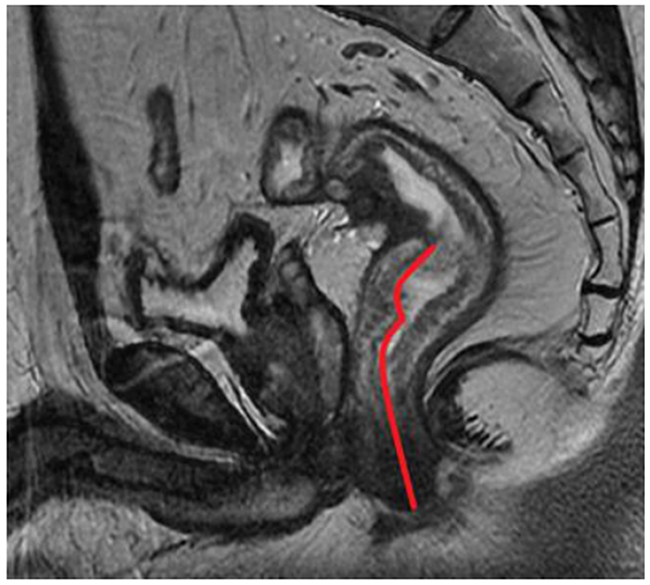
Figure 4: The red curved line from from the inferior part of the tumor to the anal verge indicates the measurement of distance from tumor to anal verge (DTA) on sagittal T2-weighted imaging.
Tumor position (TP)
The Tumor position (TP) was evaluated on the same section that was used for measurement of MTA on oblique axial T2-weighted imaging. The rectal wall was divided into four parts along two orthogonal lines that passed through the perceived center of the lumen, i.e. anterior, posterior, left lateral, and right lateral wall (Figure 5). Consequently, the parameter of TP was classified into four types based on the location of the main body of the tumor (type 1, anterior wall; type 2, posterior wall; type 3, left lateral wall, and type 4, right lateral wall).
Circumferential percentage (CP) of rectal involvement
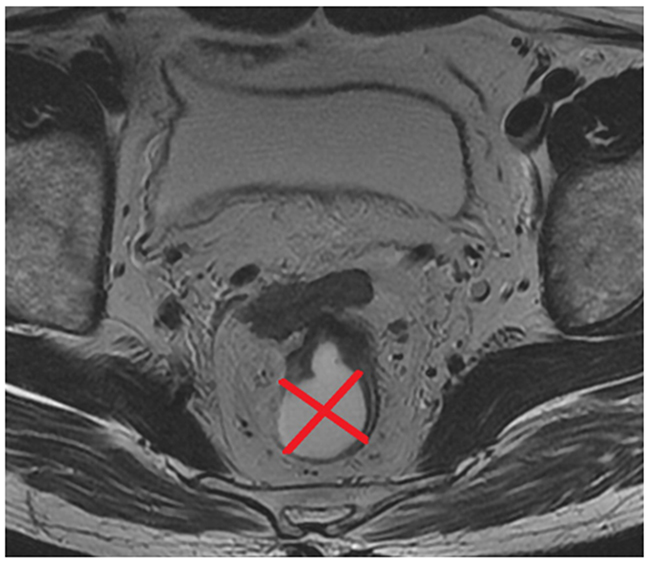
Figure 5: Two orthogonal lines that passed through the perceived centre of the lumen divided the rectal wall into four groups of tumor position (TP).
Circumferential Percentage (CP) of rectal involvement was categorized as four groups according to the percentage of the circumference of rectum involved by the tumor (group 1, <25%; group 2, 25-50%; group 3, 50%-75%; and group 4, >75%). The evaluations were performed on the oblique axial T2-weighted images before and after nCRT and recorded as CPpreand CPpost by the independent readers.
Besides the imaging parameters, some clinical data including gender, age and pre-treatment carcinogen-embryonic antigen (CEA) level were also recorded for evaluation.
Pathological assessment
For all the patients the surgery was performed 6-8 weeks after nCRT. The specimen was fixed in formalin for 24 hours, then each specimen was sliced transversely, perpendicular to the rectal lumen, at 3 mm intervals. The tumor and lymph nodes slices were stained using hematoxylin-eosin. Each specimen was analyzed precisely by a single experienced pathologist with 19 years of experience in colorectal histopathology. pCR was defined as no residual tumor cells found on histological examination of the specimen (T0N0).
Statistical analysis
All of the qualitative data were compared with Chi-square test between pCR and non-pCR groups for each reader. Kolmogorov-Smirnov test was used for normal distribution test for the quantitative data. The normally distributed data were expressed as mean±standard deviation, SD and nonparametric data as median±interquartile range, IQR. The independent sample t-test was used for parametric continuous variables to determine the significant difference between pCR and non-pCR groups for each reader. The chi-square test or Fisher exact test was used for the nonparametric continuous variables. P<0.05 was considered to be statistically significant.
The diagnostic performance was done using receiver operating characteristic (ROC) curves for those significant predictors, and areas under the receiver operating characteristic curve (AUCs) were calculated. For each predictor, a cut-off value associated with Youden Index was obtained, and the sensitivity and specificity were calculated. Furthermore, another cut-off value with specificity above 90.0% was also evaluated in consideration of the policy that strict criteria should be applied in selecting patients for the “wait-and-see” strategy.
Inter-observer agreement between two readers was assessed by using Kappa statistics for qualitative data, and inter-observer correlation coefficient (ICC) for quantitative data. The relative criteria were as follows: < 0.20, low agreement; 0.21-0.40, fair; 0.41-0.60, moderate; 0.61-0.80, substantial; and greater than 0.80, excellent agreement.
Statistical Package for the Social Sciences (SPSS, version 20.0, Inc., Chicago, IL) was used to perform the statistical analyses.
Abbreviations
Pathologically complete response (pCR), Pathologically incomplete response (non-pCR), Neoadjuvant chemoradiotherapy (nCR), Maximum tumor area(MTA), Maximum tumor length(MTL), Maximum tumor thickness(MTT), Cylindrical approximated tumor volume (CATV), Distance to anal verge (DTA), Locally advanced rectal cancer (LARC), Total mesorectal excision (TME), Clinical complete response (cCR), Magnetic resonance imaging (MRI), Diffusion weighted MR images(DWI), Maximum Tumor Area Reduction Rate (MTARR), MaximumTumorLength Reduction Rate (MTLRR), Maximum TumorThickness Reduction Rate (MTTRR), Cylindrical approximated tumor volume reduction rate(CATVRR), Tumor position(TP), Circumferential Percentage (CP), Carcino-embryonic antigen (CEA), Receiver operating characteristic (ROC), Areas under the receiver operating characteristic curve (AUCs), Inter-observer correlation coefficient (ICC), Apparent diffusion coefficient(ADC).
CONFLICTS OF INTEREST
The authors declare that they have no competing interest.
FUNDING
This research is supported by Beijing Science and Technology Project (Z161100000516101), Beijing Hope Run Special Fund of Cancer Foundation of China (LC2016A05), and National Key research and development program of the Ministry of Science and Technology of China (2016YFC0905303).
REFERENCES
1. Nougaret S, Reinhold C, Mikhael HW, Rouanet P, Bibeau F, Brown G. The use of MR imaging in treatment planning for patients with rectal carcinoma: Have You Checked the “DISTANCE”? Radiology. 2013; 268: 330-44. https://doi.org/10.1148/radiol.13121361.
2. Ye F, Zhang H, Liang X, Ouyang H, Zhao X, Zhou C. JOURNAL CLUB: Preoperative MRI evaluation of primary rectal cancer: intrasubject comparison with and without rectal distention. AJR Am J Roentgenol. 2016; 207: 32-9. https://doi.org/10.2214/ajr.15.15383.
3. Salem ME, Hartley M, Unger K, Marshall JL. Neoadjuvant combined-modality therapy for locally advanced rectal cancer and its future direction. Oncology (Williston Park). 2016; 30: 546-62.
4. Liu GC, Yan JP, He Q, An X, Pan ZZ, Ding PR. Effect of neoadjuvant chemoradiotherapy with capecitabine versus fluorouracil for locally Advanced rectal cancer: a meta-analysis. Gastroenterol Res Pract. 2016; 2016: 1798285. https://doi.org/10.1155/2016/1798285.
5. Li Y, Wang J, Ma X, Tan L, Yan Y, Xue C, Hui B, Liu R, Ma H, Ren J. A review of neoadjuvant chemoradiotherapy for locally advanced rectal cancer. Int J Biol Sci. 2016; 12: 1022-31. https://doi.org/10.7150/ijbs.15438.
6. Maas M, Nelemans PJ, Valentini V, Das P, Rodel C, Kuo LJ, Calvo FA, Garcia-Aguilar J, Glynne-Jones R, Haustermans K, Mohiuddin M, Pucciarelli S, Small W Jr, et al. Long-term utcome in patients with a pathological complete response after chemoradiation for rectal cancer: a pooled analysis of individual patient data. Lancet Oncol. 2010; 11: 835-44. https://doi.org/10.1016/s1470-2045(10)70172-8.
7. Ryan JE, Warrier SK, Lynch AC, Heriot AG. Assessing pathological complete response to neoadjuvant chemoradiotherapy in locally advanced rectal cancer: a systematic review. Colorectal Dis. 2015; 17: 849-61. https://doi.org/10.1111/codi.13081.
8. Joye I, Deroose CM, Vandecaveye V, Haustermans K. The role of diffusion-weighted MRI and (18)F-FDG PET/CT in the prediction of pathologic complete response after radiochemotherapy for rectal cancer: a systematic review. Radiother Oncol. 2014; 113: 158-65. https://doi.org/10.1016/j.radonc.2014.11.026.
9. Cai PQ, Wu YP, An X, Qiu X, Kong LH, Liu GC, Xie CM, Pan ZZ, Wu PH, Ding PR. Simple measurements on diffusion-weighted MR imaging for assessment of complete response to neoadjuvant chemoradiotherapy in locally advanced rectal cancer. Eur Radiol. 2014; 24: 2962-70. https://doi.org/10.1007/s00330-014-3251-5.
10. Petrillo M, Fusco R, Catalano O, Sansone M, Avallone A, Delrio P, Pecori B, Tatangelo F, Petrillo A. MRI for assessing response to neoadjuvant therapy in locally advanced rectal cancer using DCE-MR and DW-MR Data Sets: a preliminary report. Biomed Res Int. 2015; 2015: 514740. https://doi.org/10.1155/2015/514740.
11. Hartley A, Ho KF, McConkey C, Geh JI. Pathological complete response following pre-operative chemoradiotherapy in rectal cancer: analysis of phase II/III trials. Br J Radiol. 2005; 78: 934-8. https://doi.org/10.1259/bjr/86650067.
12. Martin ST, Heneghan HM, Winter DC. Systematic review and meta-analysis of outcomes following pathological complete response to neoadjuvant chemoradiotherapy for rectal cancer. Br J Surg. 2012; 99: 918-28. https://doi.org/10.1002/bjs.8702.
13. Yang TJ, Goodman KA. Predicting complete response: is there a role for non-operative management of rectal cancer? J Gastrointest Oncol. 2015; 6: 241-6. https://doi.org/10.3978/j.issn.2078-6891.2014.110.
14. Li J, Li L, Yang L, Yuan J, Lv B, Yao Y, Xing S. Wait-and-see treatment strategies for rectal cancer patients with clinical complete response after neoadjuvant chemoradiotherapy: a systematic review and meta-analysis. Oncotarget. 2016; 7: 44857-70. https://doi.org/10.18632/oncotarget.8622.
15. Zhang H, Zhang C, Zheng Z, Ye F, Liu Y, Zou S, Zhou C. Chemical shift effect predicting lymph node status in rectal cancer using high-resolution MR imaging with node-for-node matched histopathological validation. Eur Radiol. 2017; 27: 3845-55. https://doi.org/10.1007/s00330-017-4738-7.
16. Kluza E, Rozeboom ED, Maas M, Martens M, Lambregts DM, Slenter J, Beets GL, Beets-Tan RG. T2 weighted signal intensity evolution may predict pathological complete response after treatment for rectal cancer. Eur Radiol. 2013; 23: 253-61. https://doi.org/10.1007/s00330-012-2578-z.
17. Ha HI, Kim AY, Yu CS, Park SH, Ha HK. Locally advanced rectal cancer: diffusion-weighted MR tumour volumetry and the apparent diffusion coefficient for evaluating complete remission after preoperative chemoradiation therapy. Eur Radiol. 2013; 23: 3345-53. https://doi.org/10.1007/s00330-013-2936-5.
18. Cho SH, Kim GC, Jang YJ, Ryeom H, Kim HJ, Shin KM, Park JS, Choi GS, Kim SH. Locally advanced rectal cancer: post-chemoradiotherapy ADC histogram analysis for predicting a complete response. Acta Radiol. 2015; 56: 1042-50. https://doi.org/10.1177/0284185114550193.
19. Curvo-Semedo L, Lambregts DM, Maas M, Thywissen T, Mehsen RT, Lammering G, Beets GL, Caseiro-Alves F, Beets-Tan RG. Rectal cancer: assessment of complete response to preoperative combined radiation therapy with chemotherapy--conventional MR volumetry versus diffusion-weighted MR imaging. Radiology. 2011; 260: 734-43. https://doi.org/10.1148/radiol.11102467.
20. Lambrecht M, Vandecaveye V, De Keyzer F, Roels S, Penninckx F, Van Cutsem E, Filip C, Haustermans K. Value of diffusion-weighted magnetic resonance imaging for prediction and early assessment of response to neoadjuvant radiochemotherapy in rectal cancer: preliminary results. Int J Radiat Oncol Biol Phys. 2012; 82: 863-70. https://doi.org/10.1016/j.ijrobp.2010.12.063.
21. Kang JH, Kim YC, Kim H, Kim YW, Hur H, Kim JS, Min BS, Kim H, Lim JS, Seong J, Keum KC, Kim NK. Tumor volume changes assessed by three-dimensional magnetic resonance volumetry in rectal cancer patients after preoperative chemoradiation: the impact of the volume reduction ratio on the prediction of pathologic complete response. Int J Radiat Oncol Biol Phys. 2010; 76: 1018-25. https://doi.org/10.1016/j.ijrobp.2009.03.066.
22. Yeo SG, Kim DY, Kim TH, Jung KH, Hong YS, Chang HJ, Park JW, Lim SB, Choi HS, Jeong SY. Tumor volume reduction rate measured by magnetic resonance volumetry correlated with pathologic tumor response of preoperative chemoradiotherapy for rectal cancer. Int J Radiat Oncol Biol Phys. 2010; 78: 164-71. https://doi.org/10.1016/j.ijrobp.2009.07.1682.
23. Neri E, Guidi E, Pancrazi F, Castagna M, Castelluccio E, Balestri R, Buccianti P, Masi L, Falcone A, Manfredi B, Faggioni L, Bartolozzi C. MRI tumor volume reduction rate vs tumor regression grade in the pre-operative re-staging of locally advanced rectal cancer after chemo-radiotherapy. Eur J Radiol. 2015; 84: 2438-43. https://doi.org/10.1016/j.ejrad.2015.08.008.
24. Park CH, Kim HC, Cho YB, Yun SH, Lee WY, Park YS, Choi DH, Chun HK. Predicting tumor response after preoperative chemoradiation using clinical parameters in rectal cancer. World J Gastroenterol. 2011; 17: 5310-6. https://doi.org/10.3748/wjg.v17.i48.5310.
25. Kim SH, Lee JM, Park HS, Eun HW, Han JK, Choi BI. Accuracy of MRI for predicting the circumferential resection margin, mesorectal fascia invasion, and tumor response to neoadjuvant chemoradiotherapy for locally advanced rectal cancer. J Magn Reson Imaging. 2009; 29: 1093-101. https://doi.org/10.1002/jmri.21742.
26. Fujii S, Nougaret S, Escal L, Azria D, Assenat E, Rouanet P, Reinhold C, Guiu B. MR imaging of locally advanced low rectal cancer: Relationships between imaging findings and the pathological tumor regression grade. J Magn Reson Imaging. 2015; 42: 421-6. https://doi.org/10.1002/jmri.24783.
27. Patel UB, Brown G, Rutten H, West N, Sebag-Montefiore D, Glynne-Jones R, Rullier E, Peeters M, Van Cutsem E, Ricci S, Van de Velde C, Kjell P, Quirke P. Comparison of magnetic resonance imaging and histopathological response to chemoradiotherapy in locally advanced rectal cancer. Ann Surg Oncol. 2012; 19: 2842-52. https://doi.org/10.1245/s10434-012-2309-3.
28. Glynne-Jones R, Hughes R. Critical appraisal of the ‘wait and see’ approach in rectal cancer for clinical complete responders after chemoradiation. Br J Surg. 2012; 99: 897-909. https://doi.org/10.1002/bjs.8732.
29. Hughes R, Harrison M, Glynne-Jones R. Could a wait and see policy be justified in T3/4 rectal cancers after chemo-radiotherapy? Acta Oncol. 2010; 49: 378-81. https://doi.org/10.3109/02841860903483692.
30. Zorcolo L, Rosman AS, Restivo A, Pisano M, Nigri GR, Fancellu A, Melis M. Complete pathologic response after combined modality treatment for rectal cancer and long-term survival: a meta-analysis. Ann Surg Oncol. 2012; 19: 2822-32. https://doi.org/10.1245/s10434-011-2209-y.
31. Yu SK, Tait D, Chau I, Brown G. MRI predictive factors for tumor response in rectal cancer following neoadjuvant chemoradiation therapy--implications for induction chemotherapy? Int J Radiat Oncol Biol Phys. 2013; 87: 505-11. https://doi.org/10.1016/j.ijrobp.2013.06.2052.
32. Restivo A, Zorcolo L, Cocco IM, Manunza R, Margiani C, Marongiu L, Casula G. Elevated CEA levels and low distance of the tumor from the anal verge are predictors of incomplete response to chemoradiation in patients with rectal cancer. Ann Surg Oncol. 2013; 20: 864-71. https://doi.org/10.1245/s10434-012-2669-8.
33. Das P, Skibber JM, Rodriguez-Bigas MA, Feig BW, Chang GJ, Wolff RA, Eng C, Krishnan S, Janjan NA, Crane CH. Predictors of tumor response and downstaging in patients who receive preoperative chemoradiation for rectal cancer. Cancer. 2007; 109: 1750-5. https://doi.org/10.1002/cncr.22625.
34. Armstrong D, Raissouni S, Price HJ, Mercer J, Powell E, MacLean A, Jiang M, Doll C, Goodwin R, Batuyong E, Zhou K, Monzon JG, Tang PA, et al. Predictors of pathologic complete response after neoadjuvant treatment for rectal cancer: a multicenter study. Clin Colorectal Cancer. 2015; 14: 291-5. https://doi.org/10.1016/j.clcc.2015.06.001.
35. Wallin U, Rothenberger D, Lowry A, Luepker R, Mellgren A. CEA - a predictor for pathologic complete response after neoadjuvant therapy for rectal cancer. Dis Colon Rectum. 2013; 56: 859-68. https://doi.org/10.1097/DCR.0b013e31828e5a72.
36. Garland ML, Vather R, Bunkley N, Pearse M, Bissett IP. Clinical tumour size and nodal status predict pathologic complete response following neoadjuvant chemoradiotherapy for rectal cancer. Int J Colorectal Dis. 2014; 29: 301-7. https://doi.org/10.1007/s00384-013-1821-7.
37. Patel SV, Roxburgh CS, Vakiani E, Shia J, Smith JJ, Temple LK, Paty P, Garcia-Aguilar J, Nash G, Guillem J, Wu A, Reyngold M, Weiser MR. Distance to the anal verge is associated with pathologic complete response to neoadjuvant therapy in locally advanced rectal cancer. J Surg Oncol. 2016; 114: 637-41. https://doi.org/10.1002/jso.24358.
38. Joye I, Debucquoy A, Fieuws S, Wolthuis A, Sagaert X, D’Hoore A, Haustermans K. Can clinical factors be used as a selection tool for an organ-preserving strategy in rectal cancer? Acta Oncol. 2016; 55: 1047-52. https://doi.org/10.3109/0284186x.2016.1167954.
39. Hsu CY, Wang CW, Kuo CC, Chen YH, Lan KH, Cheng AL, Kuo SH. Tumor compactness improves the preoperative volumetry-based prediction of the pathological complete response of rectal cancer after preoperative concurrent chemoradiotherapy. Oncotarget. 2017; 8: 7921-34. https://doi.org/10.18632/oncotarget.13855.
40. Wilkins S, Haydon A, Porter I, Oliva K, Staples M, Carne P, McMurrick P, Bell S. Complete pathological response after neoadjuvant long-course chemoradiotherapy for rectal cancer and its relationship to the degree of T3 mesorectal invasion. Dis Colon Rectum. 2016; 59: 361-8. https://doi.org/10.1097/dcr.0000000000000564.
41. Siddiqui MR, Bhoday J, Battersby NJ, Chand M, West NP, Abulafi AM, Tekkis PP, Brown G. Defining response to radiotherapy in rectal cancer using magnetic resonance imaging and histopathological scales. World J Gastroenterol. 2016; 22: 8414-34. https://doi.org/10.3748/wjg.v22.i37.8414.
42. Fayaz MS, Demian GA, Fathallah WM, Eissa HE, El-Sherify MS, Abozlouf S, George T, Samir SM. Significance of magnetic resonance imaging-assessed tumor response for locally advanced rectal cancer treated with preoperative long-course chemoradiation. J Glob Oncol. 2016; 2: 216-21. https://doi.org/10.1200/jgo.2015.001479.