
INTRODUCTION
Thyroid cancer (TC) is the most common endocrine malignancy in United States with rapidly rising incidence. The American Cancer Society estimates 56,850 new cases of thyroid cancer in 2017. Morphologically, the thyroid cancers are classified as papillary, follicular, medullary and anaplastic. Differentiated papillary (PTC) and follicular forms comprise 90-95% of thyroid cancers and are treatable, whereas anaplastic thyroid cancer (ATC) is the rarest but the most fatal and incurable form of the disease, with a median survival of 5 months [1]. ATC is an undifferentiated cancer arising presumably from pluripotent thyroid progenitor cells and accumulating genetic lesions. ATC is aneuploid with several chromosomal abnormalities and loss of heterozygosity. ATC can range from poorly differentiated TC characterized by high mitotic index to squamaous TC where its thyroid origin is difficult to ascertain.
For most ATCs, mutation of BRAF (v-raf murine sarcoma viral oncogene homolog B) or in rare cases, detection of RET/PTC and PAX8/PPAR fusions suggests thyroid origin of cells [2–4]. Presence of the tumor protein TP53 and β-catenin commonly found in ATCs but occasionally seen in poorly differentiated carcinoma also suggests tumor dedifferentiation [5–10]. ATC etiology is not completely understood; however several premises indicate that it originates from thyroid stem cells to manifest an undifferentiated, but aggressive phenotype [11, 12]. It is believed that both the papillary and follicular thyroid cancers result from a similar differentiation program coupled with the development of mutations most notably RET/PTC, RAS and BRAF for PTC and/or PAX8/PPARΎ [13–17]. However, genetic lesions are not uniformly distributed and no single or group of mutations define ATC [12, 13, 18–20]. The heterogeneity of tumor cell differentiation and the repertoire of genetic lesions (although TC has the least numbers of genetic lesions as compared to other TCs) makes difficult the task of developing a universal therapy with demonstrated clinical efficacy [21, 22].
There are several interactive open-access dbases of cancer transcriptomic signatures and even an Atlas of the Human Cancer Transcriptome [23] presenting favorable and unfavorable prognostic genes with associated Kaplan-Mayer surviving diagrams. In previous papers [24–28], we have analyzed the significance and utility of several potential TC biomarkers and therapeutic targets and their dependence on sex hormones [29–32]. However, being selected from the most frequently altered (as sequence or/and expression) genes in large population cohorts, the biomarkers appeared as less protected by the homeostatic mechanisms like low players in cell life. Therefore, restoration of the structure/expression of the altered biomarkers has most likely little therapeutic value. This explains why so far, no TC gene biomarker [33, 34] proved therapeutically efficient. Moreover, not only the biomarker(s) but thousands other genes are altered in TC, in (although partially overlapping) never repeatable combinations and nobody knows whether the neglected contributions of the other gene alterations are really negligible.
If cancer and normal cells are governed by distinct gene master regulators (GMRs) than “smart” manipulation of GMRs would selectively destroy the cancer nodules without much damage to the surrounding healthy tissue. The idea of master regulators has been around for almost four decades, most authors looking for transcription factors occupying the top of the regulatory hierarchy that determines cell fate and differentiation. Sophisticated algorithms using reverse engineering of transcriptional networks have been proposed and validated for use in therapeutic decision making [35]. KEGG (http://www.genome.jp), GenMapp (http://genmapp.org), IPA (http://ingenuity.com), DAVID (http://david.abcc.ncifcrf.gov) and other popular software have been developed to ensemble the biomarkers and other genes in functional pathways. Regardless of the method (Pearson correlation, Boolean, Bayesian, differential equations or just knowledge-based) to network the genes with respect to their co-regulation in different conditions [36, 37], such algorithms implicitly assumes ironclad functional pathways. This is a major weakness given the evident morphological and physiological changes during cancerization and in response to chemo-, radio and cell therapy. Although manually curated by genomic experts, the functional pathways constructed by these (actually) text miners are also “too” universal, lacking specificity with respect to race/strain, sex, age, and risk factors. Moreover, they are deterministic (unique network) in spite of the stochastic nature of the chemical reactions leading to an environmentally depending spectrum of possible “wirings” of the same subset of genes.
We consider as GMR a gene whose highly protected expression by the homeostatic mechanisms governs the phenotype by regulating the transcription of genes involved in major functional pathways through expression coordination. The high protection (indicating the critical importance for cell life) confines expression oscillations of GMRs in narrow intervals. Therefore, GMRs are rarely found spontaneously regulated and by consequence not selected as biomarkers. We estimate the protection of GMR from the reduced expression variability and its power to modulate a pathway from the Pearson correlation with expression oscillations of the pathway genes in biological replicas (obtained by splitting in four the malign and normal regions of the removed tumor).
Our approach, consistent with the Genomic Fabric Paradigm (GFP, [38, 39], does not provide novel biomarkers for TC diagnostic in ALL patients but a revolutionary way to cure the TC of the ACTUAL patient. The genomic fabric is defined as the transcriptome associated with the most interconnected and stably expressed network of genes responsible for a particular functional pathway. The fabric exhibits specificity with respect to race/strain, sex and sex hormones, age, tissue/cell type, and life style and environmental factors. It remodels during development, progression of a disease and in response to external stimuli and treatments.
Recently [40], we tested the hypothesis that cancer and normal cells are governed by different GMRs in the normal cortex and two primary tumor regions of a surgically removed clear cell renal cell carcinoma from a 74y old male. Here, we test again this hypothesis in a papillary cancer and cancer free surrounding tissue from the left thyroid lobectomy of a 33y old female. The efficacy of GMR targeting was checked by determining the transcriptomic effects of stable transfection of genes with different GCHs in the papillary BCPAP [41] and anaplastic 8505C [42] human TC cells that we used in previous studies [25, 27–29].
RESULTS
Experimental methods and raw and normalized gene expression data complying with the “Minimum Information about Microarray Experiments” (MIAME, [43]) were deposited in https://www.ncbi.nlm.nih.gov/gds/ and are publically accessible as GSE97001, GSE97002, GSE97028, GSE97030, GSE97031 and GSE97427.
Cancer alters expression and coordination of numerous genes
Compared to the normal tissue, expression of 5.1%% of the quantified unigenes was up-regulated and of 2.7% was down-regulated in the malignant region of the excised thyroid tumor. When comparison was extended to the papillary BCPAP cells, 17.10% of the genes were up-regulated and 15.53 down-regulated, while in the anaplastic 8505C cells, 17.09% of the genes were up- and 18.79% were down-regulated. Table 1 lists the fold-change (negative for down-regulation) and the p-value of the regulation, and Figure 1A the interconnection of the genes included in the KEGG1 -determined pathway of thyroid cancer with respect to the surrounding unaffected tissue of thyroid.
1modified from map05216, Kanehisa Laboratories, www.kegg.jp
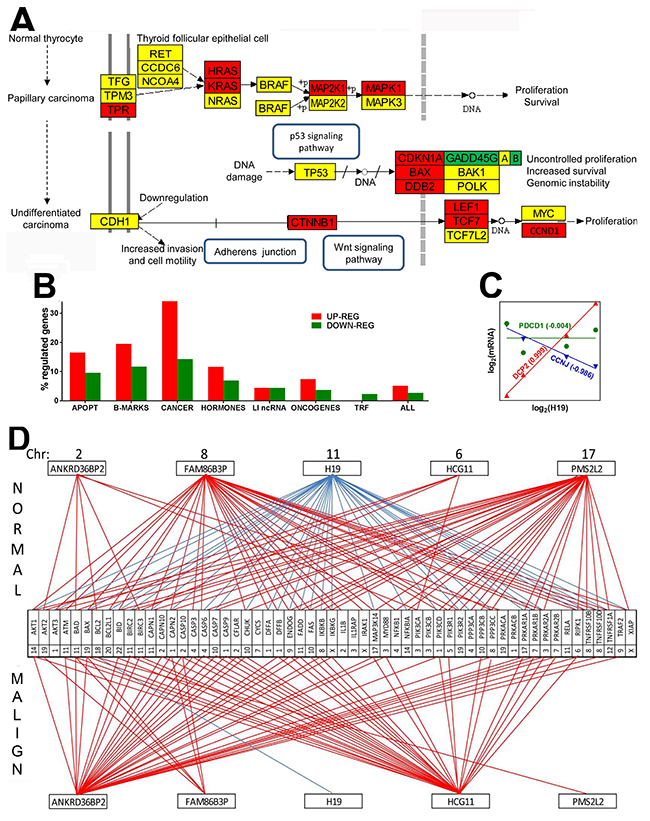
Figure 1: Papillary cancer of the thyroid regulates numerous genes and remodel transcriptomic networks. (A) Regulation of the KEGG-determined pathway of thyroid cancer. Red/green/yellow background of the gene symbol indicates up-/down/no regulation. GADD45G|A|B indicates the three growth arrest and DNA-damage-inducible genes: gamma, alpha and beta. (B) Percentages of up- and down regulated genes in various groups. APOPT = apoptosis, B-MARKS = biomarkers, CANCER = thyroid cancer, HORMONES = thyroid hormones, LI ncRNAs = long intergenic non-protein coding RNAs, TRF = transcription factors, ALL = the entire transcriptome. (C) Examples of genes synergistically (DCPP2 = decapping mRNA 2), antagonistically (CCNJ = cyclin J) and independently (PDCD1 = programmed cell death 1) expressed with H19 (= H19, imprinted maternally expressed transcript, long non-coding RNA). Numbers near gene symbols are Pearson pair-wise correlation coefficients between the (log2) expression levels of H19 and linked gene. (D) Example of remodeling of the transcriptomic networks by which ncRNAs regulate apoptosis. Red/blue line indicates significant (p-val < 0.05) synergism/antagonism between the linked gene and ncRNA. Numbers close to genes and ncRNAs’ symbols are their hosting chromosomes (Chr).
Table 1: Regulation of the genes included in the KEGG-determined functional pathway of thyroid cancer
Gene |
Systematic name |
Description |
FC |
p-val |
|---|---|---|---|---|
BAK1 |
NM_001188 |
BCL2-antagonist/killer 1 |
1.05 |
0.9125 |
BAX |
NM_138764 |
BCL2-associated X protein |
2.18 |
0.0190 |
BRAF |
NM_004333 |
v-raf murine sarcoma viral oncogene homolog B |
1.52 |
0.3870 |
CCDC6 |
NM_005436 |
coiled-coil domain containing 6 |
-1.28 |
0.5853 |
CCND1 |
NM_053056 |
cyclin D1 |
2.90 |
0.0223 |
CDH1 |
NM_004360 |
cadherin 1, type 1, E-cadherin |
1.17 |
0.8237 |
CDKN1A |
NM_078467 |
cyclin-dependent kinase inhibitor 1A |
2.65 |
0.0205 |
CTNNB1 |
NM_001904 |
catenin |
2.59 |
0.0191 |
DDB2 |
NM_000107 |
damage-specific DNA binding protein 2, 48kDa |
2.31 |
0.0603 |
GADD45A |
NM_001924 |
growth arrest and DNA-damage-inducible, alpha |
-1.52 |
0.3406 |
GADD45B |
NM_015675 |
growth arrest and DNA-damage-inducible, beta |
-2.07 |
0.0895 |
GADD45G |
NM_006705 |
growth arrest and DNA-damage-inducible, gamma |
-2.00 |
0.0222 |
HRAS |
NM_005343 |
Harvey rat sarcoma viral oncogene homolog |
1.80 |
0.0254 |
KRAS |
NM_004985 |
Kirsten rat sarcoma viral oncogene homolog |
2.84 |
0.0208 |
LEF1 |
NM_016269 |
lymphoid enhancer-binding factor 1 |
1.91 |
0.0323 |
MAP2K1 |
NM_002755 |
mitogen-activated protein kinase kinase 1 |
1.71 |
0.0150 |
MAP2K2 |
NM_030662 |
mitogen-activated protein kinase kinase 2 |
1.35 |
0.5240 |
MAPK1 |
NM_138957 |
mitogen-activated protein kinase 1 |
1.88 |
0.0308 |
MAPK3 |
NM_002746 |
mitogen-activated protein kinase 3 |
1.28 |
0.6278 |
MYC |
NM_002467 |
v-myc avian myelocytomatosis viral oncogene homolog |
-1.46 |
0.4439 |
NCOA4 |
NM_001145260 |
nuclear receptor coactivator 4 |
-1.27 |
0.5110 |
NRAS |
NM_002524 |
neuroblastoma RAS viral |
-1.26 |
0.6097 |
NTRK1 |
NM_002529 |
neurotrophic tyrosine kinase, receptor, type 1 |
not available |
|
PAX8 |
NM_003466 |
paired box 8 |
-1.99 |
0.0174 |
POLK |
NM_016218 |
polymerase |
-1.10 |
0.8021 |
PPARG |
NM_138711 |
peroxisome proliferator-activated receptor gamma |
-5.00 |
0.0911 |
RET |
NM_020630 |
ret proto-oncogene |
1.10 |
0.8589 |
RXRA |
NM_002957 |
retinoid X receptor, alpha |
-1.66 |
0.2898 |
RXRB |
NM_021976 |
retinoid X receptor, beta |
-1.09 |
0.8583 |
RXRG |
NR_033824 |
retinoid X receptor, gamma |
not available |
|
TCF7 |
NM_003202 |
transcription factor 7 |
4.26 |
0.0724 |
TCF7L1 |
NM_031283 |
transcription factor 7-like 1 |
-4.08 |
0.0492 |
TCF7L2 |
NM_001198531 |
transcription factor 7-like 2 |
-1.02 |
0.9648 |
TFG |
NM_006070 |
TRK-fused gene |
-1.28 |
0.5636 |
TP53 |
NM_001126118 |
tumor protein p53 |
1.37 |
0.1237 |
TPM3 |
NM_001043352 |
tropomyosin 3 |
1.34 |
0.3639 |
TPR |
NM_003292 |
translocated promoter region, nuclear basket protein |
2.51 |
0.0196 |
Gene expression levels in the cancer nodule were compared with the corresponding values in the surrounding unaffected tissue of the profiled thyroid.Red/green/yellow background in the original tables the gene symbols had red/green/yellow background. Please add the background. For instance, the last gene symbol TPR should be in a red background of the gene symbol indicates up-/down-/no regulation, will white background indicates that the expression of the corresponding gene was not quantifiable in all 4 samples from the cancer nodule AND all 4 samples from the unaffected surrounding tissue. FC = fold-change (negative for down-regulation), p-val = p-value of the heteroscedastic t-test of the equality of the average expression level in the tumor side and in the surrounding normal tissue.
We found a significant overexpression of members of the Ras oncogene family HRAS and KRAS (known for their prominent roles in various types of cancer (e.g. [44, 45]. MAP2K1 (mitogen-activated kinase 1), part of the RAS/MAPK pathways, which informs the cell nucleus about the extracellular chemical environment was also up-regulated. Expression of TP53 was not affected, indicating lack of ATC development [46, 47]. Figure 1B presents the percentages of up- and down regulated genes in several well-defined groups of genes. Interestingly, out of the investigated groups of genes, the biomarkers selected from [48] formed the second most regulated group (after the thyroid cancer genes), confirming their value for TC diagnosis. In contrast, the transcription factors (TRF) formed the least regulated group (0.0% up and 2.3% down). With 16.5% up and 9.6% down-regulated genes (listed in Table 2) apoptosis is also a major pathway with substantial alteration in thyroid cancer.
Table 2: Significantly regulated apoptosis genes in the cancer nodule with respect to the surrounding unaffected tissue of the profiled thyroid
Gene |
Systematic name |
Description |
FC |
p-val |
|---|---|---|---|---|
BAX |
NM_138764 |
BCL2-associated X protein |
2.18 |
0.0190 |
BBC3 |
NM_014417 |
BCL2 binding component 3 |
2.80 |
0.0073 |
BCL2 |
NM_000633 |
B-cell CLL/lymphoma 2 |
-3.34 |
0.0087 |
BCL2L11 |
NM_138621 |
BCL2-like 11 |
-3.25 |
0.0073 |
BID |
NM_197966 |
BH3 interacting domain death agonist |
5.77 |
0.0317 |
BIRC5 |
NM_001012271 |
baculoviral IAP repeat containing 5 |
4.14 |
0.0090 |
CASP3 |
NM_004346 |
caspase 3, apoptosis-related cysteine peptidase |
4.01 |
0.0379 |
CTSH |
NM_004390 |
cathepsin H |
6.39 |
0.0044 |
CTSK |
NM_000396 |
cathepsin K |
-1.88 |
0.0126 |
CTSV |
NM_001333 |
cathepsin V |
-1.80 |
0.0282 |
CYCS |
NM_018947 |
cytochrome c, somatic |
-2.14 |
0.0182 |
DAB2IP |
NM_032552 |
DAB2 interacting protein |
2.88 |
0.0099 |
FAS |
NM_000043 |
Fas cell surface death receptor |
2.79 |
0.0075 |
FOS |
NM_005252 |
FBJ murine osteosarcoma viral oncogene homolog |
-2.15 |
0.0140 |
GADD45B |
NM_015675 |
growth arrest and DNA-damage-inducible, beta |
-2.07 |
0.0089 |
GADD45G |
NM_006705 |
growth arrest and DNA-damage-inducible, gamma |
-2.00 |
0.0222 |
GZMB |
NM_004131 |
granzyme B |
-2.27 |
0.0081 |
HRAS |
NM_005343 |
Harvey rat sarcoma viral oncogene homolog |
1.80 |
0.0254 |
HRK |
ENST00000257572 |
harakiri, BCL2 interacting protein |
3.01 |
0.0065 |
ITPR2 |
NM_002223 |
inositol 1,4,5-trisphosphate receptor, type 2 |
3.28 |
0.0079 |
JUN |
NM_002228 |
jun proto-oncogene |
-3.38 |
0.0055 |
KRAS |
NM_004985 |
Kirsten rat sarcoma viral oncogene homolog |
2.84 |
0.0208 |
LMNA |
NM_005572 |
lamin A/C |
2.92 |
0.0053 |
MAP2K1 |
NM_002755 |
mitogen-activated protein kinase kinase 1 |
1.71 |
0.0150 |
MAPK1 |
NM_138957 |
mitogen-activated protein kinase 1 |
1.88 |
0.0308 |
NFKB1 |
NM_003998 |
nuclear factor of kappa light polypeptide gene enhancer in B-cells 1 |
2.15 |
0.0069 |
PARP1 |
NM_001618 |
poly (ADP-ribose) polymerase 1 |
2.50 |
0.0078 |
TNFRSF10B |
NM_003842 |
tumor necrosis factor receptor superfamily, member 10b |
1.84 |
0.0080 |
TNFRSF10C |
NM_003841 |
tumor necrosis factor receptor superfamily, member 10c, decoy without an intracellular domain |
7.14 |
0.0242 |
TNFSF10 |
NM_003810 |
tumor necrosis factor (ligand) superfamily, member 10 |
-4.11 |
0.0064 |
Red/green background of the gene symbol indicates significant up-/down regulation. FC = fold-change (negative for down-regulation), p-val = p-value of the heteroscedastic t-test of the equality of the average expression level in the tumor side and in the surrounding normal tissue.
We found also substantial remodeling of the transcriptomic networks by which the long intergenic non-protein coding RNAs (LI ncRNA) modulate major functional pathways through expression coordination (principle in Figure 1C) with pathway genes. Thus, Figure 1D presents the remodeling of part of the transcriptomic networks that LI ncRNAs form with apoptotic genes (coordination values in Table 3). Notably, some synergistically expressed gene pairs in normal tissue became independently expressed in cancer (ANKRD36BP2-BCL2, PMS2L2-TNFRSF10D, PMS2L2-TNFRSF1A) or an independently expressed pair (HCG11-PPP3CB) in normal became antagonistically expressed in cancer. H19 strong antagonism with expression of apoptotic genes in normal tissue is practically cancelled in cancer, confirming its important role in cancer proliferation revealed by several authors [49]. Our coordination analysis revealed that LI ncRNAs can modulate expression of genes located not only on the same but also on other chromosomes. For instance, in the normal tissue, H19 from Chr 11 antagonizes apoptosis genes from Chr 1 (AKT3, CAPN2, DFFA, DFFB, PIK3CD), Chr 3 (PRKAR2A), Chr 4 (CASP6, PPP3CA), Chr 6 (RIPK1), Chr 7 (PRKAR1B). Chr 8 (IKBKB, PPP3CC, TNFRSF10B TNFRSF10D), Chr 9 (ENDOG), Chr 10 (CASP7, CHUCK, FAS), Chr 11 (BIRC2, CAPN1, FADD), Chr 12 (TNFRSF1A). Chr 14 (AKT1, NFKBIA), Chr 17 (MAPK3K14, PRKAR1A), Chr 19 (BAX, PIK3R2), Chr 20 (BCL2L1) and Chr X (XIAP). In the malign region, the (p < 0.05) significant expression coordination of H19 is limited to a single apoptosis gene, BCL2 (Chr 18) that, interestingly, is not coordinately expressed with H19 in normal tissue. Supplementary Table 1 lists all regulated genes in the cancer nodule with respect to the surrounding normal tissue.
Table 3: Expression coordination values between LI ncRNA and apoptosis genes in normal and malign part of the tumor
Normal |
ANKRD36BP2 |
FAM86B3P |
H19 |
HCG11 |
PMS2L2 |
Malign |
ANKRD36BP2 |
FAM86B3P |
H19 |
HCG11 |
PMS2L2 |
|---|---|---|---|---|---|---|---|---|---|---|---|
AKT1 |
0.680 |
0.978 |
-0.908 |
0.649 |
0.929 |
AKT1 |
0.984 |
0.749 |
0.144 |
0.964 |
-0.173 |
AKT2 |
0.940 |
0.693 |
-0.519 |
0.948 |
0.591 |
AKT2 |
0.858 |
0.999 |
0.205 |
0.834 |
-0.180 |
AKT3 |
0.361 |
0.983 |
-0.999 |
0.313 |
0.986 |
AKT3 |
0.672 |
0.357 |
-0.446 |
0.590 |
0.399 |
ATM |
0.786 |
0.934 |
-0.835 |
0.756 |
0.858 |
ATM |
0.953 |
0.644 |
0.356 |
0.967 |
-0.394 |
BAD |
0.982 |
0.610 |
-0.421 |
0.986 |
0.483 |
BAD |
0.911 |
0.952 |
0.451 |
0.923 |
-0.438 |
BAX |
0.599 |
0.994 |
-0.945 |
0.567 |
0.963 |
BAX |
0.951 |
0.950 |
0.122 |
0.918 |
-0.118 |
BCL2 |
0.921 |
0.793 |
-0.652 |
0.888 |
0.667 |
BCL2 |
0.008 |
-0.120 |
-0.939 |
-0.117 |
0.913 |
BCL2L1 |
0.574 |
0.952 |
-0.922 |
0.509 |
0.888 |
BCL2L1 |
0.794 |
0.371 |
-0.074 |
0.763 |
0.015 |
BID |
0.362 |
0.958 |
-0.979 |
0.297 |
0.940 |
BID |
0.993 |
0.886 |
0.314 |
0.989 |
-0.324 |
BIRC2 |
0.099 |
0.892 |
-0.952 |
0.075 |
0.962 |
BIRC2 |
0.942 |
0.708 |
0.533 |
0.978 |
-0.559 |
BIRC3 |
0.981 |
0.670 |
-0.494 |
0.968 |
0.534 |
BIRC3 |
0.952 |
0.810 |
0.538 |
0.983 |
-0.551 |
CAPN1 |
0.195 |
0.938 |
-0.991 |
0.144 |
0.966 |
CAPN1 |
0.808 |
0.359 |
0.099 |
0.801 |
-0.160 |
CAPN10 |
0.871 |
0.862 |
-0.730 |
0.855 |
0.772 |
CAPN10 |
0.994 |
0.780 |
0.195 |
0.979 |
-0.221 |
CAPN2 |
0.332 |
0.979 |
-1.000 |
0.287 |
0.989 |
CAPN2 |
0.920 |
0.978 |
0.143 |
0.888 |
-0.130 |
CASP10 |
0.302 |
0.809 |
-0.846 |
0.210 |
0.757 |
CASP10 |
0.949 |
0.952 |
0.122 |
0.916 |
-0.118 |
CASP3 |
0.806 |
0.922 |
-0.816 |
0.778 |
0.842 |
CASP3 |
0.963 |
0.868 |
0.482 |
0.984 |
-0.488 |
CASP6 |
0.547 |
0.994 |
-0.955 |
0.519 |
0.978 |
CASP6 |
0.932 |
0.593 |
0.122 |
0.917 |
-0.167 |
CASP7 |
0.091 |
0.899 |
-0.968 |
0.055 |
0.960 |
CASP7 |
0.968 |
0.826 |
0.490 |
0.991 |
-0.503 |
CASP9 |
-0.073 |
0.727 |
-0.799 |
-0.065 |
0.846 |
CASP9 |
0.986 |
0.837 |
0.410 |
0.998 |
-0.425 |
CFLAR |
0.880 |
0.843 |
-0.718 |
0.841 |
0.726 |
CFLAR |
0.980 |
0.712 |
0.283 |
0.980 |
-0.316 |
CHUK |
0.327 |
0.976 |
-0.992 |
0.293 |
0.999 |
CHUK |
0.988 |
0.753 |
0.320 |
0.992 |
-0.348 |
CYCS |
0.059 |
0.773 |
-0.814 |
0.073 |
0.875 |
CYCS |
0.793 |
0.655 |
0.792 |
0.868 |
-0.802 |
DFFA |
0.648 |
0.954 |
-0.903 |
0.590 |
0.881 |
DFFA |
0.763 |
0.349 |
-0.167 |
0.720 |
0.108 |
DFFB |
0.503 |
0.916 |
-0.905 |
0.428 |
0.851 |
DFFB |
0.981 |
0.720 |
0.181 |
0.967 |
-0.214 |
ENDOG |
0.485 |
0.995 |
-0.973 |
0.455 |
0.991 |
ENDOG |
0.981 |
0.887 |
0.399 |
0.989 |
-0.406 |
FADD |
0.691 |
0.975 |
-0.903 |
0.659 |
0.922 |
FADD |
0.988 |
0.745 |
0.207 |
0.976 |
-0.237 |
FAS |
0.418 |
0.993 |
-0.994 |
0.373 |
0.987 |
FAS |
0.871 |
0.742 |
0.697 |
0.928 |
-0.707 |
IKBKB |
0.089 |
0.873 |
-0.930 |
0.073 |
0.952 |
IKBKB |
0.930 |
0.899 |
0.523 |
0.954 |
-0.520 |
IKBKG |
0.377 |
0.973 |
-0.989 |
0.319 |
0.960 |
IKBKG |
0.999 |
0.814 |
0.251 |
0.990 |
-0.272 |
IL1B |
0.602 |
0.918 |
-0.881 |
0.531 |
0.838 |
IL1B |
0.810 |
0.900 |
0.618 |
0.848 |
-0.597 |
IL1RAP |
-0.476 |
0.427 |
-0.571 |
-0.466 |
0.595 |
IL1RAP |
0.725 |
0.316 |
-0.239 |
0.674 |
0.181 |
IRAK1 |
0.683 |
0.919 |
-0.860 |
0.620 |
0.829 |
IRAK1 |
0.857 |
0.464 |
-0.003 |
0.831 |
-0.051 |
MAP3K14 |
0.342 |
0.970 |
-0.994 |
0.285 |
0.967 |
MAP3K14 |
0.993 |
0.767 |
0.254 |
0.987 |
-0.281 |
MYD88 |
0.865 |
0.856 |
-0.722 |
0.855 |
0.772 |
MYD88 |
0.982 |
0.868 |
0.415 |
0.993 |
-0.425 |
NFKB1 |
0.372 |
0.915 |
-0.899 |
0.374 |
0.956 |
NFKB1 |
0.647 |
0.870 |
0.620 |
0.687 |
-0.580 |
NFKBIA |
-0.048 |
0.830 |
-0.925 |
-0.083 |
0.912 |
NFKBIA |
0.665 |
0.748 |
0.808 |
0.737 |
-0.787 |
PIK3CA |
0.957 |
0.544 |
-0.348 |
0.977 |
0.431 |
PIK3CA |
0.753 |
0.283 |
0.018 |
0.739 |
-0.083 |
PIK3CB |
0.706 |
0.866 |
-0.760 |
0.718 |
0.839 |
PIK3CB |
0.723 |
0.226 |
0.206 |
0.738 |
-0.273 |
PIK3CD |
0.566 |
0.998 |
-0.960 |
0.529 |
0.970 |
PIK3CD |
0.983 |
0.769 |
0.403 |
0.997 |
-0.427 |
PIK3R1 |
0.423 |
0.907 |
-0.875 |
0.429 |
0.940 |
PIK3R1 |
0.893 |
0.505 |
0.311 |
0.908 |
-0.361 |
PIK3R2 |
0.328 |
0.974 |
-0.998 |
0.276 |
0.978 |
PIK3R2 |
0.876 |
0.549 |
-0.110 |
0.831 |
0.065 |
PPP3CA |
0.106 |
0.872 |
-0.922 |
0.094 |
0.950 |
PPP3CA |
0.788 |
0.329 |
0.077 |
0.779 |
-0.140 |
PPP3CB |
0.049 |
0.829 |
-0.886 |
0.044 |
0.921 |
PPP3CB |
0.880 |
0.579 |
0.592 |
0.930 |
-0.627 |
PPP3CC |
0.512 |
1.000 |
-0.977 |
0.470 |
0.978 |
PPP3CC |
0.949 |
0.621 |
0.232 |
0.947 |
-0.274 |
PRKACA |
0.912 |
0.778 |
-0.641 |
0.872 |
0.644 |
PRKACA |
0.749 |
0.316 |
-0.143 |
0.710 |
0.082 |
PRKACB |
0.649 |
0.764 |
-0.709 |
0.566 |
0.641 |
PRKACB |
0.680 |
0.238 |
-0.227 |
0.635 |
0.163 |
PRKAR1A |
0.109 |
0.865 |
-0.913 |
0.100 |
0.946 |
PRKAR1A |
0.935 |
0.671 |
0.520 |
0.971 |
-0.550 |
PRKAR1B |
0.491 |
0.994 |
-0.980 |
0.441 |
0.968 |
PRKAR1B |
0.984 |
0.733 |
0.188 |
0.970 |
-0.219 |
PRKAR2A |
0.442 |
0.993 |
-0.981 |
0.411 |
0.996 |
PRKAR2A |
0.982 |
0.771 |
0.408 |
0.997 |
-0.432 |
PRKAR2B |
0.450 |
0.856 |
-0.858 |
0.364 |
0.785 |
PRKAR2B |
0.968 |
0.672 |
0.224 |
0.962 |
-0.262 |
RELA |
-0.152 |
0.750 |
-0.876 |
-0.213 |
0.818 |
RELA |
0.805 |
0.382 |
-0.050 |
0.776 |
-0.009 |
RIPK1 |
0.433 |
0.994 |
-0.992 |
0.387 |
0.984 |
RIPK1 |
0.989 |
0.792 |
0.126 |
0.964 |
-0.150 |
TNFRSF10B |
0.302 |
0.945 |
-0.956 |
0.287 |
0.988 |
TNFRSF10B |
0.725 |
0.782 |
0.775 |
0.791 |
-0.758 |
TNFRSF10D |
0.568 |
0.994 |
-0.952 |
0.539 |
0.973 |
TNFRSF10D |
0.935 |
0.896 |
-0.038 |
0.882 |
0.036 |
TNFRSF1A |
0.562 |
0.984 |
-0.954 |
0.508 |
0.937 |
TNFRSF1A |
0.764 |
0.317 |
-0.063 |
0.737 |
0.001 |
TRAF2 |
-0.186 |
0.737 |
-0.867 |
-0.241 |
0.817 |
TRAF2 |
0.927 |
0.676 |
-0.079 |
0.880 |
0.045 |
XIAP |
0.409 |
0.990 |
-0.995 |
0.361 |
0.984 |
XIAP |
0.505 |
0.228 |
-0.630 |
0.405 |
0.587 |
Red/blue/yellow background of the coordination value indicates that the paired genes were significantly (p-val < 0.05) synergistically/antagonistically/ independently expressed in the indicated region. Note the differences between the two regions.
Cancer and normal cells have different gene hierarchies in the thyroid
Like our previous finding in a case of clear cell renal cell carcinoma [40] the microarray experiment on the left thyroid lobectomy proved existence of genes with large GCH differences between the cancer and the normal part of the tumor. Figure 2 presents the gene commanding heights (GCH) in normal and malign regions of the analyzed thyroid tumor for several TC biomarkers, oncogenes, apoptosis genes and ncRNAs. Note that no biomarker has high GCH, explaining why none of them proved therapeutically efficient for TC. However, with GCH = 26.14 in the malign part and 1.41 (18.5x smaller) in the normal tissue, the 2.71x significantly up-regulated member of the RAS oncogene family RAB15 may be therapeutically actionable for this person as reported for other cancer cases (e.g. [50]).
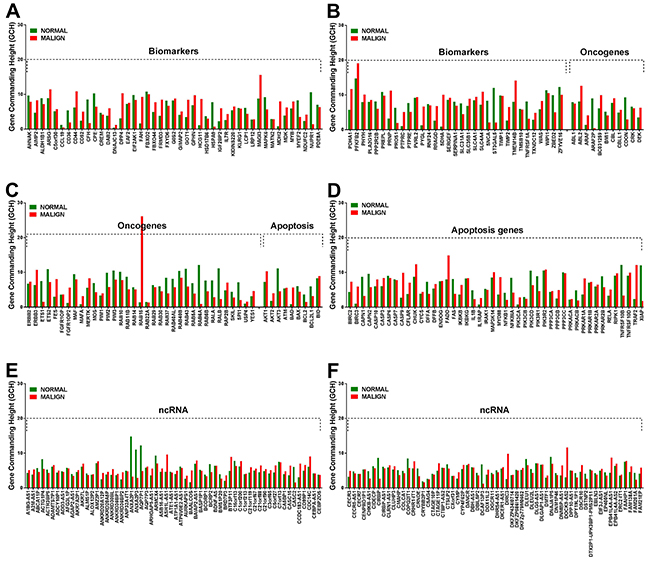
Figure 2: Gene commanding height (GCH) of selected TC biomarkers (A, B) oncogenes (B, C) apoptosis genes (D) and non-coding RNAs (E, F) in the normal and malign part of the surgically removed TC tumor. Note the differences between the GCH scores in the two regions.
Anaplastic and papillary TC phenotypes have major differences in cell-cycle pathway and gene networking
The transcriptomic profiles of the anaplastic (8505C) and papillary (BCPAP) TC cell lines were largely different, with the largest differences (61% = 45% up- and 16% down) in the expression of cell-cycle pathway genes (Figure 3A). This finding explains the accelerated progression to the undifferentiated form of the TC in 8505C cells [51]. Significant expression differences were noticed in both DNA replication (S phase) and mitosis (M phase) phases of the mitotic cell cycle progression as well as in the temporal gaps known as G1 and G2 phases. Such differences between the two TC cell lines justify some of the therapeutic approaches of the ATC. Thus, overexpression of the key regulatory cyclin-dependent kinase CDK1 explains the choice of dinaciclib, a cyclin-dependent kinase inhibitor [52], while overexpression of the proto-oncogene MYC justifies the use of MYC potent inhibitor JQ1 [53]. CDK6 is overexpressed and CDK4 under-expressed, while CDK2 and CDK7 were similarly expressed in the two TC cell lines. All mini-chromosome maintenance genes (MCM2, MCM3, MCM4, MCM5, MCM6, MCM7), required to initiate eukaryotic DNA replication, were overexpressed in the 8505C cells, confirming previous reports (e.g. [54]) on other human ATC cell lines. Also overexpressed are three members of the origin recognition complex (ORC4, ORC5, ORC6) that were also previously linked to cancer development (e.g. [55]).
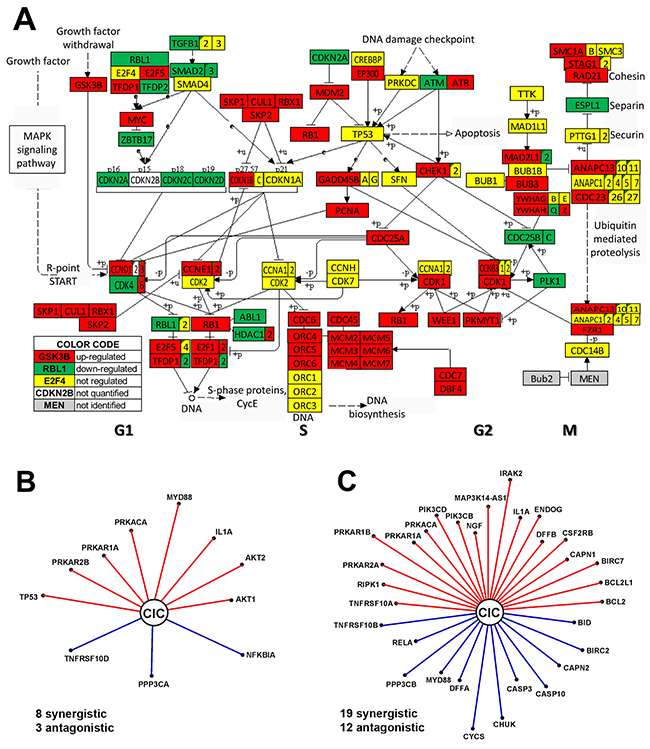
Figure 3: Major differences between anaplastic 8505C and papillary BCPAP TC cells include expression of cell-cycle pathway genes (A) and transcriptomic networks by which CIC (= capicua transcriptional repressor) coordinates expression of apoptotic genes (B–C). In B and C a red/blue line indicates that CIC and the other gene are (p-val < 0.1) synergistically/antagonistically expressed. In order to visualize the strength of the expression coordination, the length of the line is proportional to ρ3 (ρ = Pearson pair-wise correlation coefficient). Thus, longer distances to CIC (as for PRKAR1B, IRAK2 and CYCS in the 8505C network) indicate stronger expression coordination and by consequence stronger downstream influence. Note the differences between the two networks.
The transcriptomes of the two phenotypes also differ in the way the genes are networked to accomplish various biological processes. For instance, Figure 3B and 3C present the apoptosis genes that are significantly (p < 0.05) coordinately expressed with CIC (= capicua transcriptional repressor) a gene related to the various forms of cancer (e.g.: [56, 57]. Of note is that CIC coordinates the expression of many more apoptosis genes in the anaplastic phenotype and that only synergism with IL1A, PRKACA and PRKAR1A is common to both phenotypes.
Predictive value of GCH score: expression manipulation of a gene has larger effects on cells it commands
We determined and compared the GCH scores of individual genes in the BCPAP and 8505C cell lines before any transfection (partially illustrated in Figure 4A). DDX10, NEMP1, PANK2 and UBALD1 were selected because of their availability (through Albert Einstein College of Medicine Genomics Facility), significantly different GCH-scores but close expression levels (AVE) and low coefficient of variation (CV) in the two cell lines (Figure 4B). The characteristics of the clones chosen to be stably transfected (one at a time) into the two types of cells are presented in Figure 4C. The microarray experiment validated (p-value = 0.000152) our hypothesis that manipulation of a gene’s expression induced larger transcriptomic alterations in the cells where it has larger GCH (Figure 4D-4G). There is a perfect positive Spearman rank correlation between the (% regulated in BCPAP, % regulated in 8505C) and (GCH in BCPAP, GCH in 8505C) for all four transfected genes. Moreover, the strong positive Pearson product-momentum correlation with the percentage of regulated genes (Figure 4H) for each cell line validated the predictive value of GCH score.
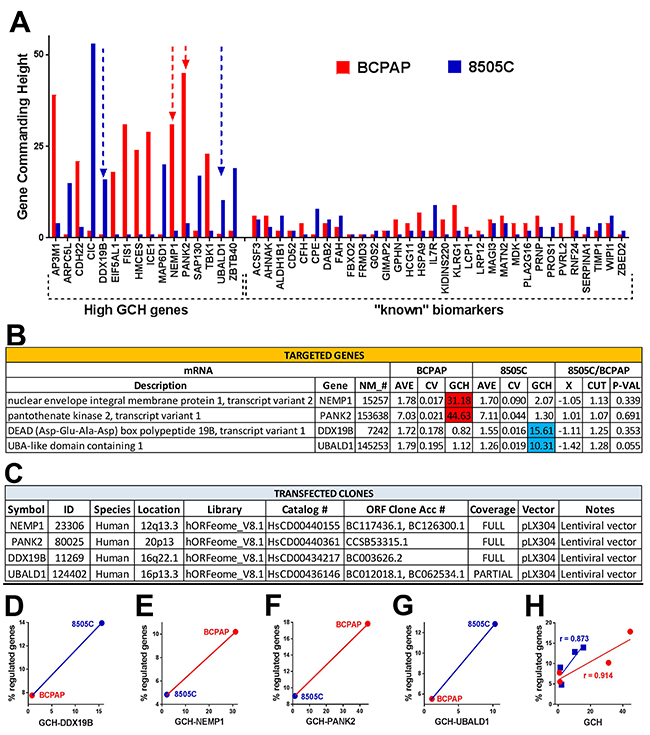
Figure 4: Validation of the gene commanding height (GCH) predictive value. (A) Examples of genes (including known TC biomarkers) with large GCH differences in the two cell lines. (B) Average expression level (AVE), coefficient of variation (CV) and GCH of the selected genes in the two cell lines before any transfection. X = expression ratio, CUT = absolute fold-change cut-off for significantly differentially expressed genes, P-VAL = p-value of the differential expression. (C) Characteristics of the transfected clones. In all transfections, we used the same lentiviral vector pLX304. (D-G) GCH vs % regulated genes for each transfection experiment. Note that always, higher GCH is associated with larger percentage of regulated genes. (H) GCH increases with GCH in each cell type. Strong positive Pearson product-momentum correlations (r = 0.914 for BCPAP and r = 0.873 for 8505C cells) were found between the GCH scores and the percentage of significantly regulated genes in both cell lines.
DISCUSSION
The main methodological contribution of our report is the introduction and validation of the Gene Commanding Height (GCH) as a new measure of how influential the expression of a gene is for the phenotypic expression of a cell. With this measure one can establish the gene hierarchy and identify the Gene Master Regulators (GMRs) of cancer nodules and unaffected surrounding tissue. Thus, GCH analysis opens a novel cancer gene-therapy avenue by selecting the targets with high differences in favor of the malign region from the affected tissue.
Owing to the cancer dependence on race, sex, age, genetic heritage, medical history, environmental and life-style associated risk factors, each patient most likely has a distinct and dynamic GMR-hierarchy. Therefore, an efficient gene-therapy should identify the targets separately for each individual. Manipulation of a GMR could complement current treatment options by making cancer cells more vulnerable and normal ones more resistant to chemo-/radiation therapy. It could also be used post-surgical removal of the tumor to reduce the probability of cancer recurrence.
GMRs are not biomarkers because biomarkers are the most alterable while GMRs are the most protected genes. GMRs are not selected as the most co-regulated with other genes in cancer vs. normal phenotypes because gene networks remodel in cancer and co-regulation does not necessarily mean gene interaction. Instead, GMRs are the most coordinately (synergistically or antagonistically) expressed with other genes in one phenotype at a time, dictating the transcriptomic stoichiometry [58] of gene networks.
In summary, we verified that cancer nodules and surrounding normal tissue are governed by different GMRs, and that manipulating the expression of a gene has larger effects on cells in which it has larger GCH.
MATERIALS AND METHODS
Patient sample
Four (2 – 6 mm3) samples were dissected from a frozen unilateral, single, 32.0 mm papillary carcinoma, pathological stage pT3NOMx (http://emedicine.medscape.com/article/2006643-overview) collected in 2010 from a 33y old woman. Four small pieces from the negative for malignancy resection margins of the same tumor were used as control. The study was approved by New York Medical College and Westchester Medical Center (WMC) Committees for Protection of Human Subjects, commonly known as Institutional Review Boards (IRBs) by L-11,606 (“Comprehensive molecular analysis of thyroid cancer: diagnosis, predictors of progression and targets for directed therapy”, PI RK Tiwari) and L-11,376 (“Quantifying cancer-associated remodeling of key genomic fabrics”, PI. DA Iacobas). The approval granted access to frozen cancer specimens from the WMC Pathology Archives and depersonalized pathology reports, waiving patient’s informed consent. Although the four samples dissected from each (malignant and malignant-free) region were chosen to be as homogeneous as possible cells of different phenotypes were not completely eliminated.
Cell lines
The predictive value of the GCH score was tested in papillary thyroid cancer cell line BCPAP and anaplastic thyroid cancer line 8505C, purchased from DSMZ in Braunschweig, Germany. Cell lines were cultured in Rosswell Park Memorial Institute (RPMI)-1640 supplemented with 10% fetal bovine serum (FBS), penicillin 10,000 IU/mL, streptomycin 10 mg/mL, and 2 mM L-glutamine. Validation of the cell lines was performed by the Genomics Core of the Albert Einstein College of Medicine (AECOM) of Yeshiva University (http://www.einstein.yu.edu/research/shared-facilities/cores/46/genomics/).
Gene transfection
The stable transfection was performed using plasmids in ORF lentiviral plX304 vector produced by the AECOM shRNA Core Facility with the characteristics indicated in Figure 4C.
Microarrays
We used our standard protocol [59] for extraction the total RNA, reverse transcription and fluorescent labeling, and hybridization with Agilent (here human) 4x44k two-color gene expression microarrays in the “multiple-yellow” design. Four biological replicas (cell culture dishes or tissue samples) were profiled from each phenotype/cell type subjected to each condition.
Data analysis
A gene was considered as differentially expressed between two types of samples if the absolute expression fold-change exceeded the combined effect of microarray noise and biological variability and the p-value of the means’ equality was below 0.05. All genes were assigned to functional pathways using Kyoto Encyclopedia of Genes and Genomes (http://www.genome.jp/kegg/pathway.html).
In previous papers (e.g.: [38, 60, 61]) we have used the Relative Expression Variability (REV = median of the Bonferroni-corrected chi-square interval estimate of the coefficient of variation) as a statistical estimate of the expression variability of one gene among biological replicas. Expression of individual genes depends on local conditions that, although similar, are not identical among biological replicas. We assume that expression of key genes is kept by the cellular homeostatic mechanisms within narrow intervals while that of nonkey genes is less restrained to readily adapt to environmental changes. REV may shift in pathological conditions, suggesting that control mechanisms are also affected. The expression variability allows computing the Pearson product-momentum correlation coefficient between the expression levels of any two genes in the same condition. Using the coordination analysis, we determined the transcriptomic networks (that may cross cell boundaries as shown in [62])
Gene commanding height
Gene Commanding Height (GCH) in sample α (= benign, malign, BCPAP, 8505C) was computed for each protein-coding and non-coding transcript in each of the four conditions as a combined measure of the gene expression stability and coordination with each other gene:
Author contributions
Conception and design: D. A. Iacobas, J Geliebter, R.K. Tiwari
Development of methodology: D. A. Iacobas, S Iacobas.
Acquisition of data (provided tissue, manage cell cultures, extract total RNA and performed microarray experiment, provided facilities, etc.): A. Moscatello, N.Y. Tuli, S. Iacobas, J.K. Rasamny, J. Geliebter J, R.K. Tiwari, D.A. Iacobas.
Analysis and interpretation of data (e.g., statistical analysis, biostatistics, computational analysis): D. A. Iacobas, S Iacobas, J. Geliebter J, R.K. Tiwari.
Writing, review, and/or revision of the manuscript: D. A. Iacobas, S Iacobas, J. Geliebter J, R.K. Tiwari.
Administrative, technical, or material support: A. Moscatello, D. A. Iacobas, J. Geliebter J, R.K. Tiwari P.
Study supervision: D. A. Iacobas, R.K. Tiwari J.
CONFLICTS OF INTEREST
The authors declare no potential conflicts of interest.
GRANT SUPPORT
The study was supported by NIH grant RO1CA131946-02 (RKT), clinical funds from Ear Nose and Throat (ENT) faculty practice (AM) and NYMC-Pathology grant (DAI).
REFERENCES
1. O’Neill JP, Shaha AR. Anaplastic thyroid cancer. Oral Oncol. 2013; 49:702–6.
2. Kondo T, Ezzat S, Asa SL. Pathogenetic mechanisms in thyroid follicular-cell neoplasia. Nat Rev Cancer. 2006; 6:292–306.
3. Mochizuki K, Kondo T, Nakazawa T, Iwashina M, Kawasaki T, Nakamura N, Yamane T, Murata S, Ito K, Kameyama K, Kobayashi M, Katoh R. RET rearrangements and BRAF mutation in undifferentiated thyroid carcinomas having papillary carcinoma components. Histopathology. 2010; 57:444–50.
4. Sugg SL, Ezzat S, Zheng L, Freeman JL, Rosen IB, Asa SL. Oncogene profile of papillary thyroid carcinoma. Surgery. 1999; 125:46–52.
5. Wreesmann VB, Ghossein RA, Patel SG, Harris CP, Schnaser EA, Shaha AR, Tuttle RM, Shah JP, Rao PH, Singh B. Genome-wide appraisal of thyroid cancer progression. Am J Pathol. 2002; 161:1549–56.
6. Rodrigues RF, Roque L, Rosa-Santos J, Cid O, Soares J. Chromosomal imbalances associated with anaplastic transformation of follicular thyroid carcinomas. Br J Cancer. 2004; 90:492–6.
7. Donghi R, Longoni A, Pilotti S, Michieli P, Della Porta G, Pierotti MA. Gene p53 mutations are restricted to poorly differentiated and undifferentiated carcinomas of the thyroid gland. J Clin Invest. 1993; 91:1753–60.
8. Dobashi Y, Sugimura H, Sakamoto A, Mernyei M, Mori M, Oyama T, Machinami R. Stepwise participation of p53 gene mutation during dedifferentiation of human thyroid carcinomas. Diagn Mol Pathol. 1994; 3:9–14.
9. Garcia-Rostan G, Camp RL, Herrero A, Carcangiu ML, Rimm DL, Tallini G. Beta-catenin dysregulation in thyroid neoplasms: down-regulation, aberrant nuclear expression, and ctnnb1 exon 3 mutations are markers for aggressive tumor phenotypes and poor prognosis. Am J Pathol. 2001; 158:987–96.
10. Garcia-Rostan G, Tallini G, Herrero A, D’Aquila TG, Carcangiu ML, Rimm DL. Frequent mutation and nuclear localization of beta-catenin in anaplastic thyroid carcinoma. Cancer Res. 1999; 59:1811–5.
11. Gibelli B, El-Fattah A, Giugliano G, Proh M, Grosso E. Thyroid stem cells--danger or resource? Acta Otorhinolaryngol Ital. 2009; 29:290–5.
12. Zhang P, Zuo H, Ozaki T, Nakagomi N, Kakudo K. Cancer stem cell hypothesis in thyroid cancer. Pathol Int. 2006; 56:485–9.
13. Takano T, Amino N. Fetal cell carcinogenesis: a new hypothesis for better understanding of thyroid carcinoma. Thyroid. 2005; 15:432–8.
14. Nikiforova MN, Nikiforov YE. Molecular diagnostics and predictors in thyroid cancer. Thyroid. 2009; 19:1351–61.
15. Armstrong MJ, Yang H, Yip L, Ohori NP, McCoy KL, Stang MT, Hodak SP, Nikiforova MN, Carty SE, Nikiforov YE. PAX8/PPARγ rearrangement in thyroid nodules predicts follicular-pattern carcinomas, in particular the encapsulated follicular variant of papillary carcinoma. Thyroid. 2014; 24:1369–74.
16. Kroll TG, Sarraf P, Pecciarini L, Chen CJ, Mueller E, Spiegelman BM, Fletcher JA. PAX8-ppargamma1 fusion oncogene in human thyroid carcinoma [corrected]. Science. 2000; 289:1357–60.
17. Xing M. Molecular pathogenesis and mechanisms of thyroid cancer. Nat Rev Cancer. 2013; 13:184–99.
18. Kreso A, Dick JE. Evolution of the cancer stem cell model. Cell Stem Cell. 2014; 14:275–91.
19. Klonisch T, Hoang-Vu C, Hombach-Klonisch S. Thyroid stem cells and cancer. Thyroid. 2009; 19:1303–15.
20. Ma R, Bonnefond S, Morshed SA, Latif R, Davies TF. Stemness is derived from thyroid cancer cells. Front Endocrinol (Lausanne). 2014; 5:114.
21. Plaks V, Kong N, Werb Z. The cancer stem cell niche: how essential is the niche in regulating stemness of tumor cells? Cell Stem Cell. 2015; 16:225–38.
22. Marjanovic ND, Weinberg RA, Chaffer CL. Cell plasticity and heterogeneity in cancer. Clin Chem. 2013; 59:168–79.
23. Uhlen M, Zhang C, Lee S, Sjöstedt E, Fagerberg L, Bidkhori G, Benfeitas R, Arif M, Liu Z, Edfors F, Sanli K, von Feilitzen K, Oksvold P, et al. A pathology atlas of the human cancer transcriptome. Science. 2017.
24. Kummer NT, Nowicki TS, Azzi JP, Reyes I, Iacob C, Xie S, Swati I, Darzynkiewicz Z, Gotlinger KH, Suslina N, Schantz S, Tiwari RK, Geliebter J. Arachidonate 5 lipoxygenase expression in papillary thyroid carcinoma promotes invasion via MMP-9 induction. J Cell Biochem. 2012; 113:1998–2008.
25. Rajoria S, Suriano R, George AL, Kamat A, Schantz SP, Geliebter J, Tiwari RK. Molecular target based combinational therapeutic approaches in thyroid cancer. J Transl Med. 2012; 10:81.
26. Hanly EK, Rajoria S, Darzynkiewicz Z, Zhao H, Suriano R, Tuli N, George AL, Bednarczyk R, Shin EJ, Geliebter J, Tiwari RK. Disruption of mutated braf signaling modulates thyroid cancer phenotype. BMC Res Notes. 2014; 7:187.
27. Hanly EK, Bednarczyk RB, Tuli NY, Moscatello AL, Halicka HD, Li J, Geliebter J, Darzynkiewicz Z, Tiwari RK. mTOR inhibitors sensitize thyroid cancer cells to cytotoxic effect of vemurafenib. Oncotarget. 2015; 6:39702–13. https://doi.org/10.18632/oncotarget.4052
28. Hanly EK, Tuli NY, Bednarczyk RB, Suriano R, Geliebter J, Moscatello AL, Darzynkiewicz Z, Tiwari RK. Hyperactive ERK and persistent mTOR signaling characterize vemurafenib resistance in papillary thyroid cancer cells. Oncotarget. 2016; 7:8676–87. https://doi.org/10.18632/oncotarget.6779.
29. Kamat A, Rajoria S, George A, Suriano R, Shanmugam A, Megwalu U, Prakash PB, Tiwari R, Schantz S. Estrogen-mediated angiogenesis in thyroid tumor microenvironment is mediated through VEGF signaling pathways. Arch Otolaryngol Head Neck Surg. 2011; 137:1146–53.
30. Rajoria S, Suriano R, George A, Shanmugam A, Schantz SP, Geliebter J, Tiwari RK. Estrogen induced metastatic modulators MMP-2 and MMP-9 are targets of 3,3’-diindolylmethane in thyroid cancer. PLoS One. 2011; 6:e15879.
31. Rajoria S, Suriano R, George AL, Shanmugam A, Jussim C, Shin EJ, Moscatello AL, Geliebter J, Carpi A, Tiwari RK. Estrogen activity as a preventive and therapeutic target in thyroid cancer. Biomed Pharmacother. 2012; 66:151–8.
32. Rajoria S, Hanly E, Nicolini A, George AL, Geliebter J, Shin EJ, Suriano R, Carpi A, Tiwari RK. Interlinking of hypoxia and estrogen in thyroid cancer progression. Curr Med Chem. 2014; 21:1351–60. Review.
33. Penna GC, Vaisman F, Vaisman M, Sobrinho-Simões M, Soares P. Molecular markers involved in tumorigenesis of thyroid carcinoma: focus on aggressive histotypes. Cytogenet Genome Res. 2016; 150:194–207.
34. Asa SL. The evolution of differentiated thyroid cancer. Pathology. 2017; 49:229–37.
35. Moran B, Rahman A, Palonen K, Lanigan FT, Gallagher WM. Master transcriptional regulators in cancer: discovery via reverse engineering approaches and subsequent validation. Cancer Res. 2017; 77:2186–90.
36. Chen JC, Alvarez MJ, Talos F, Dhruv H, Rieckhof GE, Iyer A, Diefes KL, Aldape K, Berens M, Shen MM, Califano A. Identification of causal genetic drivers of human disease through systems-level analysis of regulatory networks. Cell. 2014; 159:402–14.
37. Liu ZP. Reverse engineering of genome-wide gene regulatory networks from gene expression data. Curr Genomics. 2015; 16:3–22.
38. Iacobas DA. The genomic fabric perspective on the transcriptome between universal quantifiers and personalized genomic medicine. Biol Theory. 2016; 11:123–37.
39. Iacobas S, Thomas NM, Iacobas DA. Plasticity of the myelination genomic fabric. Mol Genet Genomics. 2012; 287:237–46.
40. Iacobas DA, Iacobas S. Towards a personalized cancer gene therapy: a case of clear cell renal cell carcinoma. Cancer Oncol Res. 2017; 5:45–52.
41. Fabien N, Fusco A, Santoro M, Barbier Y, Dubois PM, Paulin C. Description of a human papillary thyroid-carcinoma cell-line. Morphologic study and expression of tumoral markers. Cancer. 1994; 73:2206–12.
42. Ito T, Seyama T, Hayashi Y, Hayashi T, Dohi K, Mizuno T, Iwamoto K, Tsuyama N, Nakamura N, Akiyama M. Establishment of 2 human thyroid-carcinoma cell-lines (8305c, 8505c) bearing p53 gene-mutations. Int J Oncol. 1994; 4:583–6.
43. Brazma A, Hingamp P, Quackenbush J, Sherlock G, Spellman P, Stoeckert C, Aach J, Ansorge W, Ball CA, Causton HC, Gaasterland T, Glenisson P, Holstege FC, et al. Minimum information about a microarray experiment (MIAME)-toward standards for microarray data. Nat Genet. 2001; 29:365–71.
44. Wu XY, Liu WT, Wu ZF, Chen C, Liu JY, Wu GN, Yao XQ, Liu FK, Li G. Identification of HRAS as cancer-promoting gene in gastric carcinoma cell aggressiveness. Am J Cancer Res. 2016; 6:1935–48.
45. Bai S, Feng Q, Pan XY, Zou H, Chen HB, Wang P, Zhou XL, Hong YL, Song SL, Yang JL. Overexpression of wild-type p21Ras plays a prominent role in colorectal cancer. Int J Mol Med. 2017; 39:861–8.
46. Manzella L, Stella S, Pennisi MS, Tirrò E, Massimino M, Romano C, Puma A, Tavarelli M, Vigneri P. New insights in thyroid cancer and p53 family proteins. Int J Mol Sci. 2017.
47. Woodward EL, Biloglav A, Ravi N, Yang M, Ekblad L, Wennerberg J, Paulsson K. Genomic complexity and targeted genes in anaplastic thyroid cancer cell lines. Endocr Relat Cancer. 2017; 24:209–20.
48. Alexander EK, Kennedy GC, Baloch ZW, Cibas ES, Chudova D, Diggans J, Friedman L, Kloos RT, LiVolsi VA, Mandel SJ, Raab SS, Rosai J, Steward DL, et al. Preoperative diagnosis of benign thyroid nodules with indeterminate cytology. N Engl J Med. 2012; 367:705–15.
49. Si X, Zang R, Zhang E, Liu Y, Shi X, Zhang E, Shao L, Li A, Yang N, Han X, Pan B, Zhang Z, Sun L, et al. LncRNA H19 confers chemoresistance in ERα-positive breast cancer through epigenetic silencing of the pro-apoptotic gene bik. Oncotarget. 2016; 7:81452–62. https://doi.org/10.18632/oncotarget.13263.
50. Nishimura N, Van Huyen Pham T, Hartomo TB, Lee MJ, Hasegawa D, Takeda H, Kawasaki K, Kosaka Y, Yamamoto T, Morikawa S, Yamamoto N, Kubokawa I, Mori T, et al. Rab15 expression correlates with retinoic acid-induced differentiation of neuroblastoma cells. Oncol Rep. 2011; 26:145–51.
51. Papp S, Asa SL. When thyroid carcinoma goes bad: a morphological and molecular analysis. Head Neck Pathol. 2015; 9:16–23.
52. Lin SF, Lin JD, Hsueh C, Chou TC, Wong RJ. A cyclin-dependent kinase inhibitor, dinaciclib in preclinical treatment models of thyroid cancer. PLoS One. 2017; 12:e0172315.
53. Enomoto K, Zhu X, Park S, Zhao L, Zhu YJ, Willingham MC, Qi J, Copland JA, Meltzer P, Cheng SY. Targeting MYC as a therapeutic intervention for anaplastic thyroid cancer. J Clin Endocrinol Metab. 2017; 102:2268–80.
54. Guida T, Salvatore G, Faviana P, Giannini R, Garcia-Rostan G, Provitera L, Basolo F, Fusco A, Carlomagno F, Santoro M. Mitogenic effects of the up-regulation of minichromosome maintenance proteins in anaplastic thyroid carcinoma. J Clin Endocrinol Metab. 2005; 90:4703–9.
55. Miotto B, Ji Z, Struhl K. Selectivity of ORC binding sites and the relation to replication timing, fragile sites, and deletions in cancers. Proc Natl Acad Sci U S A. 2016; 113:E4810–9.
56. Handkiewicz-Junak D, Swierniak M, Rusinek D, Oczko-Wojciechowska M, Dom G, Maenhaut C, Unger K, Detours V, Bogdanova T, Thomas G, Likhtarov I, Jaksik R, Kowalska M, et al. Gene signature of the post-chernobyl papillary thyroid cancer. Eur J Nucl Med Mol Imaging. 2016; 43:1267–77.
57. Yoshida A, Goto K, Kodaira M, Kobayashi E, Kawamoto H, Mori T, Yoshimoto S, Endo O, Kodama N, Kushima R, Hiraoka N, Motoi T, Kawai A. CIC-rearranged sarcomas: a study of 20 cases and comparisons with ewing sarcomas. Am J Surg Pathol. 2016; 40:313–23.
58. Iacobas DA, Iacobas S, Spray DC. Connexin43 and the brain transcriptome of the newborn mice. Genomics. 2007; 89:113–23.
59. Lee PR, Cohen JE, Iacobas DA, Iacobas S, Fields RD. Gene-regulatory networks activated by pattern-specific generation of action potentials in dorsal root ganglia neurons. Sci Rep. 2017; 7:43765.
60. Iacobas DA, Urban M, Iacobas S, Scemes E, Spray DC. Array analysis of gene. Expression in connexin43 null astrocytes. Physiol Genomics. 2003; 15:177–90.
61. Iacobas DA, Fan C, Iacobas S, Spray DC, Haddad GG. Transcriptomic changes in developing kidney exposed to chronic hypoxia. Biochem Biophys Res Commun. 2006; 349:329–38.
62. Iacobas DA, Iacobas S, Spray DC. Connexin-dependent transcellular transcriptomic networks in mouse brain. Prog Biophys Mol Biol. 2007; 94:168–84. Review.