
INTRODUCTION
Liver cirrhosis often requires liver transplantation for treatment, as the main cause of mortality along with chronic liver disease. The low survival rate of decompensated cirrhotic people has driven research for good prognostic markers [1]. In patients with liver cirrhosis, renal function has important prognostic impact along with hepatic function [2]. Furthermore, Advanced CKD in liver cirrhosis associated with proceeding to end stage renal disease (ESRD) even after liver transplantation [3]. The most virulent sequence of cirrhosis is hepatorenal syndrome (HRS), identified by an acute or subacute progression in kidney function [4].
CKD is a notorious health issue in Taiwan with high prevalence (11.93%), yet low awareness (3.54%) of the condition [5]. However, only few researches had investigated CKD prevalence in Taiwan cirrhosis patients, and more research needs to be conducted. In a general population, the CKD Epidemiology Collaboration (CKD-EPI) equation [6] is a better estimate of measured glomerular filtration rate (GFR) at higher GFR levels than the Modification of Diet in Renal Disease (MDRD) Study equation. However, the GFR calculated by the 6-variable MDRD equation may be closer to the true GFR than that calculated by the CKD-EPI equation in liver cirrhosis [7]. Prevalence of CKD within cirrhosis of one Taiwan medical center was analyzed via three different equations of estimated GFR (eGFR).
Gathering evidence points that CKD, especially ESRD, including that after kidney transplantation and hemodialysis therapy initiation, is associated with newly diagnosed diabetes, [8–10]. However, no data is currently available on the prevalence of CKD and diabetes in outpatients with cirrhosis.
This study aimed to provide a comprehensive analysis of CKD prevalence and diabetes in a large cohort of outpatients with cirrhosis. The relationship between CKD and diabetes mellitus(DM) in cirrhosis patients is also discussed.
RESULTS
Baseline characteristics of the cirrhotic cohort
For the included 7,440 eligible enrolled patients, demographic, laboratory, and clinical data were collected between August 2000 and April, 2010. Mean age was 62.8±14.3 years (Table 1). Of the total cohort, 67.5% was male. Among the etiology of cirrhosis, viral hepatitis was 42.3%, alcoholic was 37.6%, alcoholic with viral hepatitis was 12.3% and cryptogenic was 7.8%. The severities of liver disease according to the CTP classification were as follows: Child class A was 34.2%, Child B was 57.7% and Child C was 8.1%. The median (interquarter range) of MELD score was 20 (19) and 16 (16) in DM and non-DM respectively. Three estimated glomerular filtration equation were compared: highest one CKD-EPI median (interquarter range): 65.0 (62.9), 78.0 (53.6) and lowest one MDRD-6: 51.0 (52.2), 60.5 (46.9) mL/min/1.73 m2 in DM and non-DM respectively.
Table 1: Baseline characteristics and parameter of the pooled and matched cohort
Pooled cohort |
Matched cohort |
|||||
|---|---|---|---|---|---|---|
Characteristics |
DM |
Non-DM |
p value |
DM |
Non-DM |
p value |
Age (years) |
66 (19) |
64 (16) |
<0.001 |
66 (19) |
66 (19) |
0.342 |
Male N (%) |
1,216 (61.8) |
3,809 (69.6) |
1,216 (61.8) |
1,216 (61.8) |
||
Female N (%) |
751 (38.2) |
1,664 (30.4) |
751 (38.2) |
751 (38.2) |
||
HCV N (%) |
470(23.9) |
1110 (20.3) |
470(23.9) |
437(22.2) |
||
Proteinuria N (%) |
1337(68) |
2298(42) |
1337(68) |
768(39) |
||
Hypertension |
1624(82.6) |
3683(67.3) |
1624(82.6) |
1368(69.5) |
||
Ammonia (μg/dL) |
56(13) |
43(11) |
<0.001 |
56(13) |
48(12) |
<0.001 |
BMI (Kg/m2) |
27.6(3) |
23.5(3) |
<0.001 |
27.4(3) |
23.5(3) |
<0.001 |
FPG (mg/dL) |
130 (82) |
103 (58) |
<0.001 |
130 (82) |
105 (66) |
<0.001 |
Hb (g/dL) |
10.7 (4) |
11.2 (4) |
<0.001 |
10.4 (3.5) |
11.8 (3.7) |
<0.001 |
Platelet (103/uL) |
114 (100) |
121 (112) |
0.005 |
116 (104) |
135 (97) |
<0.001 |
AST (IU/L) |
54 (70) |
51 (62) |
0.013 |
49 (57) |
42 (39) |
<0.001 |
ALT (IU/L) |
33 (36) |
33 (34) |
0.929 |
32 (32) |
31 (29) |
0.566 |
Albumin (g/dL) |
54 (70) |
51 (62) |
<0.001 |
2.9 (1.0) |
3.3 (1.0) |
<0.001 |
Total bilirubin (mg/dL) |
3 (1.2) |
3.1 (1.2) |
<0.001 |
2.5 (2) |
1.3 (1) |
<0.001 |
Alk-Phosphate (IU/L) |
98 (72) |
94 (70) |
0.018 |
100 (71) |
87 (57) |
<0.001 |
Uric Acid (mg/dL) |
6.2 (3.1) |
6.0 (2.9) |
0.001 |
6.3 (3.3) |
5.6 (2.6) |
<0.001 |
BUN (mg/dL) |
18 (30) |
15 (17) |
<0.001 |
24 (36) |
12 (8) |
<0.001 |
Cr (mg/dL) |
1.1 (1.2) |
1.0 (0.6) |
<0.001 |
1.3 (1.5) |
0.8 (0.3) |
<0.001 |
Cholesterol (mg/dL) |
143 (70) |
143 (69) |
0.745 |
146 (69) |
146 (63) |
0.092 |
TG (mg/dL) |
88 (62) |
88 (64) |
0.631 |
95 (73) |
91 (72) |
0.823 |
Sodium (mg/dL) |
137 (6) |
138 (6) |
0.168 |
137 (6) |
138 (5) |
0.039 |
Potassium (mg/dL) |
4.0 (1.0) |
4.0 (0.9) |
0.144 |
4.1 (0.9) |
4.0 (0.7) |
<0.001 |
Chloride (mg/dL) |
105 (9) |
105 (8) |
0.733 |
105 (9) |
106 (8) |
0.019 |
INR |
1.25 (0.51) |
1.22 (0.45) |
<0.001 |
1.24 (0.51) |
1.14 (0.27) |
<0.001 |
MELD score |
20 (19) |
16 (16) |
<0.001 |
20 (19) |
9 (6) |
<0.001 |
CTP score |
7 (2) |
7 (2) |
<0.001 |
7 (2) |
7 (1) |
<0.001 |
MDRD-4 (ml/min) |
62.4 (58.4) |
73.2 (54.5) |
<0.001 |
62.4 (58.4) |
85.5 (27) |
<0.001 |
MDRD-6 (ml/min) |
51.0 (52.2) |
60.5 (46.9) |
<0.001 |
51 (52.2) |
70.5 (23.4) |
<0.001 |
CKD-EPI (ml/min) |
65.0 (62.9) |
78.0 (53.6) |
<0.001 |
65 (62.9) |
88.2 (20.8) |
<0.001 |
Categorical data were presented as number(%), continuous data were expressed as median and interquartile range. The Mann-Whitney test and chi-square test were used.
Abbreviation: FPG, fasting plasma glucose; Hb, hemoglobin; AST, aspartate amino transferase; ALT, alanine amino transferase; BUN, blood urea nitrogen; Cr, creatinine; TG, triglyceride.
INR, international normalized ratio; CTP, Child-Turcott-Pugh; MELD, Model for End-Stage Liver Disease; INR, international normalized ratio; MDRD, Modification of Diet in Renal Disease; CKD-EPI, Chronic Kidney Disease Epidemiology Collaboration.
Of 7,440 pooled cohort, 1,967 (35.9%) had diabetes (Table 1). In matched cohort, Median and interquartile range of fasting blood glucose level was 103 (58) mg/dL for nondiabetic and 105 (66) mg/dL for diabetic participants (p<0.001). In diabetic group, there are lower hemoglobin, platelet count, albumin, lower estimated glomerular rate in three different equations. Higher AST, total bilirubin, alkaline phosphatase, uric acid, blood urea nitrogen (BUN), creatinine, potassium, international normalized ratio (INR) and MELD score and CTP score was significantly noted in diabetes matched group.
Prevalence of diabetics in different CKD stage compared by three eGFR equations
The prevalence of diabetics in non-CKD and different CKD stages was listed in Table 2 and compared with three different eGFR equations. For people known as having CKD, diabetes prevalence distinctly increased (34.9%, MDRD-6; 30.6%, MDRD-4; 30.5%, CKD-EPI equation). In CKD patients, diabetes had higher prevalence rate using MDRD-6 compared other two equations which had similar results. In Non-CKD patients, diabetes had lower prevalence in MRDR6 compared other two equations (22.5% versus 23%). In CKD cohort, the trend of diabetes prevalence was increased from CKD stage 1 to stage 5. The prevalence was highest in CKD stage 1 and 2 using CKD-EPI and highest in CKD stage 3~5 when using MDRD-4 equation (Figure 1).
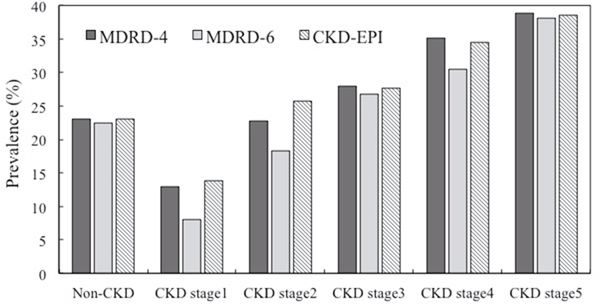
Figure 1: Prevalence of different CKD stage in MDRD-4, MRDR-6, and CKD-EPI Estimating GFR (eGFR) Equations.
Table 2: Prevalence of diabetes in different CKD stage in MDRD-4, MDRD-6, and CKD-EPI estimating GFR equations
Non- CKD |
All CKD |
CKD stage 1 |
CKD stage 2 |
CKD stage 3 |
CKD stage 4 |
CKD stage 5 |
|
|---|---|---|---|---|---|---|---|
MDRD-4 equation |
p<0.001 |
||||||
Total N (%) |
4,044 |
3,396 (45.6%) |
70 |
400 |
1,580 |
709 |
637 |
Diabetics |
929 |
1,038 |
9 |
91 |
442 |
249 |
247 |
Diabetics (%) |
23.0% |
30.6% |
12.9% |
22.8% |
28.0% |
35.1% |
38.8% |
MDRD-6 equation |
p<0.001 |
||||||
Total |
4,004 |
3,421 (46.0%) |
37 |
109 |
2,075 |
855 |
928 |
Diabetics |
770 |
1,194 |
3 |
20 |
556 |
261 |
354 |
Diabetics (%) |
22.5% |
34.9% |
8.1% |
18.3% |
26.8% |
30.5% |
38.1% |
CKD-EPI equation |
p<0.001 |
||||||
Total |
4,040 |
3,400 (45.7%) |
94 |
489 |
1,461 |
682 |
674 |
Diabetics |
928 |
1,039 |
13 |
126 |
405 |
235 |
260 |
Diabetics (%) |
23.0% |
30.5% |
13.8% |
25.8% |
27.7% |
34.5% |
38.6% |
Statistical comparison was performed with One-way analysis of variance
Abbreviations: CKD, chronic kidney disease; CKD-EPI, Chronic Kidney Disease Epidemiology Collaboration; MDRD, Modification of Diet in Renal Disease; MELD, Model for End-Stage Liver Disease; CTP, Child-Turcott-Pugh.
Prevalence of diabetics in different group MELD score and CTP classification
Prevalence of diabetes in different group MELD and CTP classification were calculated. MELD group 4 had highest prevalence rate of 31% and group 2 had lowest prevalence rate 23%. The prevalence was increased in trend from CTP class A to C (A:22.3%, B:27.4%, and C:37.4%) (Figure 2). The prevalence of diabetes increased from mild (CTP class B) to severe (CTP class C) in the cirrhosis group, as shown in Table 3. A higher prevalence rate of advanced CKD with increased severity of MELD scores was also observed (Table 4).
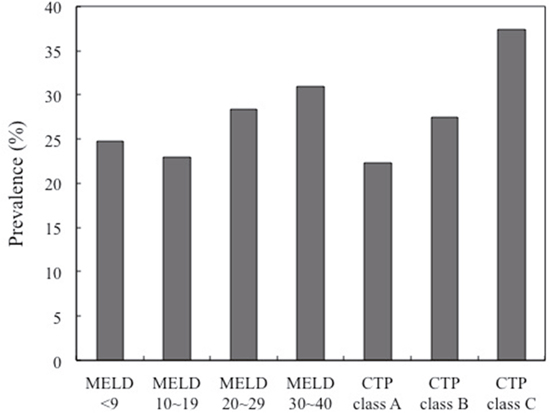
Figure 2: Prevalence of diabetics in different group MELD score and CTP classification.
Table 3: Prevalence of diabetics in different group MELD score and CTP classification
MELD |
Group 1 |
Group 2 |
Group 3 |
Group 4 |
p for trend |
|---|---|---|---|---|---|
Total |
2,015 |
1,989 |
1,986 |
1,450 |
p<0.001 |
Diabetics |
497 |
458 |
562 |
450 |
|
Diabetics (%) |
24.7% |
23.0% |
28.3% |
31.0% |
|
CTP class |
Class A |
Class B |
Class C |
||
Total |
2,547 |
4,291 |
602 |
p<0.001 |
|
Diabetics |
567 |
1,175 |
225 |
||
Diabetics (%) |
22.3% |
27.4% |
37.4% |
Statistical comparison was performed with One-way analysis of variance.
Abbreviations: MELD, Model for End-Stage Liver Disease; CTP, Child-Turcott-Pugh.
Table 4: Prevalence of CKD Stage with different group divided as MELD score (Group 1: MELD <9; Group 2: MELD 10~19; Group 3: MELD 20~29; Group 4: MELD 30~40)
Characteristics |
Group 1 n=2,015 |
Group 2 n=1,989 |
Group 3 n=1,986 |
Group 4 n=1,450 |
|---|---|---|---|---|
MELD score |
7.6±1.1 |
13.3±3.0 |
23.3±2.7 |
38.6±6.0 |
MDRD-4 equation ( percentage % and number) |
||||
CKD stage 1 |
1.1% (23) |
1.2% (23) |
0.6% (12) |
0.8% (12) |
CKD stage 2 |
3.8% (77) |
5.3% (106) |
8.1% (160) |
3.9% (57) |
CKD stage 3 |
5.7% (114) |
9.6% (191) |
41.6% (826) |
31.0% (449) |
CKD stage 4 |
0.6% (12) |
1.5% (30) |
12.4% (247) |
29.0% (420) |
CKD stage 5 |
0.4% (8) |
1.0% (20) |
11.0% (218) |
27.0% (391) |
MDRD-6 equation |
||||
CKD stage 1 |
0.4% (9) |
0.6% (11) |
0.4% (7) |
0.7% (10) |
CKD stage 2 |
1.8% (37) |
1.9% (37) |
1.4% (27) |
0.6% (8) |
CKD stage 3 |
18.7% (376) |
21.8% (433) |
46.5% (923) |
23.9% (343) |
CKD stage 4 |
0.6% (13) |
2.3% (46) |
19.1% (378) |
29.1% (418) |
CKD stage 5 |
0.6% (13) |
1.5% (29) |
15.7% (311) |
40.0% (575) |
CKD-EPI equation |
||||
CKD stage 1 |
1.4% (29) |
1.6% (32) |
0.9% (17) |
1.1% (16) |
CKD stage 2 |
4.7% (94) |
6.4% (127) |
10.2% (203) |
4.5% (65) |
CKD stage 3 |
4.6% (93) |
8.2% (164) |
38.9% (773) |
29.7% (431) |
CKD stage 4 |
0.5% (10) |
1.4% (27) |
12.2% (243) |
27.7% (402) |
CKD stage 5 |
0.4% (9) |
1.0% (20) |
11.5% (228) |
28.8% (417) |
Abbreviations: CKD, chronic kidney disease; CKD-EPI, Chronic Kidney Disease Epidemiology Collaboration; MDRD, Modification of Diet in Renal Disease; MELD, Model for End-Stage Liver Disease; CTP, Child-Turcott-Pugh.
Prevalence of different CKD stage in different MELD score compared by three different eGFR equations
The severity of cirrhosis was assessed using MELD score and MELD score was calculated for every participant by
[MELD score = 9.6 × loge (creatinine mg/dL) + 3.8 × loge (bilirubin mg/dL) + 11.20 × loge (INR) + 6.4]
Participants were distributed into five groups accordingly.
Group I included of 5 participants with MELD score <9.
Group II included of 40 participants with MELD score = 10–19.
Group III included of 31 participants with MELD score = 20–29.
Group IV consisted of 19 patients with MELD score = 30–40.
Among the cirrhotic patient with CKD, CKD stage 3 had highest prevalence in all four groups. CKD prevalence increased in trend from group 1 to 4. Noticeably the prevalence rates of CKD stage 4 and 5 were increased in trend with the severity of cirrhosis in three different eGFR equations.
Using adjusted logistic regression model, age, female, CKD stage 4 and 5, obesity, proteinuria, HCV, hypertension, CVD and CTP class B and C had significantly higher odds for diabetes in three eGFR equations (Table 5).
Table 5: Logistic regression for diabetics in pooled cohorts
Characteristics |
Adjusted modela |
Adjusted modelb |
Adjusted modelc |
|---|---|---|---|
Equation |
MDRD-4 |
MDRD-6 |
CKD-EPI |
Non-CKD |
1.00 (reference) |
1.00 (reference) |
1.00 (reference) |
CKD stage 1 |
0.66 (0.30-1.45) |
0.48 (0.13-1.75) |
0.62 (0.30-1.27) |
CKD stage 2 |
0.92 (0.68-1.24) |
0.58 (0.30-1.05) |
1.10 (0.90-1.41) |
CKD stage 3 |
1.13 (0.92-1.39) |
1.11 (0.92-1.31) |
1.12 (0.93-1.33) |
CKD stage 4 |
1.61 (1.25-2.11) |
1.23 (1.03-1.44) |
1.53 (1.16-2.01) |
CKD stage 5 |
1.73 (1.31-2.26) |
1.78 (1.44-2.12) |
1.63 (1.24-2.15) |
Age (per 10-yr increment) |
1.11 (1.06-1.16) |
1.11 (1.06-1.16) |
1.11 (1.06-1.16) |
Sex (reference:women) |
0.85 (0.75-0.97) |
0.85 (0.75-0.97) |
0.85 (0.75-0.97) |
Obesityd |
1.74 (1.51-1.99) |
1.74 (1.51-1.99) |
1.74 (1.51-1.99) |
Proteinuria |
1.67(1.34-1.98) |
1.67(1.34-1.98) |
1.67(1.34-1.98) |
HCV |
2.03(1.78-2.28) |
2.03(1.78-2.28) |
2.03(1.78-2.28) |
Hypertension |
1.32(1.13-1.52) |
1.32(1.13-1.52) |
1.32(1.13-1.52) |
Cardiovascular disease |
1.29 (1.12-1.48) |
1.29 (1.12-1.48) |
1.29 (1.12-1.48) |
Dyslipidemiae |
1.06 (0.89-1.24) |
1.06 (0.89-1.24) |
1.06 (0.89-1.24) |
Hemoglobin |
1.02 (0.98-1.06) |
1.02 (0.98-1.06) |
1.02 (0.98-1.06) |
Albumin |
0.91 (0.80-1.03) |
0.91 (0.80-1.03) |
0.91 (0.80-1.03) |
Uric acid |
1.03(0.97-1.09) |
1.03(0.97-1.09) |
1.03(0.97-1.09) |
Ammonia |
1.21(0.96-1.48) |
1.21(0.96-1.48) |
1.21(0.96-1.48) |
CTP class A |
1.00 (reference) |
1.00 (reference) |
1.00 (reference) |
CTP class B |
1.23 (1.10-1.46) |
1.23 (1.10-1.47) |
1.23 (1.10-1.47) |
CTP class C |
1.45 (1.19-1.82) |
1.48 (1.22-1.86) |
1.47 (1.20-1.84) |
Note: Values shown are odds ratio (95% confidence interval). Logistic regression, dependent variable diabetes/no diabetes; diabetes defined as self-reported, using medication, fasting glucose level >126 mg/dL, or nonfasting glucose level >200 mg/dL.
Abbreviations: OR, odds ratio; CI, confidence interval; CKD, chronic kidney disease; CKD-EPI, Chronic Kidney Disease Epidemiology Collaboration; MDRD, Modification of Diet in Renal Disease; MELD, Model for End-Stage Liver Disease; CTP, Child-Turcott-Pugh. Adjusted model for age, sex, Obesity, proteinuia, HCV, hypertension, CVD, dyslipidemia, hemoglobin, albumin, uric acid, ammonia and CTP class.
aMDRD-4 Study equation. bMDRD-6 Study equation. cCKD-EPI equation.dBody mass index >30 kg/m2. eDyslipidemia defined as cholesterol level >200 mg/dL or triglyceride level >150 mg/dL.
In conditional logistic regression model, Using model 1 (MDRD-4), compared with the non-CKD participants, ORs for diabetes in CKD were: stage 1, 6.73 (95% CI, 1.27-47.4.); stage 2, 2.06 (95% CI, 1.26-3.35); stage 3~5, 8.51 (95% CI, 5.63-11.4). Using model 2 (MDRD-6), compared with the non-CKD participants, ORs for diabetes in CKD were: stage 1, 2.06 (95% CI, 0.24-16.2); stage 2, 1.31 (95% CI, 0.40-3.35); stage 3~5, 2.34 (95% CI, 1.78-3.01). Using model 3 (CKD-EPI), compared with the non-CKD participants, ORs for diabetes in CKD were: stage 1, 2.74 (95% CI, 0.67-9.2); stage 2, 2.56 (95% CI, 1.45-4.21); stage 3~5, 8.61(95% CI, 5.13-13.9) (Table 6).
Table 6: Conditional logistic regression for diabetics in matched cohorts
Characteristics |
Adjusted modela |
Adjusted modelb |
Adjusted modelc |
|---|---|---|---|
Equation |
MDRD-4 |
MDRD-6 |
CKD-EPI |
Non-CKD |
1.00 (reference) |
1.00 (reference) |
1.00 (reference) |
CKD stage 1 |
6.73 (1.27-47.4) |
2.06 (0.24-16.2) |
2.74 (0.67-9.2) |
CKD stage 2 |
2.06 (1.26-3.35) |
1.31 (0.45-3.35) |
2.56 (1.45-4.21) |
CKD stage 3~5 |
8.51 (5.63-11.4) |
2.34 (1.78-3.01) |
8.61 (5.13-13.9) |
CTP class A |
1.00 (reference) |
1.00 (reference) |
1.00 (reference) |
CTP class B |
1.46 (1.18-1.82) |
1.44 (1.16-1.80) |
1.47 (1.19-1.83) |
CTP class C |
2.33 (1.44-3.86) |
2.64(1.63-4.22) |
2.27 (1.35-3.78) |
Abbreviations: OR, odds ratio; CI, confidence interval; CKD, chronic kidney disease; CKD-EPI, Chronic Kidney Disease Epidemiology Collaboration; MDRD, Modification of Diet in Renal Disease. CTP, Child-Turcott-Pugh.
Adjusted model for age, sex, obesity, proteinuia, HCV, hypertension, CVD, dyslipidemia, hemoglobin, albumin, uric acid, ammonia and CTP class.
aMDRD-4 Study equation. bMDRD-6 Study equation. cCKD-EPI equation.
DISCUSSION
Using the MELD score, previous studies have shown that besides being a marker of liver function, serum creatinine(SCr) is useful in determining the prognosis of cirrhosis [11, 12]. Independent of hypo-perfusion and ischemia, cirrhotic popupation often have comorbidities that may cause CKD. In our analysis, eGFR was the lowest when calculated using the MDRD-6 equation, perhaps indicating a higher CKD prevalence rate. MDRD-6 equation is considered the best parameters in cirrhotic people, possibly because BUN and albumin levels are incorporates [13, 14]. Accumulating researches showed higher prevalence of DM in higher stage CKD [8, 9] and our data show a similar trend of increase in diabetes prevalence in cirrhosis patients as that seen in CKD patients, and across stages using the three different equations.
Cirrhotic patients are at risk for developing DM, mainly those with HCV [15] which in line with our result. Patients with cirrhosis and diabetes had poor outcome and higher risk for developing hepatocellular carcinoma than non-DM cirrhosis patients [16, 17]. The prevalence of diabetes increased from mild to severe in the cirrhosis group, as shown in Table 3. Chronic viral hepatitis and cirrhosis are identified to increased the risk of DM [18]. So-called “hepatogenous diabetes (HD)” is the mechanisms associated with insulin resistance and β-cell dysfunction that acquired with cirrhosis deterioration [19]. Perseghin et al. [20] found lessening insulin resistance and recovery HD in 67% of cirrhotic-diabetic patients after liver transplantation. Impaired removal of insulin by the injury liver and porto-systemic shunts make hyperinsulinemia in cirrhotic patient. It is exacerbated by increases in glucagon, growth hormone, insulin-like growth factor, free fatty acids, and cytokines [17, 21]. Liver cirrhosis characterized by a striking peripheral insulin resistance, and DM happened when the beta cells unable to recompense for the secretory performance [22–24]. Our data illustrated that increasing severity of cirrhosis significantly increased the risk of diabetes according to CTP classification (Tables 5 and 6). One study results showed that impairment of insulin secretion, but not of insulin sensitivity, associated with severity of cirrhosis, as evaluated by CTP score, which independently predicted β-cell dysfunction [25]. Clinical characteristics of HD differed from that of hereditary type 2 DM for less frequently related to retinopathy, cardiovascular and renal complications [26]. Prevention of HD is crucial in clinical practice for cirrhosis patient.
The MELD score incorporated creatinine, and we found a higher prevalence rate of advanced CKD with increased severity of MELD scores (Table 4). A retrospective study by Choi et al. [27]that investigated renal dysfunction, concluded that renal derangement in cirrhosis is not uncommon. Chronic viral hepatitis and cirrhosis frequently cause glomerular injury [28]. Besides, hypo-perfusion is a central mechanism in most patients with advanced cirrhosis and HRS also cause renal function deterioration [29]. Noticeably, the prevalence rate of higher stage CKD (stage 4 and 5) in the MDRD-6 equation was higher than that using the other equations (Table 4). Since the MDRD-6 equation was better than other equations in identifying cirrhosis patients with true GFR<30 mL/min/1.73 m2 [14], overestimating renal function using inappropriate eGFR equation was an important issue needed more attention.
Results indicate a higher OR of diabetes in CKD stage 4 and 5 parcipitants after multivariable adjustment.(Table 5). The results are essential since hyperglycemia in CKD people is related with a ominous process regarding morbidity and mortality [8, 30, 31]. Earlier detection of DM and strictly treat for CVD risk factors cant be ignored in reducing the CVD burden and preventing CKD deterioration [32].
We found increased risk of diabetes seen in CKD stage 3~5 using age- and sex-matched conditional logistic regression, adjusted for age, sex, Obesity, proteinuria, HCV, hypertension, CVD, dyslipidemia, hemoglobin, albumin, uric acid, ammonia and CTP class.(Table 6). Non-traditional risk factors for diabetes, including accumulated cytokines, oxidative stress; micro-albuminuria; insulin resistance; and endothelial malfunction were increased in higher stage CKD [33]. Traditional risk factors include aging, sex, ethnicity and obesity for diabetes were worsened after initiation of dialysis. Several studies in line with our finding that chronic inflammation is not uncommon in hemodialysis participants and it may tend to insulin resistance [34–36]. Besides, uremia related beta-cell virulence is also believed as a non-traditional risk factor for diabetes occurrence. However, two studies found controversial results that in lower eGFR or CKD, beta cell was suitably strengthening and risks of diabetes incidence were not significantly changed [37, 38].
The leading cause of mortality is hepatic failure among diabetic patients with cirrhosis [41, 42]. Bad glycemic management exist at cirrhosis diagnosis increased cirrhosis mortality and morbidity [43]. Our study suggests that prevented CKD progression and strictly cirrhosis treatment (albumin, ascites, hepatic encephalopathy, and coagulopathy correction) are important for managing cirrhosis, and perhaps more importantly, before diabetes development.
Our study was not without limitations. Using data from a single center, our analyses were cross-sectional and retrospective observational study. The relationship between the higher CKD stage and higher prevalence of diabetes is clear independent of eGFR equations, but the causal relationship cannot be determined by the findings of the study, because of the nature of a cross-sectional analysis. Analysis of data from larger multicenter patient clinics can discern observational biases and record errors that can arise within the current study. Yet, we use a detailed patient database permitted uniform evaluation and management for CKD and cirrhosis. Only patients who attended health evaluation and were aware of their condition were included, minimizing self-report limitations.
Furthermore, cirrhosis patients tend to have falsely low SCr levels due to decreases in hepatic creatinine synthesis and skeletal muscle mass. Factors that might increase the prevalence of DM in CKD participants include inflammatory and oxidative stress biomarkers, which were not measured and might therefore be confounding factors. Therefore, there may be some bias in underestimating the true prevalence and associated clinical manifestations of CKD may be underestimated.
A selection bias for patients whose data was in the pooled database could also have occurred. Studies on larger representative populations will overcome this limitation. Further investigations should take these factors into account, and a validation in translating such data into more robust longitudinal outcomes may also be warranted.
In conclusion, the present study suggests that CKD stages 3~5 defined by MDRD-4, MDRD-6 and CKD-EPI eGFR equations, are significantly and positively associated with diabetes. More severe cirrhosis in CTP classification also increased the risk for diabetes. Prospective cohort studies and clinical trials are required to further evaluate the causal relationship. New concepts on HD, the DM–HCV relationship, and clinical significance of DM in cirrhosis patients, also need to be confirmed with a large randomized control study.
MATERIALS AND METHODS
Study population and data collection
This is a retrospective cross section study that included consecutive, adult, cirrhotic patients from August 2001 to April 2010. The protocol was approved by the institutional review board of Mackay Memorial Hospital (IRB approval number: 10MMHIS172) and informed consent was waived. In addition to laboratory test features of hepatic dysfunction and the existence of major complications of liver cirrhosis, such as ascites, hepatic encephalopathy and gastroesophageal varices, were examined. The diagnosis of liver cirrhosis was either confirmed by liver biopsy or based on a combination of laboratory, endoscopic, and clinical features of portal hypertension together with compatible imaging findings (CT scan or ultrasound) or histological findings. We collected data as classified by the International Classification of Diseases, 9th revision (ICD-9) of “5712”, “5715”, “5716” from four branch of one medical center in Taiwan. For these 12,899 patients, patients with incomplete data with respect to renal function, age <18 years old were excluded; thus, a total of 7,440 patients was included in the study. The baseline characteristics documented on the subjects included age, gender, etiology of liver disease. Laboratory measures of liver function, renal function and electrolytes were obtained.
Selection of cases and controls
Among the enrolled cohort, we used case control matching with age difference within three years, sex and presence of diabetics or not. Totally, we obtained 1,967 matched pairs (Figure 3). The severity of liver disease was calculated from Child-Turcott-Pugh (CTP) and MELD scores. Data on the etiology of the liver disease including viral and alcoholic causes were historically and serologically collected. The etiology of cirrhosis was defined to be chronic hepatitis B virus infection with long-standing (>6 months) HBsAg positivity; chronic hepatitis C virus (HCV) infection with detectable both antibodies against HCV (anti-HCV) and serum HCV-RNA. All patients who were classified as having alcoholic cirrhosis had ingested >80 g daily of alcohol for a decade or more.
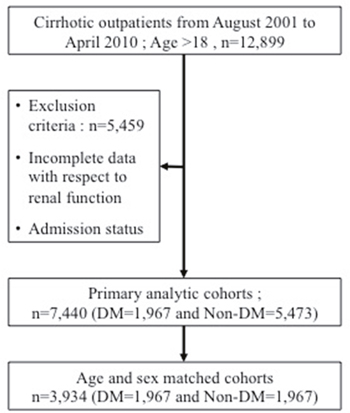
Figure 3: Flowchart of selection of study population.
Based on the admission data, each patient had the CTP score (range: 5-15) and Child class calculated according to the suggestion by Pugh et al. [44], while the MELD score (range: 6-40) was calculated according to the formula proposed by Kamath et al. [2], which was a slight modification of the risk score used in the original TIPS model [45].
Estimation of GFR
Serum creatinine (SCr) was measured by the isotope dilution mass spectrometry (IDMS)-traceable enzymatic method in a Roche Cobas Integra 400 at the Mackay Memorial Hospital. GFR was estimated using by three different equations including the 4-and 6-variable MDRD Study [46, 47], the Chronic Kidney Disease Epidemiology Collaboration creatinine (2009) CKD-EPI [6]equation.
We calculated eGFR using the IDMS-traceable 4-variable MDRD Study equation [46]: eGFR MDRD :175 × Scr1.154 × age-0.203 × (0.742 if female), 6 variable MDRD = 170 × Scr-0.999 × age-0.176 × (0.762 if patient is female) × (BUN)-0.170 × (Albumin)0.318 and also using the CKD-EPI equation: 141 × min (SCr/k, 1)α × max (SCr/k, 1)-1.209 × 0.993Age × 1.018 [if female], where k is 0.7 for female and 0.9 for male, α is -0.329 for female and -0.411 for male, min indicates the minimum of SCr/k or 1, and max indicates the maximum of SCr/k or 1.
Definition
CKD was defined by either a low eGFR (<60 ml/min per 1.73 m2) or the presence of albuminuria based on spot urine samples using sex-specific cut offs [48]. CKD stages were defined according to clinical practice guidelines developed under the National Kidney Foundation’s Kidney Disease Outcomes Quality Initiative (KDOQI). Diabetes was defined as a history of diabetes (self-report or retinopathy), fasting blood glucose level >126 mg/dL, or nonfasting blood glucose level >200 mg/dL in the absence of self-report or medication use, use of medications to treat diabetes. CVD history was defined as self-reported history of heart attack, heart angioplasty, heart failure, bypass surgery, abnormal heart rhythm, or stroke. Dyslipidemia was defined as total cholesterol level >200 mg/dL or triglyceride level >150 mg/dL. Obesity, defined as BMI >30 kg/m2. Proteinuria defined as a dipstick urinalysis score of 1+ or greater (equivalent to≥30 mg/dL) or Urine rotein-to-creatinine ratio ≥ 150 mg/mg or urine albumin-to-creatinine ratio (ACR) ≥30 mg/g.
Statistical analysis
To test differences in characteristics between participants with and without diabetes, we used mean and standard deviation for normally distributed [median and interquartile range for non-normally distributed] continuous variables, N (%) for categorical variables. The Mann-Whitney U test and chi-square test were used because of the existence of outliers, high variability, and skewed distributions. One-way analysis of variance was used to test differences in continuous variables between participants of different groups. We used logistic regression, expressed as odds ratio (OR) and 95% confidence interval (CI), to describe the association of CKD stages and other clinical characteristics with diabetes (dependent variable). Separate models were constructed using MDRD-4, MDRD-6 and CKD-EPI for eGFR and adjusted model for age, sex, dyslipidemia, CVD, hemoglobin, albumin, and uric acid.
We performed conditional logistic regression for matched group, expressed as odds ratio (OR) and 95% confidence interval (CI), to describe the association of CKD stage 1, stage 2 and CKD stage 3~5 with diabetes compared to non-CKD group. Adjusted model 1 used the MDRD-4 equation to define CKD; adjusted model 2 used the MDRD-6 equation; adjusted model 3 used the CKD-EPI equation. We used the conventional p<0.05 for statistical significance in this study. All statistical analyses were performed using SPSS software (version 17.0, SPSS Inc., Chicago, IL, USA).
ACKNOWLEDGMENTS AND GRANT SUPPORT
This work was supported by the Mackay Memorial Hospital and partly supported by the grant of MOST 104-2313-B-009 -001-MY3 from the Ministry of Science and Technology (MOST), Taiwan. The authors thank the staffs in the Information Management Section at Mackay Memorial Hospital for their clinical data providing and Fang-Ju Sun for advising statistical analyses.
CONFLICTS OF INTEREST
The authors declare that they have no potential conflicts of interest relevant to this article.
REFERENCES
1. Forman LM, Lucey MR. Predicting the prognosis of chronic liver disease: an evolution from child to MELD. Mayo End-stage Liver Disease. Hepatology. 2001; 33: 473-5.
2. Kamath PS, Wiesner RH, Malinchoc M, Kremers W, Therneau TM, Kosberg CL, D'Amico G, Dickson ER, Kim WR. A model to predict survival in patients with end-stage liver disease. Hepatology. 2001; 33: 464-70.
3. Francoz C, Glotz D, Moreau R, Durand F. The evaluation of renal function and disease in patients with cirrhosis. J Hepatol. 2010; 52: 605-13.
4. Alessandria C, Ozdogan O, Guevara M, Restuccia T, Jimenez W, Arroyo V, Rodes J, Gines P. MELD score and clinical type predict prognosis in hepatorenal syndrome: relevance to liver transplantation. Hepatology. 2005; 41: 1282-9.
5. Hsu CC, Hwang SJ, Wen CP, Chang HY, Chen T, Shiu RS, Horng SS, Chang YK, Yang WC. High prevalence and low awareness of CKD in Taiwan: a study on the relationship between serum creatinine and awareness from a nationally representative survey. Am J Kidney Dis. 2006; 48: 727-38.
6. Levey AS, Stevens LA, Schmid CH, Zhang YL, Castro AF 3rd, Feldman HI, Kusek JW, Eggers P, Van Lente F, Greene T, Coresh J, Ckd EPI. A new equation to estimate glomerular filtration rate. Ann Intern Med. 2009; 150: 604-12.
7. Chen YW, Chen HH, Wang TE, Chang CW, Chang CW, Wu CJ. Difference between CKD-EPI and MDRD equations in calculating glomerular filtration rate in patients with cirrhosis. World J Gastroenterol. 2011; 17: 4532-8.
8. Salifu MO, Abbott KC, Aytug S, Hayat A, Haria DM, Shah S, Friedman EA, Delano BG, McFarlane SI, Hurst FP, Flom PL, Jindal RM. New-onset diabetes after hemodialysis initiation: impact on survival. Am J Nephrol. 2010; 31: 239-46.
9. Chadban S. New-onset diabetes after transplantation--should it be a factor in choosing an immunosuppressant regimen for kidney transplant recipients. Nephrol Dial Transplant. 2008; 23: 1816-8.
10. Porrini E, Delgado P, Alvarez A, Cobo M, Perez L, Gonzalez-Posada JM, Hortal L, Gallego R, Garcia JJ, Checa M, Morales A, Salido E, Hernandez D, et al. The combined effect of pre-transplant triglyceride levels and the type of calcineurin inhibitor in predicting the risk of new onset diabetes after renal transplantation. Nephrol Dial Transplant. 2008; 23: 1436-41.
11. Wiesner R, Edwards E, Freeman R, Harper A, Kim R, Kamath P, Kremers W, Lake J, Howard T, Merion RM, Wolfe RA, Krom R, United Network for Organ Sharing Liver Disease Severity Score C. Model for end-stage liver disease (MELD) and allocation of donor livers. Gastroenterology. 2003; 124: 91-6.
12. Sharma P, Schaubel DE, Sima CS, Merion RM, Lok AS. Re-weighting the model for end-stage liver disease score components. Gastroenterology. 2008; 135: 1575-81.
13. Myers GL, Miller WG, Coresh J, Fleming J, Greenberg N, Greene T, Hostetter T, Levey AS, Panteghini M, Welch M, Eckfeldt JH, National Kidney Disease Education Program Laboratory Working G. Recommendations for improving serum creatinine measurement: a report from the Laboratory Working Group of the National Kidney Disease Education Program. Clin Chem. 2006; 52: 5-18.
14. Francoz C, Nadim MK, Baron A, Prie D, Antoine C, Belghiti J, Valla D, Moreau R, Durand F. Glomerular filtration rate equations for liver-kidney transplantation in patients with cirrhosis: validation of current recommendations. Hepatology. 2014; 59: 1514-21.
15. Antonelli A, Ferrari SM, Giuggioli D, Di Domenicantonio A, Ruffilli I, Corrado A, Fabiani S, Marchi S, Ferri C, Ferrannini E, Fallahi P. Hepatitis C virus infection and type 1 and type 2 diabetes mellitus. World J Diabetes. 2014; 5: 586-600.
16. Hickman IJ, Macdonald GA. Impact of diabetes on the severity of liver disease. Am J Med. 2007; 120: 829-34.
17. El-Serag HB, Tran T, Everhart JE. Diabetes increases the risk of chronic liver disease and hepatocellular carcinoma. Gastroenterology. 2004; 126: 460-8.
18. Veldt BJ, Chen W, Heathcote EJ, Wedemeyer H, Reichen J, Hofmann WP, de Knegt RJ, Zeuzem S, Manns MP, Hansen BE, Schalm SW, Janssen HL. Increased risk of hepatocellular carcinoma among patients with hepatitis C cirrhosis and diabetes mellitus. Hepatology. 2008; 47: 1856-62.
19. Garcia-Compean D, Jaquez-Quintana JO, Gonzalez-Gonzalez JA, Maldonado-Garza H. Liver cirrhosis and diabetes: risk factors, pathophysiology, clinical implications and management. World J Gastroenterol. 2009; 15: 280-8.
20. Perseghin G, Mazzaferro V, Sereni LP, Regalia E, Benedini S, Bazzigaluppi E, Pulvirenti A, Leao AA, Calori G, Romito R, Baratti D, Luzi L. Contribution of reduced insulin sensitivity and secretion to the pathogenesis of hepatogenous diabetes: effect of liver transplantation. Hepatology. 2000; 31: 694-703.
21. Tappy L, Minehira K. New data and new concepts on the role of the liver in glucose homeostasis. Curr Opin Clin Nutr Metab Care. 2001; 4: 273-7.
22. Jeon HK, Kim MY, Baik SK, Park HJ, Choi H, Park SY, Kim BR, Hong JH, Jo KW, Shin SY, Kim JM, Kim JW, Kim HS, et al. Hepatogenous diabetes in cirrhosis is related to portal pressure and variceal hemorrhage. Dig Dis Sci. 2013; 58: 3335-41.
23. Pallayova M, Wilson V, John R, Taheri S. Liver transplantation: a potential cure for hepatogenous diabetes? Diabetes Care. 2013; 36: e97.
24. Gundling F, Schepp W, Schumm-Draeger PM. Hepatogenous diabetes in cirrhosis: academic sport or a neglected disease? Exp Clin Endocrinol Diabetes. 2012; 120: 469-71.
25. Grancini V, Trombetta M, Lunati ME, Zimbalatti D, Boselli ML, Gatti S, Donato MF, Resi V, D'Ambrosio R, Aghemo A, Pugliese G, Bonadonna RC, Orsi E. Contribution of beta-cell dysfunction and insulin resistance to cirrhosis-associated diabetes: Role of severity of liver disease. J Hepatol. 2015; 63: 1484-90.
26. Kwon SY, Kim SS, Kwon OS, Kwon KA, Chung MG, Park DK, Kim YS, Koo YS, Kim YK, Choi DJ, Kim JH. Prognostic significance of glycaemic control in patients with HBV and HCV-related cirrhosis and diabetes mellitus. Diabet Med. 2005; 22: 1530-5.
27. Choi YJ, Kim JH, Koo JK, Lee CI, Lee JY, Yang JH, Ko SY, Choe WH, Kwon SY, Lee CH. Prevalence of renal dysfunction in patients with cirrhosis according to ADQI-IAC working party proposal. Clin Mol Hepatol. 2014; 20: 185-91.
28. Amet S, Bronowicki JP, Thabut D, Zoulim F, Bourliere M, Mathurin P, de Ledinghen V, Benhamou Y, Larrey DG, Janus N, Deray G, Launay-Vacher V, Pol S. Prevalence of renal abnormalities in chronic HBV infection: the HARPE study. Liver Int. 2015; 35: 148-55.
29. Durand F, Graupera I, Gines P, Olson JC, Nadim MK. Pathogenesis of hepatorenal syndrome: implications for therapy. Am J Kidney Dis. 2016; 67: 318-28.
30. McCullough PA, Li S, Jurkovitz CT, Stevens LA, Wang C, Collins AJ, Chen SC, Norris KC, McFarlane SI, Johnson B, Shlipak MG, Obialo CI, Brown WW, et al. CKD and cardiovascular disease in screened high-risk volunteer and general populations: the Kidney Early Evaluation Program (KEEP) and National Health and Nutrition Examination Survey (NHANES) 1999-2004. Am J Kidney Dis. 2008; 51: S38-45.
31. Whaley-Connell A, Pavey BS, McCullough PA, Saab G, Li S, McFarlane SI, Chen SC, Vassalotti JA, Collins AJ, Bakris G, Sowers JR, Investigators K. Dysglycemia predicts cardiovascular and kidney disease in the Kidney Early Evaluation Program. J Clin Hypertens (Greenwich). 2010; 12: 51-8.
32. McCullough PA, Verrill TA. Cardiorenal interaction: appropriate treatment of cardiovascular risk factors to improve outcomes in chronic kidney disease. Postgrad Med. 2010; 122: 25-34.
33. McFarlane SI, Banerji M, Sowers JR. Insulin resistance and cardiovascular disease. J Clin Endocrinol Metab. 2001; 86: 713-8.
34. Stenvinkel P, Alvestrand A. Inflammation in end-stage renal disease: sources, consequences, and therapy. Semin Dial. 2002; 15: 329-37.
35. Locatelli F, Canaud B, Eckardt KU, Stenvinkel P, Wanner C, Zoccali C. Oxidative stress in end-stage renal disease: an emerging threat to patient outcome. Nephrol Dial Transplant. 2003; 18: 1272-80.
36. Spittle MA, Hoenich NA, Handelman GJ, Adhikarla R, Homel P, Levin NW. Oxidative stress and inflammation in hemodialysis patients. Am J Kidney Dis. 2001; 38: 1408-13.
37. Nichols GA, Moler EJ. Cardiovascular disease, heart failure, chronic kidney disease and depression independently increase the risk of incident diabetes. Diabetologia. 2011; 54: 523-6.
38. Pham H, Robinson-Cohen C, Biggs ML, Ix JH, Mukamal KJ, Fried LF, Kestenbaum B, Siscovick DS, de Boer IH. Chronic kidney disease, insulin resistance, and incident diabetes in older adults. Clin J Am Soc Nephrol. 2012; 7: 588-94.
39. Hanai K, Babazono T, Nyumura I, Toya K, Ohta M, Bouchi R, Suzuki K, Inoue A, Iwamoto Y. Involvement of visceral fat in the pathogenesis of albuminuria in patients with type 2 diabetes with early stage of nephropathy. Clin Exp Nephrol. 2010; 14: 132-6.
40. Suliman ME, Yilmaz MI, Carrero JJ, Qureshi AR, Saglam M, Ipcioglu OM, Yenicesu M, Tong M, Heimburger O, Barany P, Alvestrand A, Lindholm B, Stenvinkel P. Novel links between the long pentraxin 3, endothelial dysfunction, and albuminuria in early and advanced chronic kidney disease. Clin J Am Soc Nephrol. 2008; 3: 976-85.
41. El-Serag HB, Everhart JE. Diabetes increases the risk of acute hepatic failure. Gastroenterology. 2002; 122: 1822-8.
42. Nishida T, Tsuji S, Tsujii M, Arimitsu S, Haruna Y, Imano E, Suzuki M, Kanda T, Kawano S, Hiramatsu N, Hayashi N, Hori M. Oral glucose tolerance test predicts prognosis of patients with liver cirrhosis. Am J Gastroenterol. 2006; 101: 70-5.
43. Hsiang JC, Gane EJ, Bai WW, Gerred SJ. Type 2 diabetes: a risk factor for liver mortality and complications in hepatitis B cirrhosis patients. J Gastroenterol Hepatol. 2015; 30: 591-9.
44. Pugh RN, Murray-Lyon IM, Dawson JL, Pietroni MC, Williams R. Transection of the oesophagus for bleeding oesophageal varices. Br J Surg. 1973; 60: 646-9.
45. Malinchoc M, Kamath PS, Gordon FD, Peine CJ, Rank J, ter Borg PC. A model to predict poor survival in patients undergoing transjugular intrahepatic portosystemic shunts. Hepatology. 2000; 31: 864-71.
46. Levey AS, Bosch JP, Lewis JB, Greene T, Rogers N, Roth D. A more accurate method to estimate glomerular filtration rate from serum creatinine: a new prediction equation. Modification of Diet in Renal Disease Study Group. Ann Intern Med. 1999; 130: 461-70.
47. Levey AS, Coresh J, Greene T, Stevens LA, Zhang YL, Hendriksen S, Kusek JW, Van Lente F; Chronic Kidney Disease Epidemiology Colloboration. Using standardized serum creatinine values in the modification of diet in renal disease study equation for estimating glomerular filtration rate. Ann Intern Med. 2006; 145: 247-54.
48. Mattix HJ, Hsu CY, Shaykevich S, Curhan G. Use of the albumin/creatinine ratio to detect microalbuminuria: implications of sex and race. J Am Soc Nephrol. 2002; 13: 1034-9.