
INTRODUCTION
Tobacco use, primarily associated with cigarette smoking, is a worldwide risk factor of public health. Cigarette smoke (CS) contains over 7000 toxicants, most of which are etiological factors in the development of inflammatory pulmonary diseases. Chronic CS exposure causes damage to lung resident cells such as airway epitheliums, leading to the release of pro-inflammatory cytokines and the recruit of neutrophils, contributing to airway remodeling and subsequent airflow limitation which has been identified as the prominent feature of chronic obstructive pulmonary disease (COPD) or other CS-related airway inflammatory disorders [1, 2]. However, previous studies found that neutrophilic airway inflammation already occurred upon short-term CS exposure in susceptible mice and humans [3, 4], indicating that genetic or epigenetic factors may play a role in the susceptibility to CS-induced airway inflammation.
Long non-coding RNAs (lncRNAs), as a class of non-coding RNAs (ncRNAs), is generally defined as transcripts of greater than 200 nucleotides. As previously considered unfunctional, lncRNAs are now believed to be involved in various biologic processes, including inflammation, oxidative stress, cell growth and apoptosis at both transcriptional and posttranscriptional levels [5–7]. Several studies demonstrated the function of lncRNAs in the development of pulmonary disorders related to CS. In human bronchial epithelial cells (HBEs), the lncRNA, Hox transcript antisense intergenic RNA (HOTAIR), was found to be correlated with cigarette smoke extract (CSE)-induced changes in cell cycle, while the knockdown of cancer-associated lncRNA-1 (SCAL1) in HBEs showed a significant potentiation of the cytotoxicity induced by CSE [8]. Besides, hundreds of differentially expressed lncRNAs were found in the lung tissues of healthy smokers compared with those in non-smokers [9], indicating that CS exposure may regulate the expression of lncRNAs, leading to the development of CS-induced lung disorders. However, genetics regarding to lncRNAs underlying the susceptibility to CS-induced airway inflammation remains limited.
Our previous research, which described a CS-exposed mouse model system, found that four-week CS-exposed mice could recapitulate the morphological and functional changes of human chronic airway inflammation, including increased levels of pro-inflammatory cytokines and inflammatory cell counts in bronchoalveolar lavage fluid (BALF), thickening of the airway epithelium, and peribronchial inflammatory cell infiltration [10]. Based on this model, in the present study, we aimed to profile the expressions of lncRNAs and mRNAs in the lung tissues of CS-exposed mice by microarray analysis.
RESULTS
LncRNA and mRNA expression profile
As shown in Figure 1, 108 lncRNAs (Figure 1a) and 119 mRNAs (Figure 1b) were detected with significantly differential expression levels in CS-exposed mouse lung tissue when comparing with controls (fold-change >2.0; P < 0.05). Among these lncRNAs, AK020757 (fold-change: 39.25, P = 8.97E-07) and AK085915 (fold-change: 3.99, P = 0.0032) were the most up- and down-regulated lncRNAs in CS-exposed mice, respectively. While for mRNAs, Gm12429 (fold change: 18.26, P = 1.59E-08) and apelin receptor (Aplnr) (fold change: 2.97, P = 0.0023) were the most up- and down-expressed, respectively. The top 20 differentially expressed lncRNAs and mRNAs identified by microarray analysis are listed in Tables 1 and 2, respectively.
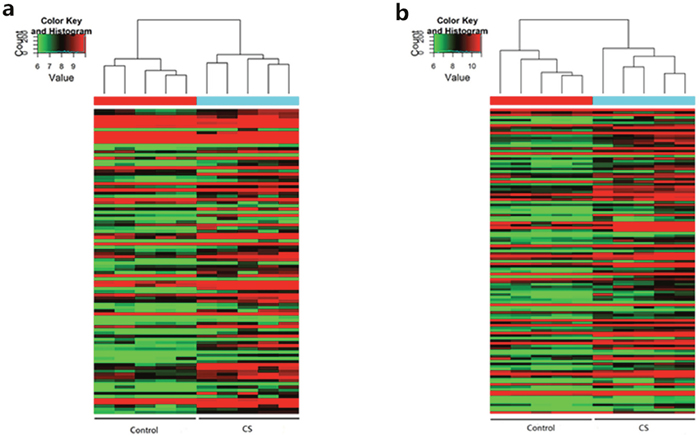
Figure 1: Heat maps showing the distinct lncRNA (a) and mRNA (b) expression profiles between CS-exposed mice and control mice. Notes: Hierarchical clustering of significantly (P < 0.05, >2-fold change) regulated lncRNAs (a) and mRNAs (b) are shown as heat maps. Expression values are represented with different colors ranged from green to red, indicating low relative expression to high relative expression, respectively. (n=5 for control group and CS-exposed group, respectively). CS: cigarette smoke-exposed group.
Table 1: The detailed information of the top 10 up-regulated and top 10 down-regulated lncRNAs
lncRNA name |
Regulation direction |
Normalized intensity |
Fold change |
P-value |
|
|---|---|---|---|---|---|
CON group |
CS group |
||||
AK020757 |
up |
4.93±0.71 |
10.23±0.52 |
39.25 |
8.97E-07 |
AK047207 |
up |
7.49±0.61 |
12.51±0.34 |
32.43 |
2.21E-07 |
uc029vco.1 |
up |
3.63±1.00 |
7.86±0.66 |
18.72 |
4.87E-05 |
uc007pgi.1 |
up |
10.57±0.98 |
14.63±1.40 |
16.68 |
0.0007 |
uc029slj.1 |
up |
3.63±0.69 |
7.29±0.54 |
12.60 |
1.47E-05 |
AK076311 |
up |
6.25±0.08 |
9.30±0.59 |
8.32 |
3.19E-06 |
ENSMUST00000107991 |
up |
6.12±0.83 |
9.13±0.44 |
8.04 |
9.70E-05 |
uc029usn.1 |
up |
9.00±0.49 |
12.00±0.48 |
8.01 |
5.04E-06 |
ENSMUST00000178906 |
up |
9.41±0.46 |
12.38±0.48 |
7.85 |
8.27E-06 |
uc007coi.2 |
up |
3.49±0.50 |
6.17±0.95 |
6.45 |
0.0005 |
AK085915 |
down |
8.39±0.49 |
6.39±0.96 |
3.99 |
0.0032 |
TCONS_00004206 |
down |
12.29±0.35 |
10.48±0.95 |
3.50 |
0.0041 |
ENSMUST00000144634 |
down |
9.27±0.35 |
7.58±1.10 |
3.23 |
0.0113 |
ENSMUST00000181247 |
down |
11.69±0.53 |
10.26±0.53 |
2.69 |
0.0027 |
ENSMUST00000145428 |
down |
5.77±0.37 |
4.45±0.93 |
2.49 |
0.0187 |
ENSMUST00000155715 |
down |
10.34±0.28 |
9.04±0.84 |
2.47 |
0.0111 |
NR_045048 |
down |
12.22±0.21 |
10.98±0.46 |
2.35 |
0.0006 |
ENSMUST00000151765 |
down |
6.48±0.99 |
5.28±0.53 |
2.29 |
0.0449 |
TCONS_00015067 |
down |
6.15±0.52 |
4.98±0.51 |
2.25 |
0.0071 |
NR_037693 |
down |
6.95±0.48 |
5.78±1.01 |
2.25 |
0.0472 |
The name, regulation direction, normalized intensity, fold change and p-value of the top 10 up-regulated and top 10 down-regulated lncRNAs between cigarette smoke-exposed mice and controls, for the normalized intensity, data were presented with mean± standard deviation. CON: control; CS: cigarette smoke.
Table 2: The detailed information of the top 10 up-regulated and top 10 down-regulated mRNAs
Gene symbol |
Description |
Regulation direction |
Normalized intensity |
Fold change |
P-value |
|
|---|---|---|---|---|---|---|
CON |
CS |
|||||
Gm12429 |
Predicted gene 12429 |
up |
3.01±0.17 |
7.20±0.38 |
18.26 |
1.59E-08 |
Igj |
Immunoglobulin joining chain |
up |
7.84±0.94 |
11.53±1.09 |
12.90 |
0.0004 |
Camp |
Cathelicidin antimicrobial peptide |
up |
11.22±1.65 |
14.86±0.89 |
12.47 |
0.0024 |
1700112E06Rik |
RIKEN cDNA 1700112E06 gene |
up |
7.82±0.54 |
11.12±0.50 |
9.83 |
8.03E-06 |
Cxcl9 |
Chemokine (C-X-C motif) ligand 9 |
up |
4.15±0.83 |
7.35±1.55 |
9.23 |
0.0036 |
Fcnb |
Ficolin B |
up |
4.27±1.60 |
7.41±0.92 |
8.81 |
0.0052 |
S100a9 |
S100 calcium binding protein A9 |
up |
7.46±0.74 |
10.42±1.03 |
7.78 |
0.0008 |
Cd177 |
CD177 antigen |
up |
7.72±1.19 |
10.66±0.35 |
7.68 |
0.0007 |
Gm5416 |
Predicted gene 5416 |
up |
4.90±0.85 |
7.68±0.83 |
6.88 |
0.0008 |
4933402N22Rik |
RIKEN cDNA 4933402N22 gene |
up |
6.64±0.48 |
9.25±0.97 |
6.09 |
0.0007 |
Aplnr |
Apelin receptor |
down |
9.44±0.27 |
7.87±0.75 |
2.97 |
0.0023 |
Vmn2r122 |
Vomeronasal 2, receptor, 122 |
down |
6.11±0.35 |
4.63±0.56 |
2.79 |
0.0010 |
Fabp1 |
Fatty acid binding protein 1, liver |
down |
13.13±0.29 |
11.69±0.46 |
2.71 |
0.0004 |
Sprr1a |
Small proline-rich protein 1A |
down |
11.25±0.67 |
9.88±0.67 |
2.58 |
0.0122 |
Heph |
Hephaestin |
down |
5.45±0.74 |
4.11±1.04 |
2.54 |
0.0468 |
Slurp1 |
Secreted Ly6/Plaur domain containing 1 |
down |
11.25±0.54 |
9.96±0.69 |
2.44 |
0.0112 |
Fbn2 |
Fibrillin 2 |
down |
9.20±0.49 |
7.99±0.50 |
2.32 |
0.0047 |
Tet1 |
Tet methylcytosine dioxygenase 1 |
down |
5.49±0.52 |
4.29±0.83 |
2.31 |
0.0251 |
Tet1 |
Tet methylcytosine dioxygenase 1 |
down |
10.94±0.34 |
9.78±0.61 |
2.23 |
0.0059 |
Egfbp2 |
Epidermal growth factor binding protein type B |
down |
10.69±0.38 |
9.57±0.40 |
2.16 |
0.0020 |
The Gene symbol, description, regulation direction, normalized intensity, fold change and p-value of the top 10 up-regulated and top 10 down-regulated mRNAs between cigarette smoke-exposed mice and controls, for the normalized intensity, data were presented with mean± standard deviation. CON: control; CS: cigarette smoke.
qRT-PCR validation
To validate the reliability of the microarray results and determine the role of lncRNAs in CS-exposed mice, 8 differentially expressed lncRNAs were randomly selected and analyzed by quantification real-time PCR (qRT-PCR). As shown in Figure 2a, five of these lncRNAs were up-expressed in CS-exposed mice when comparing with those in control mice, and three were down-regulated. Besides, the fold-changes of these up-regulated and down-regulated lncRNAs were calculated with microarray or qRT-PCR (Figure 2b), and the correlation analysis showed that the results of microarray were highly positively correlated with qRT-PCR (Figure 2c), suggesting that our microarray data was reliable.
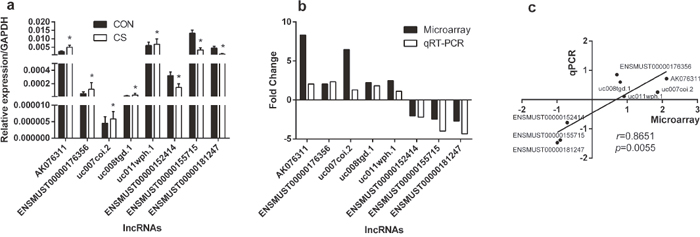
Figure 2: Comparison between microarray data and qRT-PCR results. qRT-PCR was performed to test the differentially expressed lncRNAs between controls and CS-exposed mice (a), the fold change of each lnRNA between CS-exposed mice and controls was tested with microarray and qRT-PCR respectively (b), and the correlation between microarray and qRT-PCR was performed with natural logarithms of these different fold changes (c). *: p<0.05, r: standard correlation coefficient. (n=5 for control group and CS-exposed group, respectively). CON: control group; CS: cigarette smoke-exposed group.
GO and KEGG pathway analyses
The Gene Ontology (GO) results showed that the most significant enriched biological processes of up-regulated genes were immune response, defense response and cell chemotaxis (Figure 3a), the most significant enriched cellular components of up-regulated genes were extracellular space, extracellular region and extracellular region part (Figure 3a), and the most significant enriched molecular function of up-regulated genes were receptor binding, cytokine activity and chemokine activity (Figure 3a). On the other hand, the most significant enriched biological processes of down-regulated genes were peptide cross-linking, transforming growth factor beta receptor signaling pathway and cellular response to transforming growth factor beta stimulus (Figure 3b), the most significant enriched cellular components of down-regulated genes were extracellular matrix component, proteinaceous extracellular matrix and extracellular matrix (Figure 3b), and the most enriched GOs targeted by down-regulated transcripts were extracellular matrix structural constituent, structural molecule activity and iron ion binding (Figure 3b).
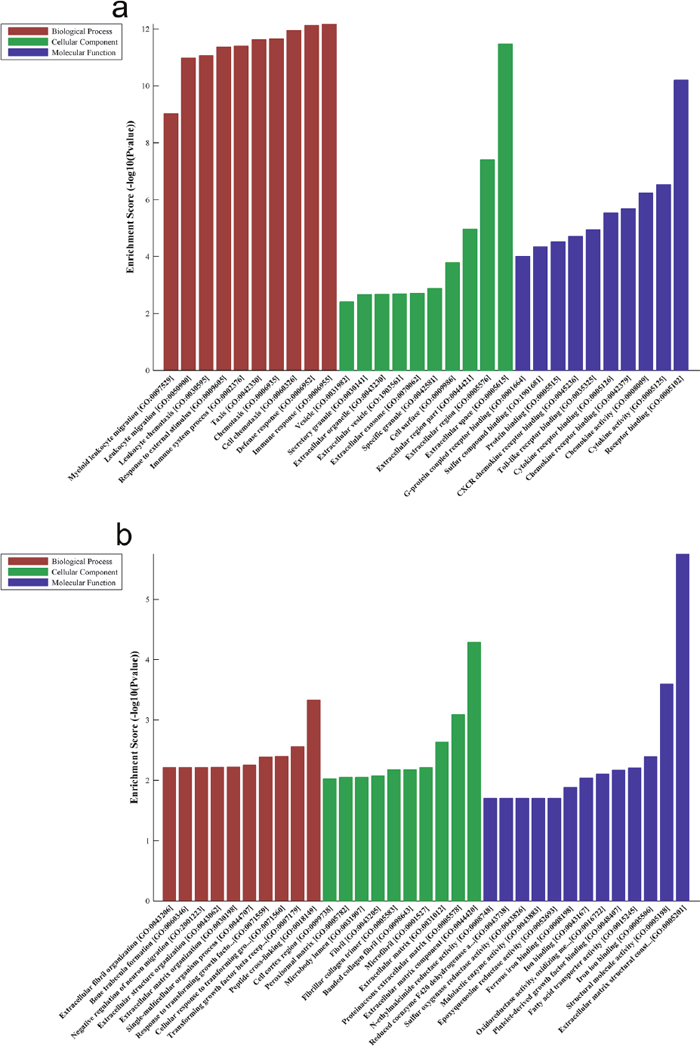
Figure 3: Biological functions of up-expressed and down-expressed mRNAs. Notes: The most significantly up-regulated mRNAs (a) and down-regulated mRNAs (b) which were involved in biological process, cellular component and molecular function were achieved with GO analysis.
Pathway analysis demonstrated that the up-regulated genes are mainly associated with cytokine-cytokine receptor interaction and chemokine signaling pathway, while down-regulated transcripts in CS-treated lung tissues are involve in protein digestion and absorption (Figure 4).
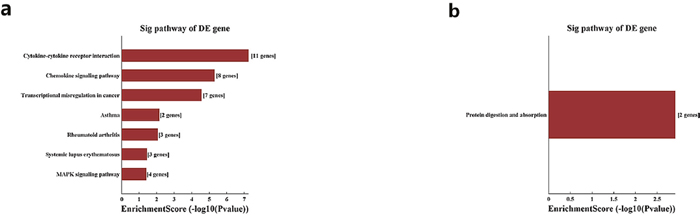
Figure 4: Pathway analysis for up-regulated and down-regulated mRNAs. Notes: The most significant pathways which were related to the up-regulated genes (a) and down-regulated genes (b) were achieved with pathway analysis.
LncRNA-mRNA co-expression network
An lncRNA-mRNA co-expression network was constructed, all the differentially expressed lncRNAs which were related to mRNAs with a pearson’s correlation coefficients (PCC) of no less than 0.9 were shown in the same figure, and the validated 8 lncRNAs were marked as blue (Figure 5). Most lncRNAs including the 8 ones were co-expressed with multiple mRNAs and lncRNAs, indicating that multiple trans-regulative mechanisms were present.
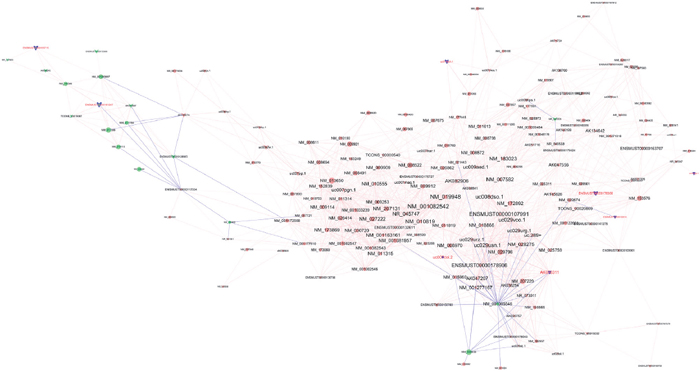
Figure 5: Co-expression network of the differentially expressed lncRNAs and mRNAs. Notes: Round nodes represent protein-coding genes and arrow nodes represent lncRNAs. Red nodes represent up-regulated genes or lncRNAs, green nodes represent down-regulated genes or lncRNAs, and blue nodes represent those 8 tested lncRNAs. A red line represents a positive correlation, and a blue line represents negative correlation. The node size represents the connectivity, briefly, larger node means that more genes or lncRNAs are co-expressed with this gene or lncRNA.
DISCUSSION
Recently, growing investigations on transcriptome sequencing have evealed thousands of differentially expressed lncRNAs in various diseases, which may play roles in the development and progression of diseases [11–13]. However, studies focusing on the lncRNAs related to CS-induced airway inflammation is limited. In this study, we investigated the lncRNA expression profiles in the lung tissue of 5 CS-exposed mice and 5 control mice to uncover the potential roles of lncRNAs in the pathogenesis of CS-induced pulmonary inflammation. As a result, 108 lncRNAs and 119 mRNAs were identified as differentially expressed via microarrays. Most of these lncRNAs have not been functionally characterized. The microarray results of AK076311, ENSMUST00000152414, ENSMUST00000155715, ENSMUST00000176356, ENSMUST00000181247, uc007coi.2, uc008tgd.1 and uc011wph.1 were confirmed by qRT-PCR. The data from qRT-PCR matched well with those from microarrays.
Previous reports have shown that lncRNAs participated in a wide variety of pathological processes at different levels, including regulation of gene transcription, chromatin remodeling and epigenetic regulation. Therefore, GO and pathway analyses were conducted to help better predicting on the potential function of the differentially expressed lncRNAs and co-expressed genes. The results showed that differentially expressed genes are mainly involved in immune response, defense response and cell chemotaxis. These genes were further identified to be mainly related to cytokine-cytokine receptor interaction and chemokine signaling pathways. At the early stages of COPD, airway inflammation is characterized by extensive activation of the innate immune system [14]. During this period, damage associated molecular patterns (DAMPs) induced by CS activate pattern recognition receptors (PRRs), leading to activation of inflammatory pathways and the release of inflammatory cytokines [15, 16]. These cytokines further induce the accumulation of innate immune cells to the damage site, along with the increasing production of chemokines [17]. Our results strongly supported the previous findings, implying that innate immune defense mechanism participates in the CS-induced airway inflammation and may offer clues for early intervention of COPD.
Moreover, from the coding-non-coding gene co-expression network (CNC network), we found that many lncRNAs were significantly correlated with the expression of multiple protein-coding genes. Notably, both AK076311 and uc007coi.2 were negatively associated with chemokine receptor 10 (CCR10), while ENSMUST00000181247 positively co-expressed with CD177. The involvement of CCR10 and its ligand CCL28 has been implicated in various inflammatory lung diseases [18]. CCL28 mediates in vitro T and B cell migration through CCR10 [19, 20]. In addition, it has been shown that CD177 levels were increased in the airways of Cynomolgus monkeys after ozone challenge, indicating the potential relevance with COPD pathophysiology [21, 22]. These findings are consistent with the GO and pathway analyses indicating the important role of innate immune response in CS-induced inflammation. Although according to current evidence, many lncRNAs may function locally to activate or repress the expression of their neighboring or overlapping genes [23], it is still worthy to perform further study to reveal the underlying mechanisms of these lncRNAs.
In conclusion, the present study profiled the expression of lncRNAs and mRNAs by microarray in the lung tissue of CS-exposed mice. Hundreds of lncRNAs and mRNAs were observed differentially expressed after CS exposure. GO and pathway analyses were made to speculate the potential functions of differentially expression genes. Further studies are required to clarify the molecular mechanism and biological function of lncRNAs to determine whether they can serve as novel targets in CS-associated airway inflammation.
MATERIALS AND METHODS
Animal experiments
Animals were handled-according to the ARRIVE guidelines developed by the National Center for the Replacement, Refinement, and Reduction of Animals in Research (NC3Rs), the study protocol was reviewed and approved by the animal ethics committee of West China Hospital, Sichuan University.
Specific pathogen-free male C57BL/6 mice (7-9 weeks, 22-24g) were purchased from Dashuo Biological Technology Co, Ltd (Chengdu, China), and were randomly divided into two groups (n =5 per group): control group (C) and CS-exposed group (CS).
Marlboro cigarette was employed for CS exposure experiment (Marlboro, Philip Morris USA Inc.; 0.8 mg nicotine and 10 mg tar per cigarette), the toxicity of which is similar to the 1R4F reference cigarette from University of Kentucky [24]. Mice in CS group were exposed to CS for 2 hours twice daily, 6 days per week for 4 weeks according to the protocol described previously [25]. Briefly, mice were assigned into a ventilated plastic chamber connected to a smoke generator (CH Technologies, Westwood, NJ, USA) and filled with fixed concentration of smoke (200 mg total particulate matter (TPM)/m3) by pumping mainstream cigarette smoke from burning cigarettes at a constant rate (each cigarette took 4 min to burn out) while using another pump to deliver fresh air from outside simultaneously at a fixed rate. The total rate of airflow passing through the box was constant at 1.22 L/min. At the same time, mice in control group were exposed to room air following the same schedules. When CS exposure finished, all the mice were sacrificed by over-dose of intraperitoneal phenobarbital (Sigma-Aldrich, St Louis, MO, USA) followed by lung tissue collection.
RNA isolation
The total RNA from lung tissues was extracted and purified using Trizol reagent (Invitrogen, Carlsbad) according to the manufacturer’s protocol. RNA quantification and quality were measured by NanoDrop 1000 Spectrophotometer (Thermo, USA) and agarose gel electrophoresis as previously described [26, 27].
Microarray analysis
The microarray hybridization was performed with service from KangChen Bio-tech (Shanghai, China), based on the manufacturer’s standard procedures. Briefly, mRNA was purified from 1 microgram of total RNA, and each sample was amplified and transcribed into fluorescent cRNA along the entire length of the transcripts without 3’ bias utilizing random primers. The labeled cRNAs were then hybridized onto the mouse lncRNA microarray V2.0 (8 × 60K, Arraystar). The arrays were then scanned by the Agilent Scanner G2565BA, and the analysis of array images was performed by Agilent Feature Extraction Software. Data normalization and subsequent processing were performed with the GeneSpring GX v12.1 software package (Agilent Technologies, Santa Clara, CA, USA).
Differentially expressed lncRNAs and mRNAs were identified by performing a volcano plot filtering, with the threshold defined as fold-change >2.0 (Student’s t-test P < 0.05) [28]. Hierarchical clustering was carried out to show the distinguishable lncRNA expression profile between CS-exposed mice and control samples.
Independent validation of differentially expressed lncRNAs
Quantitative real-time PCR (qRT-PCR) was performed to validate the results of microarray analysis, and eight differentially expressed lncRNAs were randomly selected to be checked, primers for these lncRNAs were listed in Supplementary Table 1. Briefly, total RNA was extracted from the lung tissue as described above. cDNA was synthesized using the iScript cDNA Synthesis Kit (Bio-Rad, Hercules, CA, USA). qRT-PCR analysis was performed by the CFX96 real-time PCR detection system using SsoFast EvaGreen Supermix according to the manufacturer's description (Bio-Rad, Hercules, CA, USA), and standard cure was used for the quantification of each lncRNA. Besides, all data were normalized to GAPDH gene expression. Differences in lncRNA expression between CS-exposed mice and controls were analyzed using Student’s t-test with SPSS 22.0 (SPSS Inc., Chicago, IL, USA), natural logarithm was calculated to analyze the relationship between fold changes of microarray analysis and qRT-PCR, two-side P < 0.05 was considered significant.
GO and KEGG pathway analysis
We used Gene Ontology (GO) to predict the functions of differentially expressed genes identified in the present study, including molecular functions, biological processes, and cellular components. Pathway analysis was applied to map genes to Kyoto Encyclopedia of Genes and Genomes (KEGG) pathways. Fisher’s exact tests were also used for the statistical analyses.
LncRNA-mRNA co-expression network
The coding-non-coding gene co-expression network (CNC network) was built according to the correlation between the differentially expressed lncRNAs and mRNAs. Pearson’s correlation coefficients (PCC) of no less than 0.9 were used to identify the lncRNA-mRNA pairs [29]. The lncRNA-mRNA co-expression network was drawn by Cytoscape software (The Cytoscape Consortium, San Diego, CA, USA).
Author contributions
HW, DL, and NZ developed the study design and proposal, performed the experiment, carried out data analysis, interpretation and drafting of the manuscript. YW, TW, DX and LC contributed to study design, data collection, analysis, and critical revision of this manuscript. YS and FW developed the study design and proposal, revised final manuscript, and is responsible for fielding correspondence. All authors approved the final version of the manuscript.
CONFLICTS OF INTEREST
None of the authors has any conflicts of interest related to this article.
FUNDING
This work was supported by grants from the National Natural Science Foundation of China (81230001, 81300032, 81470236, and 81670038), National Key Research and Development Program in China (2016YFC0903600 and 2016YFC1304500), and Sichuan Science and Technology Support Program (2015SZ0151). The funders had no role in study design, data collection and analysis, decision to publish, or preparation of the manuscript.
REFERENCES
1. Chung KF, Adcock IM. Multifaceted mechanisms in COPD: inflammation, immunity, and tissue repair and destruction. Eur Respir J. 2008; 31: 1334-1356.
2. Taylor JD. COPD and the response of the lung to tobacco smoke exposure. Pulm Pharmacol Ther. 2010; 23: 376-383.
3. Nemmar A, Raza H, Subramaniyan D, John A, Elwasila M, Ali BH, Adeghate E. Evaluation of the pulmonary effects of short-term nose-only cigarette smoke exposure in mice. Exp Biol Med (Maywood). 2012; 237: 1449-1456.
4. van der Vaart H, Postma DS, Timens W, Hylkema MN, Willemse BW, Boezen HM, Vonk JM, de Reus DM, Kauffman HF, ten Hacken NH. Acute effects of cigarette smoking on inflammation in healthy intermittent smokers. Respir Res. 2005; 6: 22.
5. Khalil AM, Guttman M, Huarte M, Garber M, Raj A, Rivea Morales D, Thomas K, Presser A, Bernstein BE, van Oudenaarden A, Regev A, Lander ES, Rinn JL. Many human large intergenic noncoding RNAs associate with chromatin-modifying complexes and affect gene expression. Proc Natl Acad Sci U S A. 2009; 106: 11667-11672.
6. Massone S, Vassallo I, Fiorino G, Castelnuovo M, Barbieri F, Borghi R, Tabaton M, Robello M, Gatta E, Russo C, Florio T, Dieci G, Cancedda R, et al. 17A, a novel non-coding RNA, regulates GABA B alternative splicing and signaling in response to inflammatory stimuli and in Alzheimer disease. Neurobiol Dis. 2011; 41: 308-317.
7. Ponting CP, Oliver PL, Reik W. Evolution and functions of long noncoding RNAs. Cell. 2009; 136: 629-641.
8. Thai P, Statt S, Chen CH, Liang E, Campbell C, Wu R. Characterization of a novel long noncoding RNA, SCAL1, induced by cigarette smoke and elevated in lung cancer cell lines. Am J Respir Cell Mol Biol. 2013; 49: 204-211.
9. Bi H, Zhou J, Wu D, Gao W, Li L, Yu L, Liu F, Huang M, Adcock IM, Barnes PJ, Yao X. Microarray analysis of long non-coding RNAs in COPD lung tissue. Inflamm Res. 2015; 64: 119-126.
10. Chen M, Wang T, Shen Y, Xu D, Li X, An J, Dong J, Li D, Wen F, Chen L. Knockout of RAGE ameliorates mainstream cigarette smoke-induced airway inflammation in mice. Int Immunopharmacol. 2017; 50: 230-235.
11. Greco S, Salgado-Somoza A, Devaux Y, Martelli F. Long noncoding RNAs and cardiac disease. Antioxid Redox Signal. 2017.
12. Liu RT, Cao JL, Yan CQ, Wang Y, An CJ, Lv HT. Effects of LncRNA-HOST2 on cell proliferation, migration, invasion and apoptosis of human hepatocellular carcinoma cell line SMMC-7721. Biosci Rep. 2017; 37: BSR20160532.
13. Zhang L, Sun X, Chen S, Yang C, Shi B, Zhou L, Zhao J. Long noncoding RNA DANCR regulates miR-1305-Smad 4 axis to promote chondrogenic differentiation of human synovium-derived mesenchymal stem cells. Biosci Rep. 2017; 37: BSR20170347.
14. Cosio MG, Saetta M, Agusti A. Immunologic aspects of chronic obstructive pulmonary disease. N Engl J Med. 2009; 360: 2445-2454.
15. Pouwels SD, Heijink IH, ten Hacken NH, Vandenabeele P, Krysko DV, Nawijn MC, van Oosterhout AJ. DAMPs activating innate and adaptive immune responses in COPD. Mucosal Immunol. 2014; 7: 215-226.
16. Oppenheim JJ, Yang D. Alarmins: chemotactic activators of immune responses. Curr Opin Immunol. 2005; 17: 359-365.
17. Bozinovski S, Seow HJ, Chan SP, Anthony D, McQualter J, Hansen M, Jenkins BJ, Anderson GP, Vlahos R. Innate cellular sources of interleukin-17A regulate macrophage accumulation in cigarette- smoke-induced lung inflammation in mice. Clin Sci (Lond). 2015; 129: 785-796.
18. Daubeuf F, Jung F, Douglas GJ, Chevalier E, Frossard N. Protective effect of a Protein Epitope Mimetic CCR10 antagonist, POL7085, in a model of allergic eosinophilic airway inflammation. Respir Res. 2015; 16: 77.
19. Wang W, Soto H, Oldham ER, Buchanan ME, Homey B, Catron D, Jenkins N, Copeland NG, Gilbert DJ, Nguyen N, Abrams J, Kershenovich D, Smith K, et al. Identification of a novel chemokine (CCL28), which binds CCR10 (GPR2). J Biol Chem. 2000; 275: 22313-22323.
20. Scanlon KM, Hawksworth RJ, Lane SJ, Mahon BP. IL-17A induces CCL28, supporting the chemotaxis of IgE-secreting B cells. Int Arch Allergy Immunol. 2011; 156: 51-61.
21. Hicks A, Kourteva G, Hilton H, Li H, Lin TA, Liao W, Li Y, Wei X, March T, Benson J, Renzetti LM. Cellular and molecular characterization of ozone-induced pulmonary inflammation in the Cynomolgus monkey. Inflammation. 2010; 33: 144-156.
22. Kistemaker LE, van Os RP, Dethmers-Ausema A, Bos IS, Hylkema MN, van den Berge M, Hiemstra PS, Wess J, Meurs H, Kerstjens HA, Gosens R. Muscarinic M3 receptors on structural cells regulate cigarette smoke-induced neutrophilic airway inflammation in mice. Am J Physiol Lung Cell Mol Physiol. 2015; 308: L96-L103.
23. Zhao X, Tang Z, Zhang H, Atianjoh FE, Zhao JY, Liang L, Wang W, Guan X, Kao SC, Tiwari V, Gao YJ, Hoffman PN, Cui H, et al. A long noncoding RNA contributes to neuropathic pain by silencing Kcna2 in primary afferent neurons. Nat Neurosci. 2013; 16: 1024-1031.
24. Patskan GJ, Podraza KF, Meurrens K, Coggins CR, Friedrichs B, Gerstenberg B, Gomm W, Schnell P, Stabbert R, Veltel D, Weber S, Terpstra P. Toxicological comparisons of three styles of a commercial U.S. cigarette (Marlboro with the 1R4F reference cigarette. Inhal Toxicol. 2008; 20: 695-721.
25. Li D, Hu J, Wang T, Zhang X, Liu L, Wang H, Wu Y, Xu D, Wen F. Silymarin attenuates cigarette smoke extract-induced inflammation via simultaneous inhibition of autophagy and ERK/p38 MAPK pathway in human bronchial epithelial cells. Sci Rep. 2016; 6: 37751.
26. Cerny KL, Ribeiro RA, Jeoung M, Ko C, Bridges PJ. Estrogen receptor alpha (ESR1)-dependent regulation of the mouse oviductal transcriptome. PLoS One. 2016; 11: e0147685.
27. Walus M, Kida E, Rabe A, Albertini G, Golabek AA. Widespread cerebellar transcriptome changes in Ts65Dn Down syndrome mouse model after lifelong running. Behav Brain Res. 2016; 296: 35-46.
28. Yang Y, Cai Y, Wu G, Chen X, Liu Y, Wang X, Yu J, Li C, Chen X, Jose PA, Zhou L, Zeng C. Plasma long non-coding RNA, CoroMarker, a novel biomarker for diagnosis of coronary artery disease. Clin Sci (Lond). 2015; 129: 675-685.
29. Dou C, Cao Z, Yang B, Ding N, Hou T, Luo F, Kang F, Li J, Yang X, Jiang H, Xiang J, Quan H, Xu J, et al. Changing expression profiles of lncRNAs, mRNAs, circRNAs and miRNAs during osteoclastogenesis. Sci Rep. 2016; 6: 21499.