
INTRODUCTION
Urothelial carcinoma has one of the highest mutation rates of any sequenced cancer to date along with lung cancer and melanoma [1]. High-throughput next generation sequencing analyses such as The Cancer Genome Atlas (TCGA) and others have identified a mutational signature characterized by a TCW>T/C mutation thought to be attributable to the apolipoprotein B mRNA editing catalytic polypeptide-like (APOBEC) family of enzymes [1–3]. This mutational pattern is the predominant pattern in muscle-invasive bladder cancer (approximately 80% of bladder tumors in the TCGA have an APOBEC mutation signature) and is also frequently found in breast, cervical, head and neck, and lung cancers [1, 3–5].
The APOBEC family consists of 11 members, including AID, APOBEC1, APOBEC2, APOBEC3A, APOBEC3B, APOBEC3C, APOBEC3D, APOBEC3F, APOBEC3G, APOBEC3H, and APOBEC4. These enzymes function as cytosine deaminases and are involved in C>U deamination in single-stranded DNA (ssDNA), and likely function physiologically in antiretroviral defense [6–9]. However, in tumor cells, these enzymes are likely responsible for hypermutation at cytosine bases in exposed ssDNA [10]. The APOBEC3 family, and particularly APOBEC3A and APOBEC3B [6, 11–14], are the predominant APOBEC enzymes theorized to contribute to cancer mutagenesis.
Several studies have linked APOBEC3B expression with mutagenesis [5, 14, 15], but its expression alone does not fully explain this mutational signature, and APOBEC3A may also play a significant role [11]. Regulation of APOBEC enzymes remains unclear, but expression of APOBEC3A and APOBEC3B can be induced in bladder cancer cell lines by the DNA-damaging agent bleomycin, as well as by an interferon response [4]. In TCGA breast and bladder cancers, DNA replication stress and mutations in DNA repair genes have been linked to APOBEC-mediated mutagenesis [4, 16], potentially due to increased availability of ssDNA substrate for enzymatic deamination [17, 18]. Furthermore, a mutation in TP53 or other DNA damage response genes may be a prerequisite for cancer cells to survive in the setting of APOBEC-driven kataegis [15].
In this study, we investigate the APOBEC mutational signature in the TCGA, Beijing Genomics Institute (BGI), and Cancer Cell Line Encyclopedia (CCLE) bladder cancer datasets and its relationship with specific mutations, molecular subtype, gene expression, and survival. We hypothesized that tumors with high levels of APOBEC-mediated mutagenesis would be enriched for mutations in DNA damage response genes and express genes related to activation of the immune system at higher levels, while tumors with low levels of APOBEC-mediated mutagenesis may have enrichments for oncogenes. Thus, APOBEC activity may link DNA damage and immune response in urothelial carcinoma.
RESULTS
APOBEC mutagenesis in bladder cancer
To understand factors associated with APOBEC mutagenesis, we first evaluated the association of APOBEC signature with mutation burden in the TCGA cohort. When compared across all patients, we found the frequency of the nucleotide conversion C>G mutations is directly related to total mutation burden in bladder cancer (Figure 1A). Many of these mutations are a specific contextual TCW>T/G mutation attributed to the APOBEC family of enzymes. Of 388 tumors in the provisional TCGA bladder urothelial carcinoma dataset, 324 are enriched for APOBEC mutagenesis (“APOBEC-high”) vs. 64 with low or no enrichment (“ABPOEC-low”) [19, 20]. When stratified by APOBEC enrichment, APOBEC-high tumors were associated with almost a two-fold increase in overall survival compared to APOBEC-low tumors (median overall survival 38.2 vs 18.5 months, p = 0.0050, Figure 1B). TCGA APOBEC-high tumors have a higher number of variants per sample, a higher proportion of C>T and C>G mutations, and a higher proportion of catalogue of somatic mutations in cancer (COSMIC) signatures 2 and 13, as expected (Figure 1C–1D). APOBEC-low tumors were mainly comprised of signatures 1 and 5.
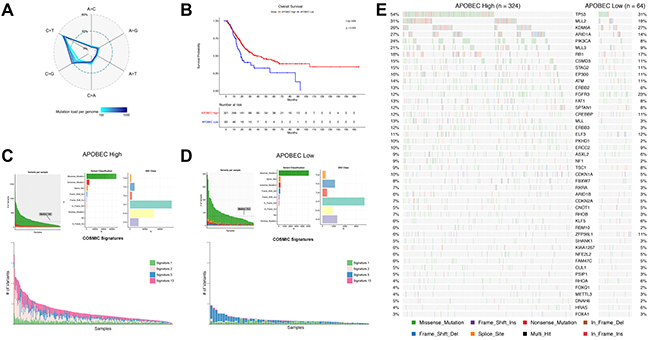
Figure 1: APOBEC-mediated mutagenesis in the TCGA bladder cancer cohort (n = 388). (A) Percentage of single nucleotide variations (SNVs) as a function of mutation load. Genomes were binned in groups of 20 samples according to mutation load. (B) Kaplan-Meier survival curve of APOBEC-high and APOBEC-low bladder tumors. (C) Summary of mutagenesis in APOBEC-high tumors, including number of variants per sample, variant classification, class of SNV, and contribution of COSMIC signatures 1, 2, 5, and 13 in each sample. (D) Summary of mutagenesis in APOBEC-low tumors, including number of variants per sample, variant classification, class of SNV, and contribution of COSMIC signatures 1, 2, 5, and 13 in each sample. (E) Oncoplot of the top genes commonly mutated in the TCGA bladder cancer cohort in APOBEC-high and APOBEC-low tumors. TCGA, The Cancer Genome Atlas; COSMIC, catalogue of somatic mutations in cancer.
To confirm our findings, we investigated APOBEC signature and mutagenesis in the BGI bladder cancer cohort. BGI APOBEC-high tumors were also found to have higher mutation burden and a higher proportion of APOBEC COSMIC signatures 2 and 13 (Figure 2A and 2B). COSMIC signature 22 was also represented in some samples of both the BGI APOBEC-high and APOBEC-low cohorts, with signature 22 found at higher mutation burden (Figure 2A and 2B; cyan color).
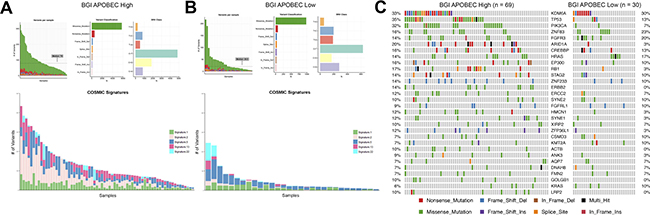
Figure 2: APOBEC-mediated mutagenesis in the BGI bladder cancer cohort (n = 99). (A) Summary of mutagenesis in APOBEC-high tumors, including number of variants per sample, variant classification, class of SNV, and contribution of COSMIC signatures 1, 2, 5, 13, and 22 in each sample. (B) Summary of mutagenesis in APOBEC-low tumors, including number of variants per sample, variant classification, class of SNV, and contribution of COSMIC signatures 1, 2, 5, 13, and 22 in each sample. (C) Oncoplot of the top genes commonly mutated in the BGI bladder cancer cohort in APOBEC-high and APOBEC-low tumors. BGI, Beijing Genomics Institute; COSMIC, catalogue of somatic mutations in cancer.
We then investigated the clinical and pathologic features associated with APOBEC enrichment. APOBEC-low tumors are more likely to be low-grade in the TCGA cohort (17% vs 3%, p < 0.0001; Supplementary Table 1A). A higher proportion of APOBEC-low tumors from the BGI dataset were Grade 1/3 (50% vs 38%), but this was not statistically significant (Supplementary Table 1B). A higher frequency of Asian patients were APOBEC-low vs. APOBEC-high in the TCGA cohort (26% vs 7%), and APOBEC3B was expressed at a lower level in Asian patients vs. non-Asian ethnicity (p < 0.0001, Supplementary Figure 2). In addition, a higher proportion of patients in the BGI dataset were APOBEC-low (30%), compared to the TCGA dataset (16%; p = 0.0027), confirming the association of a lower level of APOBEC enrichment with Asian ethnicity. APOBEC-high and -low tumors were otherwise were similar in stage, subtype, gender, and smoking history in both cohorts (Supplementary Table 1A–1B).
Differential mutations in APOBEC-high and APOBEC-low tumors
To determine what somatic mutations were associated with APOBEC mutagenesis in bladder tumors, we next compared mutated genes between APOBEC-high and APOBEC-low tumors. After correction for multiple comparisons, TCGA APOBEC-high tumors were more likely to have mutations in TP53, PIK3CA, ATR, BRCA2, MLL, MLL3, and ARID1A while TCGA APOBEC-low tumors were more likely to have mutations in KRAS and FGFR3 (Figure 3A–3B; Supplementary Table 2). Functional annotation of differentially mutated genes demonstrates that APOBEC-high tumors are enriched for mutations in DNA damage repair genes and chromatin modification genes (Supplementary Table 3).
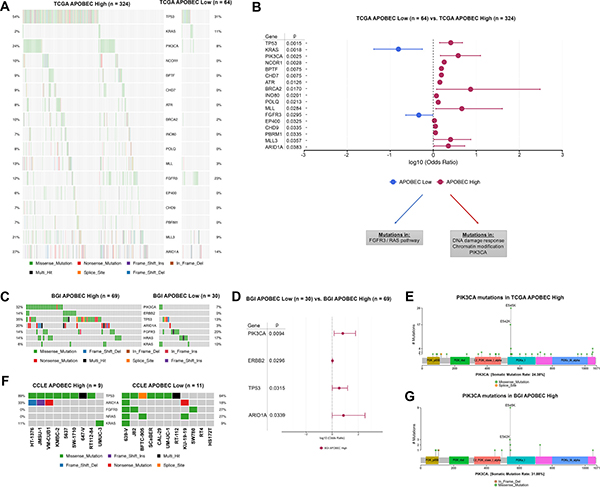
Figure 3: Differentially mutated genes in APOBEC-high and APOBEC-low tumors. (A) Oncoplot of genes significantly differentially mutated in TCGA APOBEC-high and APOBEC-low tumors. (B) Forestplot of differentially mutated genes in TCGA APOBEC-high and APOBEC-low tumors with log10 odds ratio, 95% confidence intervals, and adjusted p-value. (C) Oncoplot of significantly differentially mutated genes (PIK3CA, ERBB2, TP53, ARID1A) as well as FGFR3/RAS genes in BGI APOBEC-high and APOBEC-low tumors. (D) Forestplot of differentially mutated genes in BGI APOBEC-high and APOBEC-low tumors with log10 odds ratio, 95% confidence intervals, and adjusted p-value. (E) Lollipop plot of PIK3CA mutations in TCGA APOBEC-high tumors. The majority of mutations in PIK3CA in APOBEC-high tumors are in the helical domain at TCW motifs 542 and 545. (F) Oncoplot of TP53, ARID1A, FGFR3, NRAS, and HRAS in bladder cancer cell lines. (G) Lollipop plot of PIK3CA mutations in BGI APOBEC-high tumors. Again the majority of mutations in PIK3CA in APOBEC-high tumors are in the helical domain at TCW motifs 542 and 545. TCGA, The Cancer Genome Atlas. BGI, Beijing Genomics Institute
We next confirmed these analyses by evaluation of the mutation profile of APOBEC-high and APOBEC-low tumors in the smaller BGI cohort. The most frequent mutations in the BGI APOBEC-high tumors were TP53 (35%), KDM6A (33%), PIK3CA (32%), and ARID1A (20%), whereas the most frequent mutations in the APOBEC-low tumors were KDM6A (30%), ZNF83 (23%), FGFR3 (20%), and HRAS (17%). BGI APOBEC-high tumors were significantly more likely to have mutations in PIK3CA, ERBB2, TP53, and ARID1A (Figure 3C; Supplementary Table 4).
Non-synonymous mutations in KRAS and FGFR3 are mutually exclusive in both the BGI and TCGA cohorts (Figure 3A and 3C). Mutations in PIK3CA occurred primarily at E542K and E545K in both the TCGA and BGI cohorts, which are APOBEC TCW motifs (Figure 3E and 3G), suggesting these mutations may be a result of APOBEC-mediated mutagenesis rather than a driver of the APOBEC mutational signature.
Finally, we confirmed the mutational patterns by analysis of multiple CCLE bladder cancer cell lines. Of 20 bladder cancer cell lines, 9 were enriched for APOBEC mutagenesis, and had frequent mutations in TP53 (89%) and ARID1A (33%), while 11 cell lines were not enriched for APOBEC mutagenesis and had frequent mutations in FGFR3 (27%) and NRAS (27%) (Figure 3F).
Expression of APOBEC3 correlates with mutational burden
To determine the relationship between APOBEC mutagenesis, APOBEC gene expression, and molecular subtype, we next investigated the association of APOBEC3 enzyme expression with total mutations in both the entire TCGA bladder cancer dataset and in the four molecular subtypes (luminal, p53-like, basal, and claudin-low; Supplementary Figure 1). Expression of APOBEC3A and APOBEC3B were the only APOBEC enzymes that directly correlate with the total mutation burden in bladder cancer (Figure 4A–4B; Supplementary Figure 3). We found no association between total mutations or APOBEC enrichment score and the molecular subtypes of bladder cancer (Supplementary Figure 4). However, APOBEC3A is expressed at a significantly higher level in the basal subtype than in luminal, p53-like, or claudin-low subtypes (Figure 4C), while APOBEC3B is evenly expressed across subtypes (Figure 4D). APOBEC3A and APOBEC3B expression levels correlate with total mutations in every subtype (Supplementary Figure 5).
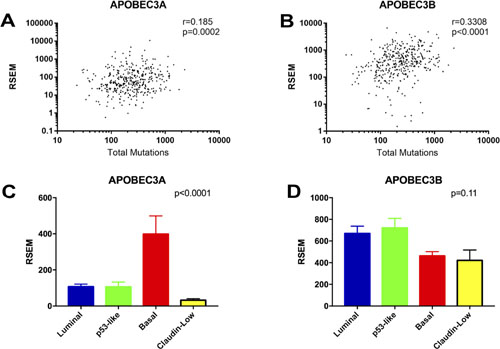
Figure 4: Correlations of APOBEC3A and APOBEC3B expression with mutational burden and molecular subtype. (A) Spearman correlation between total mutations and APOBEC3A expression. (B) Spearman correlation between total mutations and APOBEC3B expression. (C) Expression of APOBEC3A in the molecular subtypes of bladder cancer. (D) Expression of APOBEC3B in the molecular subtypes of bladder cancer.
Gene expression associated with APOBEC enrichment
To investigate the potential functional mechanisms associated with APOBEC mutagenesis, we approached gene expression association with APOBEC enrichment in the TCGA cohort by several methods. First, we examined the association of APOBEC enrichment with 27 immune cell and immune marker gene expression signatures [21, 22]. APOBEC-high tumors demonstrate relative higher expression of these immune signatures, with basal and claudin-low tumors clustering near high expression of immune signatures (Figure 5A; differences in immune signatures between molecular subtypes Supplementary Figure 6). APOBEC enrichment score significantly correlates with B-cell, T-cell, Th1 T-cell, T-regulatory cell, γδ T-cell, cytotoxic T-cell, dendritic cell, MHC-II, IFN, and immune checkpoint signatures (Figure 5B; Supplementary Figure 7). This pattern is consistent across the molecular subtypes of bladder cancer (Supplementary Figure 8).
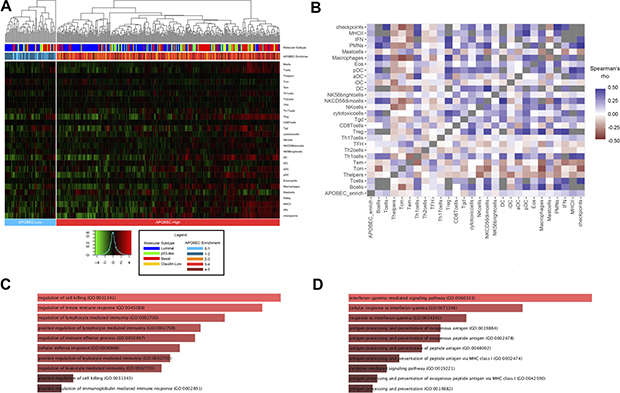
Figure 5: Association of APOBEC enrichment with immune signatures and gene expression. (A) Heirarchical clustering of immune cell and checkpoint signatures in APOBEC-high and APOBEC-low tumors. Annotation of each tumor with molecular subtype and numeric APOBEC enrichment score is provided in the legend. (B) Correlation matrix of APOBEC enrichment score and immune signature. (C) Barplot of gene ontology biological processes for genes highly expressed in APOBEC-high tumors compared to APOBEC-low tumors. (D) Barplot of gene ontology biological processes for genes positively correlated with numeric APOBEC enrichment score. Barplots generated with Enrichr and bar size based on combined score of p-value and deviation from expected rank. [49, 50]. Tcm, central memory T cell; Tem, effector memory T cell; Th1, type 1 T helper cell; Th2, type 2 T helper cell; TFH, T follicular helper cell; Th17, T-helper 17 cell; Treg, regulatory T cell; Tgd, γδ T cell; NK, natural killer; DC, dendritic cell; iDC, immature dendritic cell; aDC, activated dendritic cell; pDC, plasmacytoid dendritic cell; PMNs, polymorphonuclear leukocytes, IFN, interferon; MHC II, major histocompatibility complex class II.
We next analyzed differentially expressed genes between the 324 APOBEC-high and 64 APOBEC-low tumors. APOBEC-high tumors were enriched for expression of genes related to regulation of the immune response and lymphocyte-mediated immunity (Figure 5C; Supplementary Table 5), whereas APOBEC-low tumors demonstrated higher expression of genes related to transcription and translation (Supplementary Table 6). Similarly, correlation between continuous numeric APOBEC enrichment score and gene expression revealed a positive relationship between APOBEC enrichment score and gene families involved in IFNγ signaling, antigen presentation, and regulation of the immune response, including the immune checkpoint HAVCR2 (also known as TIM-3; Spearman r = 0.229, p < 0.0001) (Figure 5D; Supplementary Table 7), while genes inversely correlated with APOBEC enrichment score were enriched in processes related to transcription and translation (Supplementary Table 8).
Finally, to further evaluate the association of APOBEC mutational pattern, APOBEC3B enzyme expression, and the immune environment, we analyzed APOBEC3B expression in two APOBEC-low cell lines (RT4 and KU-19-19) and two APOBEC-high cell lines (HT-1376 and UM-UC-3) after exposure to IFNγ. Expression of APOBEC3B increased after exposure to IFNγ in APOBEC-high cell lines, but not in APOBEC-low cell lines suggesting that urothelial cancers with high APOBEC activity may have a feed-forward mechanism resulting in increased APOBEC expression upon immune activation (p = 0.03, Supplementary Figure 9).
DISCUSSION
APOBEC mutagenesis is the predominant mutational pattern in bladder cancer. In this paper, we demonstrate that tumors enriched for APOBEC mutagenesis (APOBEC-high tumors) have better survival and are more likely to have mutations in DNA damage repair genes and chromatin regulation genes, while tumors not featuring the APOBEC mutational pattern (APOBEC-low tumors) are significantly more likely to harbor mutations in FGFR3 and KRAS/HRAS/NRAS, which are mutually exclusive. Expression of APOBEC3A and APOBEC3B correlates with overall mutation load in bladder cancer, regardless of molecular subtype. In addition, APOBEC enrichment is associated with immune signatures and upregulation of immune-related genes including interferon signaling.
Our work is consistent with several prior studies linking APOBEC expression to mutational burden, survival, and DNA damage. APOBEC3B expression is upregulated in breast cancer and is associated with total mutation burden [5]. Overexpression of APOBEC3B in breast cancer cell lines results in DNA fragmentation, increased C>T mutations, delayed cell cycle arrest, and eventual cell death [5]. Furthermore, knockdown of APOBEC3B with short hairpin RNA in breast cancer cell lines decreases total number of uracil lesions, TP53 mutations, and C>T mutations [5]. In HEK-293 cell lines with inactivated TP53, overexpression of APOBEC3B induces markers of DNA damage response and leads to a kataegic mutational pattern in the APOBEC-targeting TCW motif [15].
APOBEC3A expression was not initially detectable in breast cancer cell lines [5], and APOBEC3B expression correlates strongly with overall mutations in multiple malignancies [5, 14], leading many to initially believe that APOBEC3B is responsible for the majority of the APOBEC mutational signature. However, APOBEC3A expression is also correlated with mutational burden [3], as we demonstrate again here, APOBEC3A is highly proficient at cytidine hypermutation and creation of DNA double-strand breaks [23, 24], and may have a larger role in mutagenesis than previously recognized [11].
Middlebrooks et al. demonstrated that expression of both APOBEC3A and APOBEC3B can be induced in bladder cancer cell lines by bleomycin, a DNA damaging agent, and by an RNA virus that induces an interferon response [4]. This group also used the TCGA bladder cancer dataset to demonstrate that APOBEC mutagenesis is associated with improved overall survival, and that APOBEC-high tumors are enriched for TP53 and PIK3CA mutations [4]. We demonstrate that bladder tumors not enriched for APOBEC mutagenesis frequently harbor mutations in FGFR3 or the RAS family of oncogenes, and we also demonstrate that APOBEC3A is expressed at significantly higher levels in the basal subtype of bladder cancer, compared to other subtypes.
The proposed substrate for APOBEC mutagenesis is ssDNA, a common DNA repair intermediate that may accumulate in cells with defects in DNA repair pathways [25]. APOBEC-high tumors are more likely to have mutations in genes related to DNA repair and chromatin regulation, including TP53, NCOR1, MLL3 (KMT2C), MLL (KMT2A), ATR, BRCA2, and ARID1A in the TCGA dataset. In the smaller BGI dataset, APOBEC-high tumors are more likely to have mutations in TP53 and ARID1A. We also demonstrate a higher frequency of PIK3CA mutations in APOBEC-high tumors in both the TCGA and BGI datasets. PIK3CA has been previously reported to be mutated at a high frequency in specific TCW-containing helical motifs across a number of tumor types [4, 26]. Our analysis supports these results, with the majority of PIK3CA mutations in APOBEC-high tumors occurring in the helical domain at E542 and E545. These specific mutations in E542 and E545 have also been reported as hotspot mutations in breast cancer [27]. The location of these mutations in APOBEC motifs suggests that these PIK3CA mutations may be a result of APOBEC-mediated mutagenesis, rather than supporting or driving APOBEC-mutagenesis.
Interestingly, APOBEC-low tumors in this study were more likely to be low-grade and have mutations in FGFR3 and the RAS family of oncogenes. This data was confirmed in the mutational analysis of 140 non-muscle-invasive bladder cancers [28]. This suggests that tumors not enriched for the APOBEC mutational pattern may be driven by oncogenes which may dysregulate cellular homeostasis via mechanisms that do not result in accumulation of ssDNA intermediates used as substrate for APOBEC mutagenesis. Alternatively, APOBEC-mediated mutagenesis may arrest tumor cells that do not possess inactivated TP53 or other tumor suppressors [15].
We also found a lower level of APOBEC-mediated mutagenesis in patients of Asian ethnicity in the TCGA cohort, compared to those of non-Asian ethnicity. In addition, a lower percentage of tumors from the BGI cohort were enriched for APOBEC-mediated mutagenesis compared to the TCGA cohort. One explanation is that patients of Asian ethnicity in the TCGA cohort express lower levels of APOBEC3B. Alternatively, non-APOBEC genetic instability processes may be present in these patients. In the BGI cohort, COSMIC Signature 22, which is a non-APOBEC mutational signature, was observed in several patients in both the APOBEC-high and APOBEC-low groups. This signature is attributed to aristolochic acid, which is found in plants of the Aristolochia genus and many of which are used in traditional Chinese herbal medicine [29].
Based on our results and the above discussion, we propose a working model of mutagenesis and the immune response in bladder cancer (Figure 6), in which a urothelial cell acquires one or more driver mutation(s). Accumulation of mutations in TP53, ARID1A, ATR, BRCA2, and/or other DNA damage response genes or chromatin regulation genes may result in the accumulation of ssDNA substrate for APOBEC3A and APOBEC3B, leading to a high level of APOBEC-mediated mutagenesis and a hypermutation phenotype. This hypermutation in turn leads to a large neoantigen burden and the subsequent immune response generated from this increase in neoantigens. In addition, APOBEC enzymes may be induced and overexpressed in response to interferon [4, 9, 24, 30], potentially causing a positive feedback loop in tumor cells enriched for APOBEC mutagenesis. In contrast, other tumors with mutations in the FGFR3/RAS pathway or other oncogenes may not expose sufficient substrate ssDNA to APOBEC enzymes to undergo significant APOBEC mutagenesis. These APOBEC-low tumors have poor survival, despite an enrichment for FGFR3 mutations and low-grade tumors, which were classically considered more benign phenotypes.
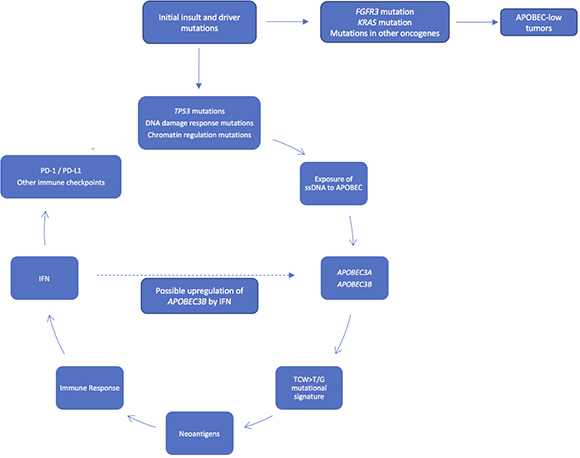
Figure 6: Working model of APOBEC-mediated mutagenesis in bladder cancer. Accumulation of mutations in TP53, ATR, BRCA2, and/or other DNA damage response genes or chromatin regulation genes may expose more substrate ssDNA to APOBEC3A and APOBEC3B, leading to a high level of APOBEC-mediated mutagenesis and a hypermutation phenotype, with subsequent neoantigen burden, immune response, and survival benefit. Tumors with mutations in FGFR3 and KRAS may not expose enough substrate to APOBEC enzymes to promote APOBEC-mediated mutagenesis.
Several limitations of this study warrant mention. We utilized multiple datasets for analysis, but the only dataset with both whole genome sequencing and RNA expression data is TCGA; therefore correlative data between mutational patterns and gene expression, including analysis in molecular subtypes and immune signatures, warrants replication. In addition, TCGA does not currently include any systemic treatment-related information. However, mutations in ERCC2 [31, 32] and other DNA repair genes [33, 34] are associated with response to platinum-based therapy, and further investigation into the role of APOBEC mutagenesis and response to both cytotoxic chemotherapy and immunotherapy is warranted. In addition, while we demonstrate that treatment of APOBEC-high cell lines with IFNγ leads to upregulation of APOBEC3B, inherent differences in morphology or other non-measured genes could also explain differences. It is also possible that other pro-inflammatory cytokines may have the same effect; this is currently under investigation. Another limitation is the lack of a specific gene expression signature observed in APOBEC-low tumors other than transcription- and translation-related genes, potentially due to the heterogeneity of this group. In addition, gene expression correlations with APOBEC enrichment score in APOBEC-low tumors would not be expected to generate a strong signal, as these tumors by definition have a low and heterogeneous numerical APOBEC enrichment score.
In summary, APOBEC enzymes are a major source of mutation in bladder cancer. Tumors enriched for APOBEC mutagenesis have better survival and are more likely to have mutations in DNA damage repair genes and chromatin modifying genes. The APOBEC mutagenesis signature is associated with immune signatures and with increased expression of immune-related genes. Bladder tumors not enriched for APOBEC mutagenesis are more likely to have mutations in FGFR3 and the RAS family of oncogenes, which are mutually exclusive, and these patients have poor overall survival. Further study of the regulation of APOBEC enzymes, mutagenesis, and response to subsequent therapy may provide further insight into the mutational landscape and potential therapeutics for bladder cancer.
METHODS
The Cancer Genome Atlas
The Cancer Genome Atlas (TCGA) bladder urothelial carcinoma data was downloaded from the Broad Institute Genome Data Analysis Center (GDAC) (http://gdac.broadinstitute.org) [20, 35]. Data from GDAC was downloaded on November 8, 2016, from the analysis timestamp “analyses_2016_01_28” (doi:10.7908/C19G5M58) [20]. Downloaded data includes clinical and demographic data (age, sex, tumor stage, overall survival), mutation annotation files (MutSig 2CV v3.1; MAF file; Mutsig_maf_modified.maf.txt) and mRNA expression (Illumina HiSeq RNAseqV2). TCGA RNA-seq mRNA expression levels are presented as RNA-seq by expectation-maximization (RSEM) values [36].
Clinical information was available on 412 TCGA bladder cancer samples, RNA-seq data was available on 408 samples, and mutation information was available on 395 samples. Overlap between the 412 patients with clinical information, 408 patients with RNA-seq data, and 395 patients with mutation annotation information yields 391 patients. Three outliers were removed from mutational analysis (TCGA-DK-A6AW, >150 mutations/Mb; TCGA-XF-AAN8 and TCGA-FD-A43, both with ≤5 total mutations).
Beijing Genomics Institute and Cancer Cell Line Encyclopedia
Mutational and staging data from the BGI (n = 99 samples) [37] was downloaded from cBioPortal (http://cbioportal.org) [38]. No survival or expression data is available for the BGI dataset. Mutational data from the CCLE was downloaded from the Broad CCLE portal (http://www.broadinstitute.org/ccle) [39].
Mutation analysis and APOBEC enrichment
Analysis and visualization of mutations was performed using R v3.3.3, Bioconductor [40] v3.4 (http://www.Bioconductor.org), and MAFtools v1.0.55 [41]. Mutation rates per sample were calculated using MutSig2CV v3.1 from the Broad Institute GDAC [1]. APOBEC enrichment score based on the frequency of TCW>T/G mutations was calculated as previously described [3, 4, 19]. Samples were classified into two groups: “APOBEC-high” based on APOBEC enrichment > 2 and Benjamini-Hochberg false-discovery-rate corrected p-value < 0.05; and “APOBEC-low” based on an APOBEC enrichment < 2 and/or Benjamini-Hochberg false-discovery-rate corrected p-value ≥ 0.05. Survival outcomes between patients with APOBEC-high-enrichment and APOBEC-low-enrichment was performed using log-rank test and Kaplan-Meyer curves (R packages survival v2.41-2, survminer v0.3.1, ggplot2 v2.2.1). Significantly differentially mutated genes between APOBEC-high-enrichment and APOBEC-low-enrichment groups was performed using MAFtools [41] as previously described [42] and visualized with oncoplots and forest plots.
Molecular subtyping
Molecular subtyping of 408 TCGA bladder urothelial carcinoma samples with RNA-seq data was performed using multiClust v1.4.0 [43]. Samples were classified as luminal, p-53-like, basal, or claudin-low as previously described [44] with hierarchical clustering using Euclidean distance and Ward’s linkage method (ward.D2; heatmap shown in Supplementary Figure 1). Differences in mutational load and expression of APOBEC3 enzymes (RSEM) between tumor subtypes was compared using ANOVA.
Immune signatures and gene expression associated with APOBEC enrichment
Immune signatures were calculated as previously described [22] using previously 24 published immune cell gene signatures from Bindea et al., [21] additional MHC-II and IFN gene signatures from Faruki et al., [22] and a immune checkpoint gene signature consisting of PD-1, PD-L1, PD-L2, CTLA-4, B7-H4, TIM-3, LAG3, OX40, and OX40L. Hierarchical clustering of immune signatures in APOBEC-high and APOBEC-low tumors was performed with multiClust v1.4.0 [43]. Differential expression analysis between TCGA APOBEC-high and APOBEC-low tumors was performed using limma v3.30.13 and edgeR v3.16.5 [45, 46]. Association of immune signatures and gene expression with numeric APOBEC enrichment score was performed using Spearman’s rho. Differences in immune signatures between tumor subtypes was compared using ANOVA. Functional annotation of genes was performed with DAVID v6.8 (http://david.ncifcrf.gov) [47, 48] and visualized with Enrichr (http://amp.pharm.mssm.edu/Enrichr/) [49, 50].
Cell lines and qPCR
Four bladder cancer cell lines (RT-4, KU-19-19, HT-1376, and UM-UC-3) were cultured in standard media (McCoy’s, RPMI1640, EMEM, and EMEM, respectively) with 10% FBS and 1% penicillin/streptomycin (Thermo Fisher Scientific) with the addition of either IFNγ (10 ng/mL; R&D Systems) or the equivalent amount of sterile PBS for 48 h. RT-4, HT-1376, and UM-UC-3 were obtained from ATCC, KU-19-19 was obtained from DSMZ. All experiments were performed on passages 4–10. Cells were lysed with TRIzol (Thermo Fisher Scientific) and total RNA was isolated following standard Abcam RNA isolation protocol. Quality and quantity of isolated RNA was evaluated with NanoDrop 2000 (Thermo Fisher Scientific). cDNA was prepared using standard amounts of RNA per sample (600 ng; 250 ng/uL) with the TaqMan RT Reagents kit (Thermo Fisher Scientific). Samples were run in technical triplicate in a 20-μL SsoAdvanced Universal Probes Supermix (BioRad) in standard 96-well PCR plates. Expression level of APOBEC3B and endogenous control GAPDH was measured using BioRad PrimePCR Probe Assays (qHsaCIP0039581 and qHsaCEP0041396) using BioRad CFX Connect RT-PCR Detection System. Experiment was repeated in triplicate before analysis, and the ΔΔCt method was used to calculate differences in gene expression between IFNγ-stimulated cells and controls.
Abbreviations and acronyms
TCGA: The Cancer Genome Atlas; BGI: Beijing Genomics Institute; CCLE: Cancer Cell Line Encyclopedia; COSMIC: catalogue of somatic mutations in cancer; ssDNA: single stranded DNA; APOBEC: apolipoprotein B mRNA editing catalytic polypeptide-like; GCAC: Genome Data Analysis Center; MAF: mutation annotation format; “APOBEC-high”: tumors enriched for APOBEC mutagenesis; “APOBEC-low”: tumors not enriched for APOBEC mutagenesis.
Author contributions
APG, SDM, and JJM conceived the project ideas. JJM was responsible for project final design, supervision, interpretation of the data. APG, DF, and KR performed data collection and analysis. APG, JRP, YY, and YW performed cell culture and qPCR experiments. APG drafted the manuscript. All authors were involved in critical revision of the article and final approval of the version to be published.
ACKNOWLEDGMENTS
The results published here are in whole or part based upon data generated by the TCGA Research Network: http://cancergenome.nih.gov/. These results were presented in part at the American Urological Association 2017 meeting (Boston, MA; Abstract #17-3454).
De-identified publicly-available patient data used within this study was accessed from TCGA and BGI according to open access guidelines. The datasets analyzed during the current study are available in the cBioPortal repository (http://www.cbioportal.org/), Broad Genome Data Analysis Center (http://gdac.broadinstitute.org/), and Cancer Cell Line Encyclopedia (https://portals.broadinstitute.org/ccle).
CONFLICTS OF INTEREST
The authors declare no competing interest.
FUNDING
JJM is funded by a Veterans Health Administration Merit grant BX0033692-01. JJM and SDM are supported by the John P. Hanson Foundation for Cancer Research at the Robert H. Lurie Comprehensive Cancer Center of Northwestern University. Funding sources had no role in writing of the manuscript or the decision to submit it for publication.
REFERENCES
1. Lawrence MS, Stojanov P, Polak P, Kryukov GV, Cibulskis K, Sivachenko A, Carter SL, Stewart C, Mermel CH, Roberts SA, Kiezun A, Hammerman PS, McKenna A, et al. Mutational heterogeneity in cancer and the search for new cancer-associated genes. Nature. 2013; 499:214–18.
2. Roberts SA, Sterling J, Thompson C, Harris S, Mav D, Shah R, Klimczak LJ, Kryukov GV, Malc E, Mieczkowski PA, Resnick MA, Gordenin DA. Clustered mutations in yeast and in human cancers can arise from damaged long single-strand DNA regions. Mol Cell. 2012; 46:424–35.
3. Roberts SA, Lawrence MS, Klimczak LJ, Grimm SA, Fargo D, Stojanov P, Kiezun A, Kryukov GV, Carter SL, Saksena G, Harris S, Shah RR, Resnick MA, et al. An APOBEC cytidine deaminase mutagenesis pattern is widespread in human cancers. Nat Genet. 2013; 45:970–76.
4. Middlebrooks CD, Banday AR, Matsuda K, Udquim KI, Onabajo OO, Paquin A, Figueroa JD, Zhu B, Koutros S, Kubo M, Shuin T, Freedman ND, Kogevinas M, et al. Association of germline variants in the APOBEC3 region with cancer risk and enrichment with APOBEC-signature mutations in tumors. Nat Genet. 2016; 48:1330–38.
5. Burns MB, Lackey L, Carpenter MA, Rathore A, Land AM, Leonard B, Refsland EW, Kotandeniya D, Tretyakova N, Nikas JB, Yee D, Temiz NA, Donohue DE, et al. APOBEC3B is an enzymatic source of mutation in breast cancer. Nature. 2013; 494:366–70.
6. Shi K, Carpenter MA, Banerjee S, Shaban NM, Kurahashi K, Salamango DJ, McCann JL, Starrett GJ, Duffy JV, Demir O, Amaro RE, Harki DA, Harris RS, Aihara H. Structural basis for targeted DNA cytosine deamination and mutagenesis by APOBEC3A and APOBEC3B. Nat Struct Mol Biol. 2016; 24:131–39.
7. Harris RS, Petersen-Mahrt SK, Neuberger MS. RNA editing enzyme APOBEC1 and some of its homologs can act as DNA mutators. Mol Cell. 2002; 10:1247–53.
8. Mangeat B, Turelli P, Caron G, Friedli M, Perrin L, Trono D. Broad antiretroviral defence by human APOBEC3G through lethal editing of nascent reverse transcripts. Nature. 2003; 424:99–103.
9. Bonvin M, Achermann F, Greeve I, Stroka D, Keogh A, Inderbitzin D, Candinas D, Sommer P, Wain-Hobson S, Vartanian JP, Greeve J. Interferon-inducible expression of APOBEC3 editing enzymes in human hepatocytes and inhibition of hepatitis B virus replication. Hepatology. 2006; 43:1364–74.
10. Lada AG, Dhar A, Boissy RJ, Hirano M, Rubel AA, Rogozin IB, Pavlov YI. AID/APOBEC cytosine deaminase induces genome-wide kataegis. Biol Direct. 2012; 7:47.
11. Chan K, Roberts SA, Klimczak LJ, Sterling JF, Saini N, Malc EP, Kim J, Kwiatkowski DJ, Fargo DC, Mieczkowski PA, Getz G, Gordenin DA. An APOBEC3A hypermutation signature is distinguishable from the signature of background mutagenesis by APOBEC3B in human cancers. Nat Genet. 2015; 47:1067–72.
12. Henderson S, Fenton T. APOBEC3 genes: retroviral restriction factors to cancer drivers. Trends Mol Med. 2015; 21:274–84.
13. Swanton C, McGranahan N, Starrett GJ, Harris RS. APOBEC Enzymes: Mutagenic Fuel for Cancer Evolution and Heterogeneity. Cancer Discov. 2015; 5:704–12.
14. Burns MB, Temiz NA, Harris RS. Evidence for APOBEC3B mutagenesis in multiple human cancers. Nat Genet. 2013; 45:977–83.
15. Nikkilä J, Kumar R, Campbell J, Brandsma I, Pemberton HN, Wallberg F, Nagy K, Scheer I, Vertessy BG, Serebrenik AA, Monni V, Harris RS, Pettitt SJ, et al. Elevated APOBEC3B expression drives a kataegic-like mutation signature and replication stress-related therapeutic vulnerabilities in p53-defective cells. Br J Cancer. 2017; 117:113–23.
16. Cescon DW, Haibe-Kains B. DNA replication stress: a source of APOBEC3B expression in breast cancer. Genome Biol. 2016; 17:202.
17. Haradhvala NJ, Polak P, Stojanov P, Covington KR, Shinbrot E, Hess JM, Rheinbay E, Kim J, Maruvka YE, Braunstein LZ, Kamburov A, Hanawalt PC, Wheeler DA, et al. Mutational Strand Asymmetries in Cancer Genomes Reveal Mechanisms of DNA Damage and Repair. Cell. 2016; 164:538–49.
18. Tubbs A, Nussenzweig A. Endogenous DNA Damage as a Source of Genomic Instability in Cancer. Cell. 2017; 168:644–56.
19. Kanu N, Cerone MA, Goh G, Zalmas LP, Bartkova J, Dietzen M, McGranahan N, Rogers R, Law EK, Gromova I, Kschischo M, Walton MI, Rossanese OW, et al. DNA replication stress mediates APOBEC3 family mutagenesis in breast cancer. Genome Biol. 2016; 17:185.
20. Center BI. Analysis Overview for Bladder Urothelial Carcinoma (Primary solid tumor cohort) - 28 January 2016. Broad Institute of MIT and Harvard; 2016.
21. Bindea G, Mlecnik B, Tosolini M, Kirilovsky A, Waldner M, Obenauf AC, Angell H, Fredriksen T, Lafontaine L, Berger A, Bruneval P, Fridman WH, Becker C, et al. Spatiotemporal dynamics of intratumoral immune cells reveal the immune landscape in human cancer. Immunity. 2013; 39:782–95.
22. Faruki H, Mayhew GM, Serody JS, Hayes DN, Perou CM, Lai-Goldman M. Lung Adenocarcinoma and Squamous Cell Carcinoma Gene Expression Subtypes Demonstrate Significant Differences in Tumor Immune Landscape. J Thorac Oncol. 2017; 12:943–53.
23. Landry S, Narvaiza I, Linfesty DC, Weitzman MD. APOBEC3A can activate the DNA damage response and cause cell-cycle arrest. EMBO Rep. 2011; 12:444–50.
24. Mussil B, Suspène R, Aynaud MM, Gauvrit A, Vartanian JP, Wain-Hobson S. Human APOBEC3A isoforms translocate to the nucleus and induce DNA double strand breaks leading to cell stress and death. PLoS One. 2013; 8:e73641.
25. Zou L, Elledge SJ. Sensing DNA damage through ATRIP recognition of RPA-ssDNA complexes. Science. 2003; 300:1542–48.
26. Henderson S, Chakravarthy A, Su X, Boshoff C, Fenton TR. APOBEC-mediated cytosine deamination links PIK3CA helical domain mutations to human papillomavirus-driven tumor development. Cell Reports. 2014; 7:1833–41.
27. Kumar DT, Priya Doss CG. Role of E542 and E545 missense mutations of PIK3CA in breast cancer: a comparative computational approach. J Biomol Struct Dyn. 2016; 35:2745–2757.
28. Hurst CD, Alder O, Platt FM, Droop A, Stead LF, Burns JE, Burghel GJ, Jain S, Klimczak LJ, Lindsay H, Roulson JA, Taylor CF, Thygesen H, et al. Genomic Subtypes of Non-invasive Bladder Cancer with Distinct Metabolic Profile and Female Gender Bias in KDM6A Mutation Frequency. Cancer Cell. 2017; 32:701–715 e707.
29. Poon SL, Huang MN, Choo Y, McPherson JR, Yu W, Heng HL, Gan A, Myint SS, Siew EY, Ler LD, Ng LG, Weng WH, Chuang CK, et al. Mutation signatures implicate aristolochic acid in bladder cancer development. Genome Med. 2015; 7:38.
30. Refsland EW, Stenglein MD, Shindo K, Albin JS, Brown WL, Harris RS. Quantitative profiling of the full APOBEC3 mRNA repertoire in lymphocytes and tissues: implications for HIV-1 restriction. Nucleic Acids Res. 2010; 38:4274–84.
31. Van Allen EM, Mouw KW, Kim P, Iyer G, Wagle N, Al-Ahmadie H, Zhu C, Ostrovnaya I, Kryukov GV, O’Connor KW, Sfakianos J, Garcia-Grossman I, Kim J, et al. Somatic ERCC2 mutations correlate with cisplatin sensitivity in muscle-invasive urothelial carcinoma. Cancer Discov. 2014; 4:1140–53.
32. Liu D, Plimack ER, Hoffman-Censits J, Garraway LA, Bellmunt J, Van Allen E, Rosenberg JE. Clinical Validation of Chemotherapy Response Biomarker ERCC2 in Muscle-Invasive Urothelial Bladder Carcinoma. JAMA Oncol. 2016; 2:1094–96.
33. Plimack ER, Dunbrack RL, Brennan TA, Andrake MD, Zhou Y, Serebriiskii IG, Slifker M, Alpaugh K, Dulaimi E, Palma N, Hoffman-Censits J, Bilusic M, Wong YN, et al. Defects in DNA Repair Genes Predict Response to Neoadjuvant Cisplatin-based Chemotherapy in Muscle-invasive Bladder Cancer. Eur Urol. 2015; 68:959–67.
34. Evans JR, Zhao SG, Chang SL, Tomlins SA, Erho N, Sboner A, Schiewer MJ, Spratt DE, Kothari V, Klein EA, Den RB, Dicker AP, Karnes RJ, et al. Patient-Level DNA Damage and Repair Pathway Profiles and Prognosis After Prostatectomy for High-Risk Prostate Cancer. JAMA Oncol. 2016; 2:471–80.
35. Marx V. Drilling into big cancer-genome data. Nat Methods. 2013; 10:293–97.
36. Li B, Dewey CN. RSEM: accurate transcript quantification from RNA-Seq data with or without a reference genome. BMC Bioinformatics. 2011; 12:323.
37. Guo G, Sun X, Chen C, Wu S, Huang P, Li Z, Dean M, Huang Y, Jia W, Zhou Q, Tang A, Yang Z, Li X, et al. Whole-genome and whole-exome sequencing of bladder cancer identifies frequent alterations in genes involved in sister chromatid cohesion and segregation. Nat Genet. 2013; 45:1459–63.
38. Cerami E, Gao J, Dogrusoz U, Gross BE, Sumer SO, Aksoy BA, Jacobsen A, Byrne CJ, Heuer ML, Larsson E, Antipin Y, Reva B, Goldberg AP, et al. The cBio cancer genomics portal: an open platform for exploring multidimensional cancer genomics data. Cancer Discov. 2012; 2:401–04.
39. Barretina J, Caponigro G, Stransky N, Venkatesan K, Margolin AA, Kim S, Wilson CJ, Lehár J, Kryukov GV, Sonkin D, Reddy A, Liu M, Murray L, et al. The Cancer Cell Line Encyclopedia enables predictive modelling of anticancer drug sensitivity. Nature. 2012; 483:603–07.
40. Huber W, Carey VJ, Gentleman R, Anders S, Carlson M, Carvalho BS, Bravo HC, Davis S, Gatto L, Girke T, Gottardo R, Hahne F, Hansen KD, et al. Orchestrating high-throughput genomic analysis with Bioconductor. Nat Methods. 2015; 12:115–21.
41. Mayakonda A, Koeffler PH. Maftools: efficient analysis, visualization and summarization of MAF files from large-scale cohort based cancer studies. bioRxiv. 2016.
42. Madan V, Shyamsunder P, Han L, Mayakonda A, Nagata Y, Sundaresan J, Kanojia D, Yoshida K, Ganesan S, Hattori N, Fulton N, Tan KT, Alpermann T, et al. Comprehensive mutational analysis of primary and relapse acute promyelocytic leukemia. Leukemia. 2016; 30:1672–81.
43. Lawlor N, Fabbri A, Guan P, George J, Karuturi RK. multiClust: An R-package for Identifying Biologically Relevant Clusters in Cancer Transcriptome Profiles. Cancer Inform. 2016; 15:103–14.
44. Dadhania V, Zhang M, Zhang L, Bondaruk J, Majewski T, Siefker-Radtke A, Guo CC, Dinney C, Cogdell DE, Zhang S, Lee S, Lee JG, Weinstein JN, et al. Meta-Analysis of the Luminal and Basal Subtypes of Bladder Cancer and the Identification of Signature Immunohistochemical Markers for Clinical Use. EBioMedicine. 2016; 12:105–17.
45. Robinson MD, McCarthy DJ, Smyth GK. edgeR: a Bioconductor package for differential expression analysis of digital gene expression data. Bioinformatics. 2010; 26:139–40.
46. McCarthy DJ, Chen Y, Smyth GK. Differential expression analysis of multifactor RNA-Seq experiments with respect to biological variation. Nucleic Acids Res. 2012; 40:4288–97.
47. Huang W, Sherman BT, Lempicki RA. Systematic and integrative analysis of large gene lists using DAVID bioinformatics resources. Nat Protoc. 2009; 4:44–57.
48. Huang W, Sherman BT, Lempicki RA. Bioinformatics enrichment tools: paths toward the comprehensive functional analysis of large gene lists. Nucleic Acids Res. 2009; 37:1–13.
49. Chen EY, Tan CM, Kou Y, Duan Q, Wang Z, Meirelles GV, Clark NR, Ma’ayan A. Enrichr: interactive and collaborative HTML5 gene list enrichment analysis tool. BMC Bioinformatics. 2013; 14:128.
50. Kuleshov MV, Jones MR, Rouillard AD, Fernandez NF, Duan Q, Wang Z, Koplev S, Jenkins SL, Jagodnik KM, Lachmann A, McDermott MG, Monteiro CD, Gundersen GW, et al. Enrichr: a comprehensive gene set enrichment analysis web server 2016 update. Nucleic Acids Res. 2016; 44:W90–7.