
INTRODUCTION
Pancreatic ductal adenocarcinoma (PDAC) is the most frequent malignant tumor of the pancreas [1]. Diagnosis is based on imaging and tissue analysis of the primary tumor or metastases [2]. CA19-9, the only validated tumor marker for PDAC, has a limited sensitivity (79%) and specificity (82%) [3, 4]. Due to many efforts in recent years we have now a thorough understanding of the molecular setup of PDAC and the most frequently mutated genes including KRAS, TP53, SMAD4, and CDKN2A [5–7]. In patients with metastatic PDAC (mPDAC), 1 year survival has slightly improved because of the wider use of systemic chemotherapy, but the majority of patients die within a year of diagnosis [8–10]. There is increasing evidence that systemic treatment promotes a Darwinian type of evolution of a given tumor [11, 12]. To monitor this tumor evolution, we need simple tools that allow to repetitively inform on the current molecular setup of a given tumor and could be used to guide treatment thereby improving patients’ prognosis. One promising tool for this purpose is circulating tumor DNA (ctDNA), isolated from patients´ blood. ctDNA is released into the bloodstream by mechanisms including apoptosis, necrosis and active secretion [13]. Already in patients with benign cystic pancreatic tumors we recently were able to show, that ctDNA is tumor specific [14]. Moreover, in malignancy ctDNA analysis harbors prognostic information [15, 16]. The presence of ctDNA in the plasma of patients undergoing PDAC resection indicates poor prognosis [17]. The first studies on ctDNA in PDAC focused on KRAS mutations that are present in the majority of PDACs [18–20]. But for treatment associated tumor evolution more genomic alterations are likely to play a role. Currently, there are only limited data available from ctDNA analyses over and above KRAS profiling [17, 21].
Here, we employed targeted next generation sequencing of ctDNA, combined with droplet digital PCR to examine ctDNA as (i) a tool for noninvasive diagnosis and (ii) to inform on therapy induced tumor evolution in mPDAC during different lines of systemic treatment.
RESULTS
Assessment of PDAC mutational profile by tissue and ctDNA analysis
At first, we analyzed ctDNA at baseline prior to initiation of the respective line of treatment. Mutations in either of the genes examined were detectable in 16/20 patients (80%). 13 patients (65%) exhibited KRAS mutations, 10 patients (50%) mutations in TP53 and 1 patient (5%) a mutation in SMAD4 (Figure 1A and 1B).
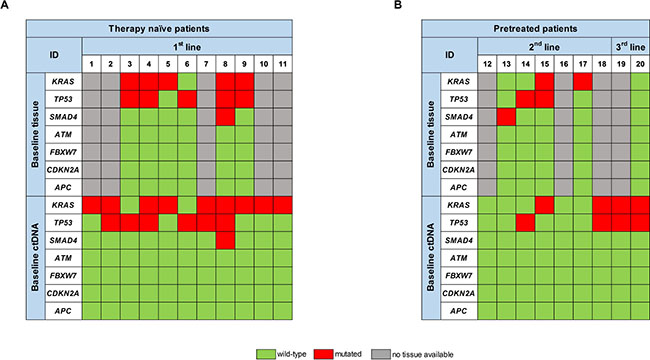
Figure 1: Comparison of the respective mutational spectrum detected by targeted sequencing of both archived FFPE tumor tissue material, taken at time-point of first diagnosis, and ctDNA, isolated from blood plasma at baseline, prior to initiation of the respective therapy line, for (A) therapy naïve patients and (B) pretreated patients.
In therapy naïve patients we detected KRAS mutations in 9/11 patients (82%), TP53 mutations in 6/11 patients (54%) and a SMAD4 mutation in 1/11 patients (9%). In 6 of these patients we also analyzed tumor tissue for comparison. 5/6 tumors exhibited KRAS mutations (83%), 5/6 tumors TP53 mutations and one tumor a SMAD4 mutation. 9/11 mutations that were present in the tumor, including double mutations, could also be detected in ctDNA prior to initiation of 1st line treatment. One KRAS and one TP53 mutation were only detectable in tumor tissue, resulting in an 82% tissue-blood concordance (Figure 1A).
We also analyzed ctDNA from patients in further lines of treatment (pretreated patients), where tissue from the primary tumor or metastases prior to 1st line treatment is likely to be less informative. Blood from 7 patients undergoing 2nd line and 2 patients undergoing 3rd line treatment was analyzed (Figure 1B). Prior to 2nd line treatment, we detected mutations in ctDNA of 3/7 patients (43%). From 4 of these patients FFPE material from tissue biopsy prior to 1st line treatment was available: There was at least one gene mutation detectable in the tumor tissue of all of these 4 patients. 3 of those (60%) were not detectable in ctDNA obtained prior to start of the 2nd line treatment. ctDNA analysis prior to the start of the 3rd line treatment revealed a KRAS and a TP53 mutation in both patients, whereas tumor tissue from the initial diagnosis was wild type for all genes analyzed (Figure 1B).
Effect of treatment on ctDNA allele frequencies and CA19-9 levels
Since all patients with detectable ctDNA at baseline had either a KRAS or a TP53 mutation and 96% of the mutations in ctDNA constituted either a KRAS or a TP53 mutation, the mutated allele frequencies (MAF) of these two genes were selected to form a combined MAF score (CMAF) that reflects the amount of ctDNA. In therapy naïve patients the median CMAF at baseline was 9.0% ± 7.4% and decreased significantly to 1.0% ± 1.0% upon treatment (Figure 2A, P = 0.0146). At disease progression, the median CMAF increased again to 7.6% ± 6.7% (P = 0.0633). The CA19-9 median baseline level was 467.25 IU/ml ± 466.45 IU/ml and decreased to 149.20 IU/ml ± 148.55 IU/ml (P = 0.7041) upon treatment. CA19-9 also increased at disease progression to 331.80 IU/ml ± 324.70 IU/ml. However, these differences in CA19-9 were not significant (P = 0.8468, Figure 2A).
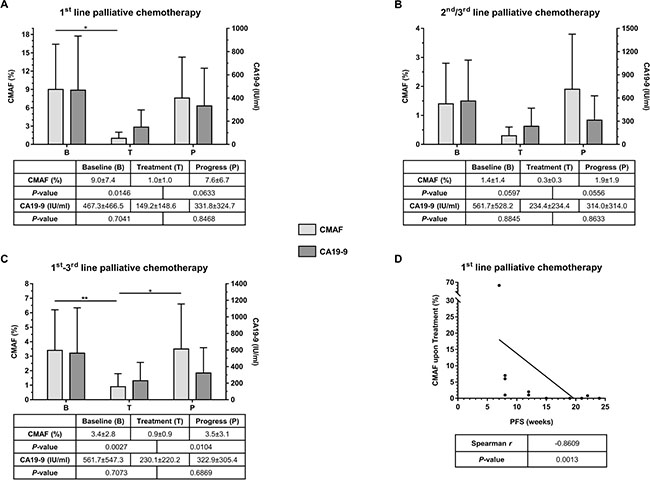
Figure 2: (A) Comparison of median CMAF and CA19-9 values at predefined time-points (B = Baseline, T = Treatment, and P = Progress) for patients under 1st line palliative chemotherapy (n = 11). (B) Comparison of median CMAF and CA19-9 values at predefined time-points (B = Baseline, T = Treatment, and P = Progress) for patients under 2nd and 3rd line palliative chemotherapy (n = 9). (C) Comparison of median CMAF and CA19-9 values at predefined time-points (B = Baseline, T = Treatment, and P = Progress) for all patients of the entire cohort (n = 20). (D) Correlation of CMAF upon treatment with progression-free survival (PFS); CMAF = combined mutational allele frequency of KRAS and TP53, values are %, given as median ± median absolute deviation.
In the cohort of patients that had already received chemotherapy the median CMAF at baseline, prior to initiation of the respective line of therapy was 1.4% ± 1.4%. This level decreased upon treatment to 0.3% ± 0.3% (Figure 2B, P = 0.0597). At disease progression, the median CMAF increased again to 1.9% ± 1.9% (P = 0.0556). In this situation, the median baseline level of CA19-9 was 561.7 IU/ml ± 528.2 IU/ml, and decreased to 234.4 IU/ml ± 234.4 IU/ml upon treatment (P = 0.8845). At disease progression CA19-9 raised again to 314.0 IU/ml ± 314.0 IU/ml (P = 0.8633, Figure 2B).
In summary, across all lines of treatment, CMAF dynamics, but not absolute values clearly reflected tumor evolution during palliative chemotherapy. Among the entire cohort, the median CMAF level significantly decreased (P = 0.0027) during treatment and, conversely, significantly increased again at disease progression (P = 0.0104; Figure 2C). CA19-9 analyses showed a similar trend but did not reach statistical significance (Figure 2C). In treatment naïve patients, the decline in the CMAF levels during treatment was predictive: A decline in CMAF in the ctDNA during therapy significantly correlated with progression-free survival of the patients (Spearman, r = −0.8609, P = 0.0013; Figure 2D). Of note, no differences in CMAF value and its change or PFS between the therapeutic regimen in 1st line treatment could be observed (data not shown).
Assessing PDAC evolution by sequential ctDNA analysis
By sequential ctDNA analyses during 1st line palliative chemotherapy we detected a change in the mutational landscape in 7/11 patients (64%) compared to baseline. A similar pattern was observed during 2nd and 3rd line treatment, where 3/7 (43%) and 2/2 (100%) of the patients exhibited a change in the mutational pattern of ctDNA compared to the baseline ctDNA status (Figure 3). This is shown in more detail for four patients in Figure 4A–4D.
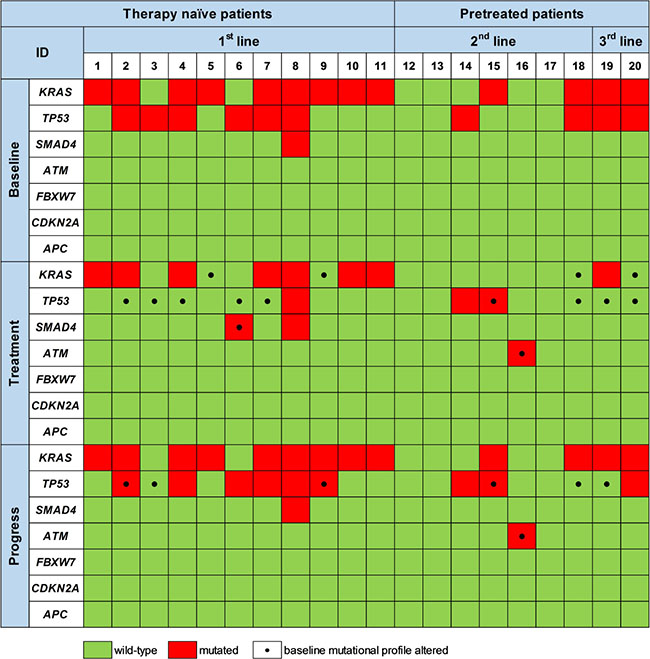
Figure 3: Mutations detected by targeted sequencing of ctDNA prior to therapy initiation (Baseline), upon treatment (Treatment) and at disease progression (Progress). Black dots at the respective time-point mark mutations that differ from the initial mutational profile generated at baseline prior to initiation of the respective therapy line.
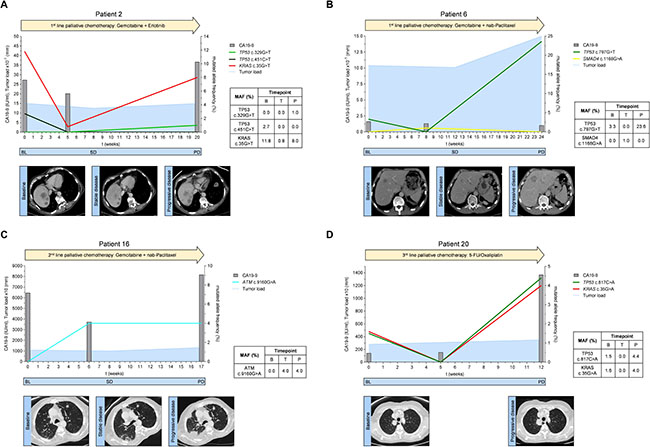
Figure 4: (A–D) Mutated allele frequencies, tumor marker CA19-9 levels and tumor load according to RECIST 1.1 for exemplary patients spanning the respective therapy line from baseline before therapy initiation to disease progression; BL = baseline, SD = stable disease, PD = progressive disease.
Patient 2 received 1st line palliative chemotherapy with gemcitabine and erlotinib (Figure 4A). Prior to treatment initiation, ctDNA analysis revealed a TP53 mutation (c.451C>T) and a KRAS mutation (c.35G>T). The mutational frequency of both TP53 and KRAS mutations dropped remarkably during treatment. This suggested a change in the clonal composition of the tumor that resulted in disease control (stable disease) as confirmed by a CT 8 weeks after therapy initiation. Cytotoxic chemotherapy in this patient obviously eliminated the TP53 mutated clone(s) (c.451C>T) which did not recur at disease progression 5 months after start of chemotherapy. However, at disease progression a new TP53 mutation (c.329G>T) was detectable in ctDNA. Also, the allele frequency of the KRAS mutation was markedly increased at that stage. CA19-9 levels showed a moderate drop at week 5 after initiation of treatment and increased again at progression.
Patient 6 received 1st line palliative chemotherapy with gemcitabine and nab-paclitaxel (Figure 4B). At baseline, ctDNA analysis showed a TP53 mutation (c.797G>A) which had also been detected in tumor tissue. 8 weeks after the start of treatment, the TP53 mutation was no longer detectable by ctDNA analysis and a CT scan at week 12 showed stable disease. Interestingly, a SMAD4 mutation (c.1168G>A) became detectable during treatment. At disease progression, the initial TP53 mutation was again detectable whereas the SMAD4 mutation disappeared. The CA19-9 value was not elevated at baseline and did also not change during the course of therapy (<32 IU/ml).
Patient 16 received gemcitabine and nab-paclitaxel as 2nd line treatment (Figure 4C). Prior to start of 2nd line treatment no mutations in the analyzed genes were detectable in ctDNA. After six weeks of treatment we observed a mutation in the ATM gene (c.9160G>A). The CA19-9 level was lower compared to baseline. At week 8 CT-scan suggested stable disease. However, a subsequent CT scan 9 weeks later stated disease progression and CA19-9 was elevated. The ATM mutation (c.9160G>A), but no other mutation was again detectable in ctDNA.
Patient 20 received 5-FU/oxaliplatin as a 3rd line palliative chemotherapy (Figure 4D). Tumor tissue from the initial diagnosis (primary tumor after resection) did not show any mutation in all analyzed genes. Conversely, the initial ctDNA analysis prior 3rd line treatment exhibited two mutations, one in TP53 (c.817C>A) and one in KRAS (c.35G>A) suggesting clonal selection during the previous lines of treatment. ctDNA analysis did not show these mutations at the first examination during treatment suggesting that cytotoxic chemotherapy in this patient temporarily suppressed the mutated TP53 and KRAS alleles. However, this effect was only transient and both mutations were again detectable at high levels 12 weeks after start of 3rd line chemotherapy when the disease was progressing. Concurrently, CA19-9 levels also increased at this time.
DISCUSSION
In 1983, Shapiro et al. were the first to report the presence of circulating cell-free DNA in the blood of patients with PDAC [22]. More than 20 years later other groups isolated and analyzed ctDNA (in particular KRAS genotyping) from patients with PDAC both in the metastatic [21] and the curative setting [23]. Here we examined the potential of targeted ctDNA genotyping beyond KRAS profiling in patients with metastatic PDAC in distinct clinical situations (therapy naïve and pretreated patients).
Among all analyzed genes in this study, we detected tumor-specific mutations in ctDNA in all treatment-naïve patients with 82% blood-tissue concordance. These data from a small cohort stress the power of ctDNA as a noninvasive tool for tumor diagnosis. Recently it was reported that only 48% of patients with advanced PDAC had detectable ctDNA. In this report the authors pooled the data of locally advanced and metastatic PDAC which may be responsible for the low percentage of ctDNA positivity [17]. In our study, only metastatic PDAC was analyzed. In the 2nd line setting, we detected fewer mutations in ctDNA than in the primary tumors. This may be due to the small sample size, but also due to a different clonal composition of the tumor in 2nd line compared to the primary tumor. Treatment could have largely eradicated these clones during 1st line treatment or the respective clones were not any more affected by the respective treatment and thereby there was no ctDNA released from apoptotic or necrotic cells, disabling analysis of ctDNA. We did not perform repeated tumor biopsies to further investigate this issue since they are cumbersome for the patient and may also yield only limited results due to intratumoral heterogeneity and consequently sampling errors as has been described for tumors [24]. Nevertheless, in the more advanced tumors (3rd line situation) ctDNA revealed mutations that were not detected by the analysis of the primary tumor. Thus, analysis of ctDNA gives an overview on the mutational state of the tumor at a certain time during treatment. Nevertheless, the sample capacity is low, thus the result of statistical analysis should be interpreted with caution and needs further validation.
Since ctDNA is easy to obtain, it may allow for monitor clonal evolution during chemotherapy. But data for PDAC are sparse [17, 19, 21, 25]. Single gene analysis for capturing of tumor evolution in mPDAC may be insufficient. Interestingly, we predominantly detected mutations in KRAS and TP53 in ctDNA but rarely mutations in other genes such as SMAD4 or ATM. This may also be due to the small sample size analyzed but also reflects the marked heterogeneity of PDAC. Previous studies reported on panels of 54 [21] or 22 [17] genes, but at least KRAS and TP53 also remained the most frequently mutated genes. Thus, we still need to define the optimal approach and/or gene set to define the molecular setup of a given tumor by ctDNA analysis. For assessing prognosis the number of mutated genes in ctDNA seems to have no impact as recently reported [17].
Given the frequent mutation of KRAS and TP53 we used these mutations to build a score, CMAF. This score performed better in assessing tumor evolution than CA19-9. Examination of KRAS and TP53 mutations in ctDNA over the course of treatment revealed, that upon disease stabilization during 1st line treatment, TP53 mutations were frequently not any more detectable. This could be due to suppression or even eradication of TP53 mutated clones by treatment. Interestingly, in the majority of cases a TP53 mutation reappeared upon disease progress in line with the well-known function of TP53 in tumor propagation [26]. The observed TP53 mutations in our case reports (Figure 4A and 4B) were recently described to be pathogenic in PDAC [27, 28]. TP53 plays also a role over the course of several lines of treatment. E.g. in patient 20 (Figure 4D), two novel mutations in KRAS and TP53 were detectable in ctDNA prior to 3rd line treatment suggesting that in some cases the initial TP53 clone was indeed eradicated by treatment but there was a selection of other low frequency alleles during therapy.
As mentioned, most of the mutations detectable either in tissue or in ctDNA were in KRAS and TP53 and mutations in other genes such as SMAD4 were only rarely detectable. Interestingly, these mutations may not always have an impact on disease progression since in one case a SMAD4 mutation occurred during treatment but was not detectable any more upon disease progress. Thus, tumor evolution is a dynamic system that has indeed traits of a Darwinian evolution with mutations that do not provide an advantage for the tumor disappearing whereas others that provide an advantage reappear and get selected.
Analysis of ctDNA in PDAC may in some cases provide an opportunity to guide treatment over time: In one patient (patient 16, Figure 4C), we detected a mutation in the ATM gene at the time of progression during 2nd line treatment with gemcitabine and nab-paclitaxel. This distinct mutation may have conferred resistance to the present treatment and is so far not described yet. Nevertheless, this may also make the tumor vulnerable to PARP inhibition [29], in particular since there was no TP53 mutation detectable either by tissue or by ctDNA analysis.
In conclusion, these data open the avenue for a molecular staging of PDAC using ctDNA both in therapy naïve and pretreated patients. ctDNA analysis can complement and extend tissue analysis and radiological assessment. The use of informed panels for targeted resequencing is likely to be insufficient for a comprehensive assessment of treatment induced PDAC evolution as a basis for a rational choice of a targeted treatment strategy. This is most likely due to the fact that driver mutations in PDAC are rather heterogeneous and occur at a low frequency in the whole set of tumors. Therefore, a more extensive analysis of ctDNA by whole exome sequencing and the incorporation of additional data from epigenetics and/or the metabolome maybe crucial to achieve this goal. Further prospective analyses are warranted to substantiate these hypotheses.
MATERIALS AND METHODS
Institutional review board
Prior to start of the study a positive vote from the institutional review board of Ulm University was obtained (Ulm University, Approval numbers: 317/12, 230/14, 128/15). Participation in the study was voluntary. All patients signed a written informed consent prior to inclusion.
Patient characteristics and study design
Twenty patients with histologically confirmed metastatic PDAC (UICC stage IV) were enrolled in this study. Patient characteristics are shown in Supplementary Data File 1. All patients received palliative chemotherapy: 11 patients were analyzed during 1st line, 7 patients during 2nd line and 2 patients during 3rd line treatment. Blood samples for ctDNA analyses were taken prospectively at predefined time points (“Baseline”: prior to treatment initiation; “Treatment”: 4.4 ± 0.4 weeks after treatment initiation; “Progress”: at radiologically confirmed disease progression). Archived FFPE tumor material from initial diagnosis was used for comparison. All ctDNA and tumor tissue DNA samples were analyzed by targeted next generation sequencing (NGS). The mutational status was validated by droplet digital PCR (ddPCR) when the NGS analysis of KRAS and TP53 was discordant between tumor tissue and ctDNA. Details of the molecular characteristics of the tumor tissue and ctDNA are provided in Supplementary Data File 2. CT-scans were done at baseline and at a mean of 9.6 ± 0.7 weeks during treatment (all according to RECIST 1.1). CA199 measurements were performed in parallel and at the same time points as ctDNA analyses (Roche Diagnostics Germany, Mannheim, Germany, normal value: <32 IU/ml).
Plasma collection
7.5 ml of whole venous blood were collected in EDTA tubes (Sarstedt, Nümbrecht, Germany) by peripheral blood draw, kept at 4°C until separation (within one hour after collection). Whole blood was centrifuged for 10 minutes (820 × g at 4°C), plasma fraction was transferred to cold 2ml tubes (Eppendorf RNA/DNA LoBind micro-centrifuge tubes, Eppendorf, Hamburg, Germany) and subsequently centrifuged again for 10 min (20.000 × g at 4°C). Pure plasma was recovered in fresh 2 ml tubes for immediate storage at −80°C until ctDNA extraction.
Extraction of ctDNA
ctDNA was extracted from plasma using the QIAamp Circulating Nucleic Acid Kit (QIAGEN, Hilden, Germany) according to the manufacturer’s instructions. For each patient, we used 2 ml of plasma for ctDNA extraction and recovered ctDNA in 50 μl of elution buffer. ctDNA was stored at −20°C until further use.
Isolation of tumor DNA from FFPE tissue
For isolation of genomic DNA from the FFPE tissue samples, 5 μm tissue slices were transferred to glass slides. To estimate the area containing the tumor, HE stained FFPE tissue slices (2 μm) were validated by an expert pathologist. The tumor-harboring areas of the FFPE tissue was subjected to a DNA extraction procedure using the QIAamp DNA FFPE tissue kit (QIAGEN, Hilden, Germany) according to manufacturer’s instruction. DNA purity and concentration was determined fluorometrically (Qubit 2.0; Invitrogen, Carlsbad, CA, USA).
Next generation sequencing
For molecular characterization of both tumor tissue and ctDNA, we employed a targeted re-sequencing methodology using the GeneRead V2 chemistry (QIAGEN, Hilden, Germany) and a custom-made re-sequencing panel including primers for all exons of TP53, SMAD4, CDKN2A, KRAS, APC, ATM, and FBXW7 (primer sequences and locations of target areas are available upon request). The mentioned genes were selected according to previously published data, covering the most frequently mutated genes in PDAC [5, 6]. Target enrichment, amplicon processing, and library generation were performed according to the manufacturer’s instructions. For target enrichment, we included 1ng (ctDNA) to 40 ng (DNA from FFPE tumor tissue). Successful target enrichment and library generation was checked using the High Sensitivity DNA kit on a bioanalyzer device (Agilent, Santa Clara, CA, USA). Libraries were diluted to 10 pM solutions and the sequencing was performed on a MiSeq platform (Illumina, San Diego, CA, USA) using the V2 chemistry. Mean read depth on target region was 2000–8000 fold and 99% of bases were covered at 96–100% on average. The resulting fastq files were subjected to further analysis using the GeneRead web based analysis tool (http://ngsdataanalysis.sabiosciences.com/NGS2/), the Biomedical Workbench software package (QIAGEN, Hilden, Germany), and the Variant Studio software (Illumina, San Diego, CA, USA). For the analysis of the fastq files and thus for the calling of the mutations we also used the CLC Biomedical Workbench. To be more precise, we used a Somatic Cancer (TAS) workflow termed Identify Variants (TAS). In this workflow variants are detected using the Low Frequency Variant Detection tool, which relies on statistical models to minimize calling of false positives. These two statistical models are a statistical model for the analyzed sample and a model for the sequencing errors described in more detailed in the CLC Biomedical Workbench manual (http://resources.qiagenbioinformatics.com/manuals/biomedicalgenomicsworkbench/current/index.php?manual=_Low_Frequency_Variant_caller_Models_methods.html). Moreover, the level of detection (LOD) of 1% was verified by spike in experiments using the Multiplex I cfDNA Reference Standard Set by (Horizon®).
Droplet digital PCR (ddPCR) analyses
Isolated ctDNA was amplified using ddPCR™ Supermix for Probes (Bio-Rad®, Hercules, CA, USA) and the respective PrimePCR™ ddPCR™ Mutation Assay (Bio-Rad®, Hercules, CA, USA). 8μl of eluate were used in each reaction and mixed with 2μl of primers/probes and 10μl of Supermix. The reaction mix was then vortexed and immediately transferred into a DG8™ Cartridge together with 70μl of Droplet Generation Oil for Probes for droplet generation in a QX200™ Droplet Generator (all: Bio-Rad®, Hercules, CA, USA). Droplets were carefully transferred into a 96-well plate, which was sealed with PX1™ PCR Plate Sealer for subsequent amplification in a T100™ Thermal Cycler according to the manufacturer’s instructions (all: Bio-Rad®, Hercules, CA, USA). Droplets were analyzed in QX200™ Droplet Reader (Bio-Rad®, Hercules, CA, USA) for fluorescent measurement of FAM and HEX probes. Gating was based on DNA standard (50% WT, 50% Mutant) by Horizon® and H20 as no-template-control. Thresholding was done based on positive and negative controls for each assay. False-positive-rates (FPR) were determined for each assay individually using wild-type reference DNA (Horizon®) in appropriate concentrations. Samples were called positive based on Poisson distribution when reaching 99% confidence level for being positive. Digital PCR data was analyzed by QuantaSoft analysis software (version 1.7.4) according to the manufacturer’s instructions (Bio-Rad®, Hercules, CA, USA).
Statistical analyses
Statistical analyses are based on a descriptive, hypothesis-generating approach. Results for continuous variables are presented as median ± median absolute deviation (MAD) or mean ± standard error of the mean (SEM) unless stated otherwise. Treatment groups were compared with the Mann-Whitney U-test. Comparison of categorical variables was generated by the Pearson χ2 test. Correlation analyses were performed by Pearson or Spearman correlation analysis, P values < 0.05 were considered significant. All statistical analyses were performed using GraphPad Prism version 7 (GraphPad Software, La Jolla, CA, USA).
Abbreviations
μl: Microliter; μm: Micrometer; APC: Adenomatous polyposis coli; ATM: ATM serine/threonine kinase; CA 19-9: Carbohydrate-Antigen 19-9; CDKN2A: Cyclin-Dependent Kinase Inhibitor 2A; CMAF: Combined Mutational Allele Frequency; CT: Computed Tomography; ctDNA: circulating tumor DNA; ddPCR: droplet digital Polymerase Chain Reaction; EDTA: Ethylenediaminetetraacetic Acid; FBXW7: F-box and WD repeat domain containing 7; FFPE: Formalin-Fixed, Paraffin-Embedded; FPR: False Positive Rate; IU/ml: International Unit/milliliter; KRAS: V-Ki-ras2 Kirsten rat sarcoma; MAD: Median Absolute Deviation; MAF: Mutational Allele Frequency; Min: Minute; mPDAC: metastatic Pancreatic Ductal Adenocarcinoma; ng: nanogram; NGS: Next Generation Sequencing; PCR: Polymerase Chain Reaction; PDAC: Pancreatic Ductal Adenocarcinoma; pM: pico Molar; RECIST: Response Evaluation Criteria in Solid Tumors; SEM: Standard Error of the Mean; SMAD4: SMAD family member 4; TP53: Tumor Protein 53; UICC: Union Internationale Contre le Cancer; WT: Wildtype.
Author contributions
Study concept and design: AWB, TS; Acquisition of data: AWB, DS, RM, SAS, TJE; Analysis and interpretation of data: AWB, DS, AK, RM, TS; Drafting of the manuscript: AWB, DS, RM, TS; Critical revision of the manuscript for important intellectual content: AWB, AK, RM, TS; Study supervision: RM, TS.
ACKNOWLEDGMENTS
The authors wish to thank Mrs. Magdalena Bienek-Ziolkowski, Mrs. Rosina Sing and Mr. Florian Beuter (AG Berger, Department of Internal Medicine I, Ulm University) and Mrs. Nina Ushmorov from the Institute of Pathology, Ulm University, for excellent technical assistance.
CONFLICTS OF INTEREST
The authors declare no potential conflicts of interest.
FUNDING
No third-party funding.
REFERENCES
1. Rahib L, Smith BD, Aizenberg R, Rosenzweig AB, Fleshman JM, Matrisian LM. Projecting cancer incidence and deaths to 2030: the unexpected burden of thyroid, liver, and pancreas cancers in the United States. Cancer research. 2014; 74:2913–2921.
2. Kamisawa T, Wood LD, Itoi T, Takaori K. Pancreatic cancer. Lancet. 2016; 388:73–85.
3. Huang Z, Liu F. Diagnostic value of serum carbohydrate antigen 19-9 in pancreatic cancer: a meta-analysis. Tumour Biol. 2014; 35:7459–7465.
4. Ballehaninna UK, Chamberlain RS. The clinical utility of serum CA 19-9 in the diagnosis, prognosis and management of pancreatic adenocarcinoma: An evidence based appraisal. J Gastrointest Oncol. 2012; 3:105–119.
5. Waddell N, Pajic M, Patch AM, Chang DK, Kassahn KS, Bailey P, Johns AL, Miller D, Nones K, Quek K, Quinn MC, Robertson AJ, Fadlullah MZ, et al. Whole genomes redefine the mutational landscape of pancreatic cancer. Nature. 2015; 518:495–501.
6. Witkiewicz AK, McMillan EA, Balaji U, Baek G, Lin WC, Mansour J, Mollaee M, Wagner KU, Koduru P, Yopp A, Choti MA, Yeo CJ, McCue P, et al. Whole-exome sequencing of pancreatic cancer defines genetic diversity and therapeutic targets. Nat Commun. 2015; 6:6744.
7. Bailey P, Chang DK, Nones K, Johns AL, Patch AM, Gingras MC, Miller DK, Christ AN, Bruxner TJ, Quinn MC, Nourse C, Murtaugh LC, Harliwong I, et al. Genomic analyses identify molecular subtypes of pancreatic cancer. Nature. 2016; 531:47–52.
8. Cunningham D, Chau I, Stocken DD, Valle JW, Smith D, Steward W, Harper PG, Dunn J, Tudur-Smith C, West J, Falk S, Crellin A, Adab F, et al. Phase III randomized comparison of gemcitabine versus gemcitabine plus capecitabine in patients with advanced pancreatic cancer. J Clin Oncol. 2009; 27:5513–5518.
9. Conroy T, Desseigne F, Ychou M, Bouche O, Guimbaud R, Becouarn Y, Adenis A, Raoul JL, Gourgou-Bourgade S, de la Fouchardiere C, Bennouna J, Bachet JB, Khemissa-Akouz F, et al. FOLFIRINOX versus gemcitabine for metastatic pancreatic cancer. N Engl J Med. 2011; 364:1817–1825.
10. Von Hoff DD, Ervin T, Arena FP, Chiorean EG, Infante J, Moore M, Seay T, Tjulandin SA, Ma WW, Saleh MN, Harris M, Reni M, Dowden S, et al. Increased survival in pancreatic cancer with nab-paclitaxel plus gemcitabine. N Engl J Med. 2013; 369:1691–1703.
11. Nowell PC. The clonal evolution of tumor cell populations. Science. 1976; 194:23–28.
12. Gatenby RA, Cunningham JJ, Brown JS. Evolutionary triage governs fitness in driver and passenger mutations and suggests targeting never mutations. Nat Commun. 2014; 5:5499.
13. Crowley E, Di Nicolantonio F, Loupakis F, Bardelli A. Liquid biopsy: monitoring cancer-genetics in the blood. Nat Rev Clin Oncol. 2013; 10:472–484.
14. Berger AW, Schwerdel D, Costa IG, Hackert T, Strobel O, Lam S, Barth TF, Schroppel B, Meining A, Buchler MW, Zenke M, Hermann PC, Seufferlein T, Kleger A. Detection of Hot-Spot Mutations in Circulating Cell-Free DNA From Patients With Intraductal Papillary Mucinous Neoplasms of the Pancreas. Gastroenterology. 2016; 151:267–270.
15. Schwarzenbach H, Hoon DS, Pantel K. Cell-free nucleic acids as biomarkers in cancer patients. Nat Rev Cancer. 2011; 11:426–437.
16. Forshew T, Murtaza M, Parkinson C, Gale D, Tsui DW, Kaper F, Dawson SJ, Piskorz AM, Jimenez-Linan M, Bentley D, Hadfield J, May AP, Caldas C, et al. Noninvasive identification and monitoring of cancer mutations by targeted deep sequencing of plasma DNA. Sci Transl Med. 2012; 4:136ra168.
17. Pietrasz D, Pecuchet N, Garlan F, Didelot A, Dubreuil O, Doat S, Imbert-Bismut F, Karoui M, Vaillant JC, Taly V, Laurent-Puig P, Bachet JB. Plasma Circulating Tumor DNA in Pancreatic Cancer Patients Is a Prognostic Marker. Clin Cancer Res. 2017; 23:116–123.
18. Kinde I, Wu J, Papadopoulos N, Kinzler KW, Vogelstein B. Detection and quantification of rare mutations with massively parallel sequencing. Proc Natl Acad Sci USA. 2011; 108:9530–9535.
19. Sausen M, Phallen J, Adleff V, Jones S, Leary RJ, Barrett MT, Anagnostou V, Parpart-Li S, Murphy D, Kay Li Q, Hruban CA, Scharpf R, White JR, et al. Clinical implications of genomic alterations in the tumour and circulation of pancreatic cancer patients. Nat Commun. 2015; 6:7686.
20. Takai E, Totoki Y, Nakamura H, Kato M, Shibata T, Yachida S. Clinical Utility of Circulating Tumor DNA for Molecular Assessment and Precision Medicine in Pancreatic Cancer. Adv Exp Med Biol. 2016; 924:13-17.
21. Zill OA, Greene C, Sebisanovic D, Siew LM, Leng J, Vu M, Hendifar AE, Wang Z, Atreya CE, Kelley RK, Van Loon K, Ko AH, Tempero MA, et al. Cell-Free DNA Next-Generation Sequencing in Pancreatobiliary Carcinomas. Cancer Discov. 2015; 5:1040–1048.
22. Shapiro B, Chakrabarty M, Cohn EM, Leon SA. Determination of circulating DNA levels in patients with benign or malignant gastrointestinal disease. Cancer. 1983; 51:2116–2120.
23. Hadano N, Murakami Y, Uemura K, Hashimoto Y, Kondo N, Nakagawa N, Sueda T, Hiyama E. Prognostic value of circulating tumour DNA in patients undergoing curative resection for pancreatic cancer. Br J Cancer. 2016; 115:59–65.
24. Gerlinger M, Rowan AJ, Horswell S, Larkin J, Endesfelder D, Gronroos E, Martinez P, Matthews N, Stewart A, Tarpey P, Varela I, Phillimore B, Begum S, et al. Intratumor heterogeneity and branched evolution revealed by multiregion sequencing. N Engl J Med. 2012; 366:883–892.
25. Bettegowda C, Sausen M, Leary RJ, Kinde I, Wang Y, Agrawal N, Bartlett BR, Wang H, Luber B, Alani RM, Antonarakis ES, Azad NS, Bardelli A, et al. Detection of circulating tumor DNA in early- and late-stage human malignancies. Sci Transl Med. 2014; 6:224ra224.
26. Notta F, Chan-Seng-Yue M, Lemire M, Li Y, Wilson GW, Connor AA, Denroche RE, Liang SB, Brown AM, Kim JC, Wang T, Simpson JT, Beck T, et al. A renewed model of pancreatic cancer evolution based on genomic rearrangement patterns. Nature. 2016; 538:378–382.
27. Jones S, Zhang X, Parsons DW, Lin JC, Leary RJ, Angenendt P, Mankoo P, Carter H, Kamiyama H, Jimeno A, Hong SM, Fu B, Lin MT, et al. Core signaling pathways in human pancreatic cancers revealed by global genomic analyses. Science. 2008; 321:1801–1806.
28. Biankin AV, Waddell N, Kassahn KS, Gingras MC, Muthuswamy LB, Johns AL, Miller DK, Wilson PJ, Patch AM, Wu J, Chang DK, Cowley MJ, Gardiner BB, et al. Pancreatic cancer genomes reveal aberrations in axon guidance pathway genes. Nature. 2012; 491:399–405.
29. Bang YJ, Im SA, Lee KW, Cho JY, Song EK, Lee KH, Kim YH, Park JO, Chun HG, Zang DY, Fielding A, Rowbottom J, Hodgson D, et al. Randomized, Double-Blind Phase II Trial With Prospective Classification by ATM Protein Level to Evaluate the Efficacy and Tolerability of Olaparib Plus Paclitaxel in Patients With Recurrent or Metastatic Gastric Cancer. J Clin Oncol. 2015; 33:3858–3865.