
INTRODUCTION
Fibrolamellar hepatocellular carcinoma (FLC) receives its name from the distinct intratumoral lamellar bands of collagen that are visualized interspersed between large polygonal cells with vesiculated nuclei and large nucleoli on H&E images [1, 2]. While classified as a variant of conventional hepatocellular carcinoma (HCC), FLC differs in a number of important ways. FLC is typically found in adolescents and young adults without underlying liver disease, such as viral hepatitis or cirrhosis [2–4], and elevations in serum alpha fetoprotein (AFP) are not typically seen. Additionally, FLC has fewer chromosomal changes, less genomic heterogeneity and fewer mutations compared to HCC [5, 6]. Finally, the changes in the transcriptome and proteome in the FLC tumor are distinct from those in HCC [7].
The first key to the pathogenesis of FLC was the identification of a deletion of ~400 kD in one copy of chromosome 19 in the tumor tissue but not in the adjacent normal liver tissue [8]. The deletion was found in all tumor samples in the absence of any other significant recurrent changes in the genomic DNA [9], but not in surrounding paired normal liver parenchyma. The deletion results in a fusion gene of the first exon of a heat shock protein, DNAJB1, with the second through tenth exon of the catalytic subunit of protein kinase A, PRKACA. A chimeric RNA transcript and protein were found in the tumor tissue of every patient tested. This chimeric fusion protein retains the full enzymatic kinase activity [8]. The DNAJB1-PRKACA chimera has since been validated in several studies and may be considered as a defining mutation in this cancer [7, 8, 10, 11]. While the rest of the genomic DNA of FLC is relatively unremarkable, the transcriptome reveals many upregulated oncologically relevant pathways, including epidermal growth factor ((EGF), v-Erb-B2 Avian Erythroblastic Leukemia Viral Oncogene (ErbB), Aurora Kinase A and Wingless type integration (wnt) site family of signaling proteins [7]. These transcriptomic signatures are remarkable both in the magnitude of some of the changes as well as the consistency from patient-to-patient.
Non-coding RNAs, both microRNA (miRNA) and long-noncoding RNA (lncRNA) have been implicated to play major roles in biology ranging from embryology to cancer development. It has been estimated that up to 60% of the human genome may be under miRNA regulation [12–14]. Increasingly, the dysregulation of miRNA has been demonstrated in various cancers, and can function similarly to oncogenes and tumor suppressor genes [15]. Review of miRNA differential expression across a broad spectrum of tumors and their respective normal tissues have shown varied miRNA profiles with the ability to interact at multiple steps in a diverse set of cellular pathways [15, 16]. Additionally, miRNA have been implicated as distinct regulators of metastases [17].
LncRNAs are typically > 200 nucleotides and are not believed to be translated into proteins. Many lncRNAs are conserved through evolution, suggesting they may have a functional role. They have been shown to affect the transcription of specific genes, regulate mRNA processing, control alternative splicing, regulate protein translation, and be involved in epigenetic modification of DNA. LncRNAs have already been implicated in cancers such as leukemia, colorectal carcinoma, and in liver cancer [18–20]. Over the past ten years changes in specific lncRNAs have been shown to not only correlate with progression and outcome [21] but have been demonstrated to affect PTEN expression [22] as well as implied to play a role in metastasis [23].
To gain further understanding of the tumor biology, we investigated non-coding RNA in FLC. An examination of the lncRNA in FLC, in contrast to the adjacent normal tissue, showed distinct increases in specific transcripts. The pattern of changes was consistent across patients and distinct from changes previously reported in hepatocellular carcinoma or cholangiocarcinoma. Some lncRNA, which where found to be significantly increased in other liver cancers, such as HULC (highly upregulated in liver cancer), HOTAIR and HOTTIP only showed a mild increase in FLC; while others, such as H19, showed a decrease. An examination of miRNA in FLC tissue, in contrast to the adjacent normal tissue was conducted and demonstrated 176 mature miRNA that were changed significantly in their expression levels, |log2 fold change| > 1, FDR <0.01. A number of these miRNA have been previously implicated, from other systems, in the regulation of the level of coding changes in specific target genes. For example, miR-548p was decreased in FLC and a known target, the mRNA for FZD10, is significantly increased in FLC. To test if this was a correlation or a causal relationship, the level of miRNA was increased by over-expression or decreased by expression of a miRZip miRNA. The results demonstrate that at least some of the changes in the miRNA in FLC may be responsible for the changes observed in the coding transcriptome.
RESULTS
A pathologist experienced in the diagnosis of liver tumors (UKB) reviewed the histology from all FLC tumor samples. In all cases the FLC tumor tissue was distinguished by the presence of lamellar bands and large polygonal cells which were absent in the adjacent normal tissue on H&E (Figure 1). The tumor and adjacent normal liver tissues were tested for the presence of the DNAJB1-PRKACA chimeric transcript at the RNA level by PCR. The chimeric transcript was found in all of the tumor tissue samples, but not detected in the adjacent normal tissue (Figure 2).
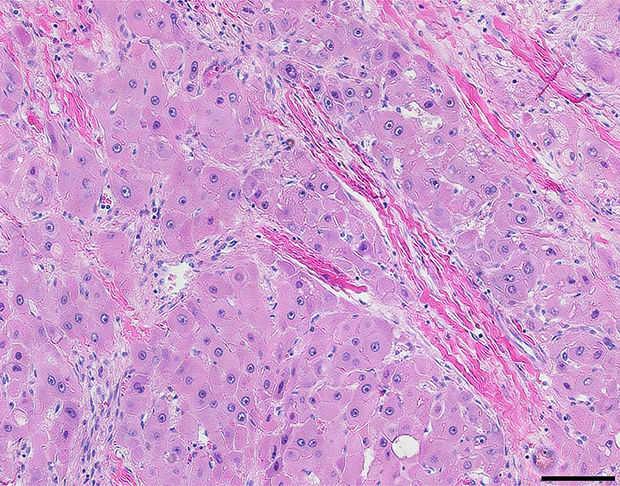
Figure 1: Hematoxylin and eosin stained FLC tumor tissue showing large polygonal cells with vesiculated nuclei, large nucleoli and intratumoral lamellar bands of collagen. Scale bar = 100 μm.
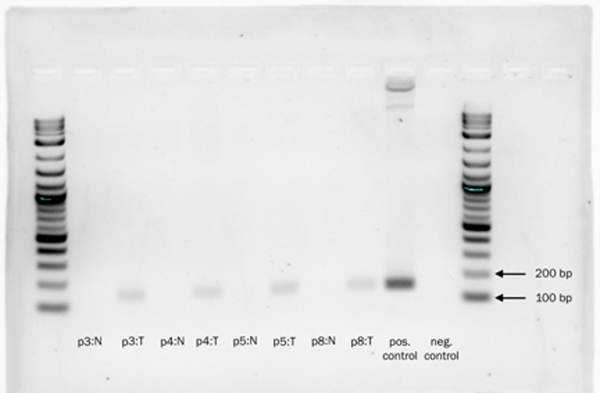
Figure 2: 2% agarose gel demonstrating the presence of the DNAJB1-PRKACA chimeric transcript in tumor tissues (T = tumor), but not in adjacent normal liver samples (N = Normal). Log2 ladder. Expected amplicon 148 bp.
The expression patterns of the miRNA, as quantified by RNA-Seq, in the FLC tissue were distinct from those seen in adjacent normal liver tissues and similar between tumor samples from different patients as evidenced by principal component analysis (Figure 3) and heat map unsupervised hierarchical distance clustering (Figure 4). Analysis from paired FLC tumor and adjacent normal liver samples (n = 7) showed 176 mature miRNA that were differentially expressed with an absolute log2 fold change ≥1 and a False Discovery Rate (FDR) ≤0.01 (Supplementary Table 1). Eighty-seven miRNA were under-expressed and 89 had increased expression in the FLC tumor samples as compared to paired adjacent normal liver samples (Figure 5). The differential expression observed in RNA-Seq was confirmed by qPCR for five miRNA. The log2 fold-change (tumor vs. normal) expression values as quantified by qPCR and RNA-Seq were similar (Figure 6, R2 = 0.92).
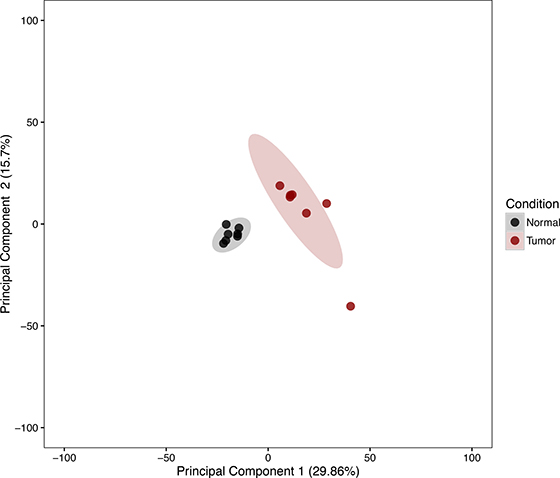
Figure 3: Principal component analysis of variance stabilized transformed miRNA RNA-Seq read counts of Tumor and Normal Samples. Ellipses note 95% confidence interval. Axis percentages indicate variance contribution.
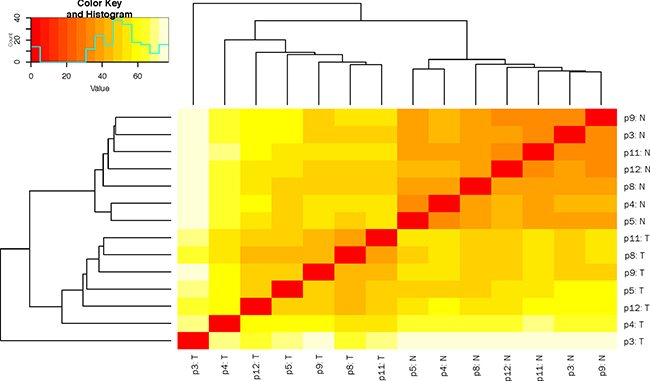
Figure 4: Heat map depicting hierarchical clustering of sample-to-sample distance of variance stabilized transformed small RNA-Seq read counts. T = tumor, N = normal
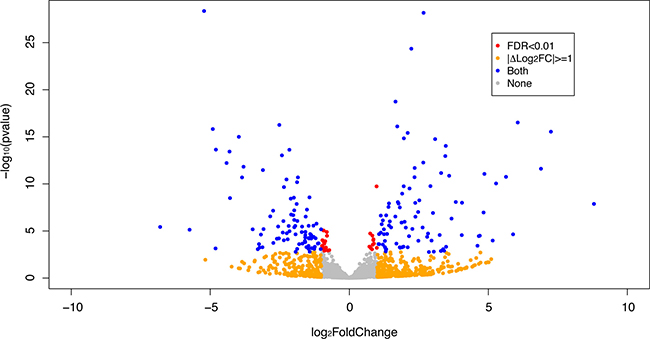
Figure 5: Volcano plot depicting differential expression results of miRNA in FLC tumor samples compared to paired adjacent normal liver. Orange dots show |Log2 fold change |≥ 1, red dots show FDR ≤ 0.01 and blue dots correspond to miRNA that are both |Log2 fold change | ≥ 1 and FDR ≤ 0.01. Grey dots correspond to miRNA that do not meet any of the mentioned criteria.
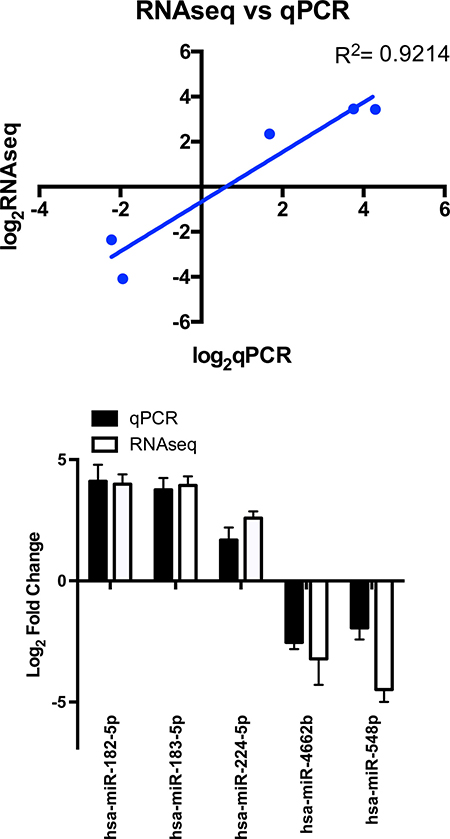
Figure 6: miRNA expression as assayed by RNAseq (n = 7) and qPCR (n = 5–8). qPCR data analyzed using the ΔΔCT method referenced to SNORD42b. Bar graph shows Log2 fold change values yielded from RNAseq and qPCR for the same miRNA (R2 = 0.92), error bars indicate standard deviation.
Differentially expressed mature miRNAs identified in the FLC tumor samples relative to adjacent normal liver were uploaded into DIANA miRPath microT-CDS v.3 [24] as separate data sets to identify their enrichment within various KEGG pathways. Using this method, the under-expressed mature miRNA showed enrichment of 49 KEGG pathways p-values at least <0.05, with correction for multiple testing using the FDR approach (Table 1). The over-expressed mature miRNAs yielded enrichment of 79 different KEGG pathways (Table 2). Numerous oncologically relevant KEGG pathways were highlighted between the two sets of analyses including Hippo, ErbB, and wnt signaling, among others. Many of these pathways, such as the EGF/ErbB2 and wnt pathways have already been shown to overexpressed in FLC in transcriptomic analysis.
Table 1: Top twenty-five KEGG pathways enriched with miRNA with Log2 fold change ≤-1 and FDR ≤ 0.01 in FLC tumors compared to normal liver as found in DIANA miRPath v3 Genes Union analysis. P-values corrected for multiple testing with FDR approach
KEGG pathway |
p-value |
#genes |
#miRNAs |
|---|---|---|---|
Mucin type O-Glycan biosynthesis |
1.98E-16 |
26 |
35 |
Hippo signaling pathway |
2.05E-07 |
117 |
74 |
Fatty acid biosynthesis |
3.99E-07 |
10 |
24 |
TGF-beta signaling pathway |
3.99E-07 |
65 |
65 |
Axon guidance |
1.51E-06 |
96 |
69 |
Pathways in cancer |
2.07E-06 |
288 |
81 |
Focal adhesion |
6.78E-06 |
158 |
76 |
Renal cell carcinoma |
1.69E-05 |
56 |
69 |
ErbB signaling pathway |
1.69E-05 |
69 |
71 |
Proteoglycans in cancer |
5.95E-05 |
144 |
74 |
Glutamatergic synapse |
3.59E-04 |
85 |
67 |
N-Glycan biosynthesis |
5.40E-04 |
36 |
56 |
Gap junction |
5.40E-04 |
67 |
67 |
Adherens junction |
5.40E-04 |
57 |
68 |
Endocytosis |
8.08E-04 |
150 |
77 |
Colorectal cancer |
1.05E-03 |
50 |
66 |
Thyroid hormone signaling pathway |
1.61E-03 |
86 |
75 |
Rap1 signaling pathway |
1.61E-03 |
149 |
79 |
Ras signaling pathway |
1.98E-03 |
159 |
77 |
Ubiquitin mediated proteolysis |
2.07E-03 |
100 |
69 |
Wnt signaling pathway |
2.07E-03 |
102 |
72 |
Arrhythmogenic right ventricular cardiomyopathy (ARVC) |
2.17E-03 |
51 |
60 |
Estrogen signaling pathway |
2.26E-03 |
71 |
68 |
Regulation of actin cytoskeleton |
2.66E-03 |
154 |
80 |
Morphine addiction |
2.97E-03 |
67 |
75 |
Table 2: Top twenty-five KEGG pathways enriched with miRNA with Log2 fold change >1 and FDR < 0.01 in FLC tumors compared to normal liver as found in DIANA miRPath v3 Genes Union analysis
KEGG pathway |
p-value |
#genes |
#miRNAs |
|---|---|---|---|
Proteoglycans in cancer |
5.30E-10 |
153 |
75 |
Bacterial invasion of epithelial cells |
3.98E-07 |
68 |
66 |
Amphetamine addiction |
7.48E-07 |
52 |
61 |
Pathways in cancer |
7.48E-07 |
280 |
78 |
Glioma |
1.57E-06 |
53 |
64 |
Hippo signaling pathway |
1.78E-06 |
113 |
68 |
Renal cell carcinoma |
2.55E-06 |
55 |
64 |
Prolactin signaling pathway |
2.57E-06 |
58 |
62 |
ECM-receptor interaction |
3.35E-06 |
56 |
62 |
Endocytosis |
8.70E-06 |
150 |
74 |
ErbB signaling pathway |
2.07E-05 |
70 |
73 |
Adherens junction |
4.36E-05 |
59 |
68 |
Estrogen signaling pathway |
4.97E-05 |
74 |
70 |
Morphine addiction |
5.88E-05 |
69 |
64 |
Oxytocin signaling pathway |
5.88E-05 |
119 |
70 |
Cocaine addiction |
5.96E-05 |
37 |
59 |
N-Glycan biosynthesis |
7.75E-05 |
37 |
51 |
Focal adhesion |
1.57E-04 |
151 |
74 |
Pancreatic cancer |
1.66E-04 |
52 |
63 |
Rap1 signaling pathway |
1.66E-04 |
152 |
73 |
GABAergic synapse |
2.55E-04 |
68 |
61 |
Thyroid hormone signaling pathway |
2.80E-04 |
89 |
68 |
TGF-beta signaling pathway |
3.27E-04 |
59 |
61 |
Glutamatergic synapse |
3.28E-04 |
82 |
70 |
P-values corrected for multiple testing with FDR approach.
One miRNA, miR-548p, which was highly down-regulated in FLC (Δlog2 = −4.41, padj = 3.36 × 10⁻¹¹), had target RNA transcripts predicted by DIANA that were previously described to be over-expressed in FLC tumor samples [7], in particular, the Frizzled 10 receptor (FZD10), a receptor of the wnt family. FZD10 mRNA is increased in FLC tumor relative to the adjacent normal tissue by Δlog2 = 6.13 with padj = 3.08 × 10⁻²⁰ and the FZD10 protein is also increased in the FLC tumor (7). To examine whether there was a causal or corollary relationship between the changes in the non-coding RNA and changes in transcription, we tested if the relationship between the decreased expression of miR-548p and increased expression of FZD10. We increased expression of miR-548p via transduction with a pre-miRNA or decreased expression via transduction with an anti-miRNA (miRZip/MicroRNA Precursor Construct, System Biosciences, Palo Alto, CA) in the human heptatoma cell line, Huh7. The effects of over expressing the miRNA or miRZip on the expression of FZD10 were assayed by quantitative PCR and western blot (Figures 7–9). When miRZip was used to reduce miR-548p in Huh7 cells, we observed that the mRNA for FZD10 increased 2.12 times as referenced to beta 2 microglobulin (β2M) (p = 0.026, Figure 8 black bar). Likewise, the protein levels of FZD10 increased in comparison to Huh7 cells treated with scramble sequence (Figure 9). When Huh7 cells were transduced to increase expression of miR-548p, using a lentiviral microRNA precursor construct, we found the transcript of FZD10 was down regulated 0.48 times as referenced to β2M (p = 0.024) (Figures 7, 8, grey bar). Immunoblots of FZD10 in Huh7 cells treated with miRZip 548p show over expression of FZD10 in comparison to Huh7 cells treated with scramble sequence (Figure 9). The demonstration that decreasing miR-548p results in an increase of FZD10 and increasing miR-548p results in a decrease of FZD10, suggests a causal inverse relationship between this miRNA and the expression of this frizzled receptor in Huh7 cells.
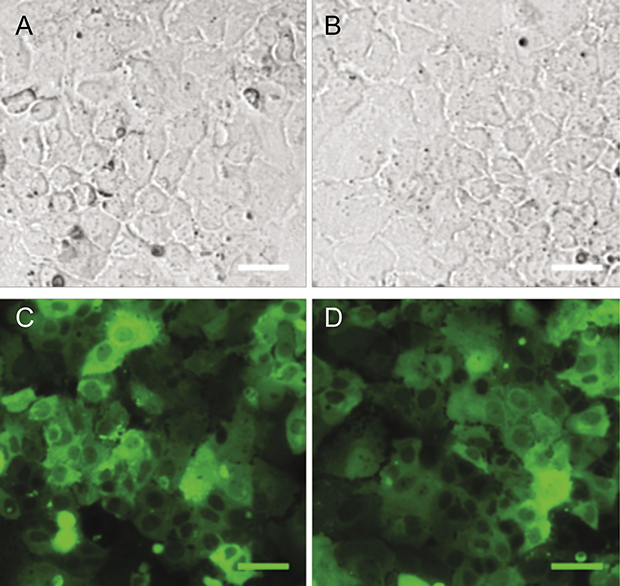
Figure 7: Verification of miRZip delivery. Bright field 10× of Huh-7 cells transduced with lentivirus miRZip-548p (A) and lentivirus miRZip-scramble (B) and corresponding epifluorescent GFP images of the same field of cells (C, D). Scale bar = 50 μm
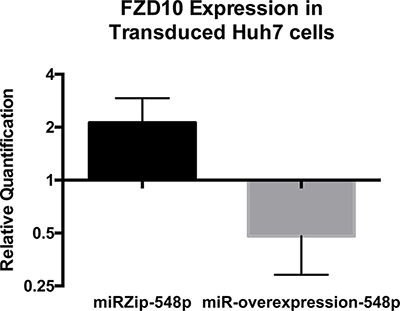
Figure 8: qPCR results of Frizzled 10 expression in Huh7 cells after transduction with miRZip-548p or miR548p over expression as compared to cells transduced with scramble sequence virus in biological triplicate (p = 0.026 and p = 0.024 respectively). miRZip-548p treated cells show over expression of FZD10, whereas over expression of miR-548p showed decrease in FZD10 in Huh7 cells. Analysis performed using the ΔΔCT method as referenced to human β2-microglobulin. Statistical analysis performed with 2 tailed t-test. Error bars represent standard deviation.
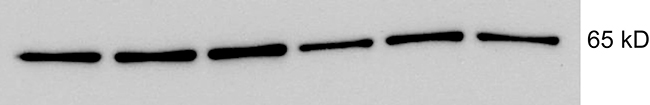
Figure 9: Immunoblot of FZD10 from lysates of Huh7 cells transduced with miRZip 548p (lanes 1–3) or scramble sequence (lanes 4–6) showing overexpression of FZD10 in cells transduced with miRZip 548p. Expected molecular weight 65kD.
We next focused our attention to the lncRNA to determine if they similarly show a statistically significant change between FLC and adjacent normal liver. Over 600 lncRNA significantly changed in expression ((|Δlog2|>1, padj < 0.01) (Supplementary Table 2 and a subset are given in Table 3). These changes in lncRNA, in general, did not correspond with those previously reported for other liver cancers, or any other cancers. Most of the most highly upregulated lncRNA have not been previously implicated in tumors and little is known of the functions of these lncRNA. In contrast, many lncRNA that are strongly increased in other liver cancers, did not increase in FLC. Some, such as HULC, were only slightly increased (Δlog2 = 1.45, padj = 1.5 × 10–03) in FLC, others such as HOTTAIR, were not increased (Δlog2 = 0.47, padj = not significant), and others, such as H19 were decreased (Δlog2 = −3.66 padj = 1.39 × 10⁻⁹).
Table 3. Differential expression of a subset of lncRNA which either have been implicated in other liver cancers or which show in FLC an absolute Log2 fold change ≥1 and FDR < 0.01 (complete table of lncRNA in FLC with significant changes is in Supplementary Table 2)
ENSEMBL (GRCh37/hg19) |
ENSEMBL Name |
GeneName |
Log2FC |
p value |
p adjusted (FDR) |
|---|---|---|---|---|---|
ENSG00000233179.1 |
Z82249.1 |
RP11-536P6.3 |
11.09 |
1.5E-21 |
4.8E-19 |
ENSG00000249111.1 |
AC108517.1 |
RP11-622J8.1 |
10.85 |
1.9E-21 |
5.9E-19 |
ENSG00000255327.1 |
AP003062.1 |
RP11-555G19.1 |
9.27 |
7.1E-22 |
2.3E-19 |
ENSG00000261182 |
AL596211.1 |
RP11-201A3.1 |
8.92 |
5.1E-67 |
2.1E-63 |
ENSG00000227674.1 |
LINC00355 |
LINC00355 |
8.45 |
3.1E-12 |
2.4E-10 |
ENSG00000249111 |
AC108517.1 |
RP11-622J8.1 |
7.13 |
3.4E-25 |
1.1E-22 |
ENSG00000215808 |
LINC01139 |
Link-A |
6.83 |
7.9E-06 |
1.8E-04 |
ENSG00000235180 |
LINC00601 |
LINC00601 |
6.75 |
4.7E-27 |
1.7E-24 |
ENSG00000228430 |
AL162726.3 |
RP11-15B24.5 |
6.47 |
6.0E-22 |
1.3E-19 |
ENSG00000251292 |
ERVH-1 |
RP11-380P13.2 |
5.88 |
2.8E-20 |
4.9E-18 |
ENSG00000230234 |
AL162582.1 |
RP1-276N6.2 |
5.43 |
8.4E-14 |
5.3E-12 |
ENSG00000225006 |
AL929288.1 |
RP11-669M2.1 |
4.51 |
9.3E-09 |
2.0E-07 |
ENSG00000251164 |
HULC |
HULC |
1.46 |
2.3E-04 |
1.5E-03 |
ENSG00000228630 |
HOTAIR |
HOTAIR |
0.47 |
6.4E-01 |
NS |
ENSG00000243766 |
HOTTIP |
HOTTIP |
0.20 |
8.4E-01 |
NS |
ENSG00000226442 |
AC006037.1 |
AC006037.2 |
−1.39 |
1.7E-01 |
NS |
ENSG00000247844 |
CCAT1 |
CCAT1 |
−1.84 |
2.5E-05 |
2.3E-04 |
ENSG00000237076 |
AL035706.1 |
RP5-836J3.1 |
−2.75 |
1.4E-04 |
1.1E-03 |
ENSG00000279218 |
AC006037.2 |
AC006037.2 |
−2.94 |
1.4E-04 |
1.0E-03 |
ENSG00000234223 |
AC003988.1 |
AC003988.1 |
−3.27 |
9.2E-07 |
1.2E-05 |
ENSG00000228980 |
LINC01205 |
RP11-702L6.4 |
−3.40 |
9.8E-07 |
1.3E-05 |
ENSG00000244128 |
LINC01322 |
RP11-85M11.2 |
−3.62 |
1.3E-07 |
2.1E-06 |
ENSG00000130600 |
H19 |
H19 |
−3.66 |
3.7E-11 |
1.3E-09 |
ENSG00000250266 |
LINC01612 |
RP11-789C1.1 |
−4.38 |
9.2E-10 |
2.4E-08 |
ENSG00000249173 |
LINC01093 |
RP11-701P16.4 |
−5.50 |
2.8E-14 |
1.9E-12 |
ENSG00000237949 |
LINC00844 |
LINC00844 |
−5.50 |
6.6E-10 |
1.8E-08 |
NS: Not significant.
DISCUSSION
Liver cancer is the second most common cause of cancer death worldwide [25]. While advances in targeted treatment for advanced stage conventional HCC have been observed [26], no targeted therapies currently exist for FLC. Promising chemotherapeutic regimens have been reported in FLC patients [27], however, surgical resection remains the only consensus treatment with 5-year overall survival rates reported between 30–45% [28–30]. The DNAJB1-PRKACA chimera is the one structural variant common to FLC patients, making it a promising therapeutic target [8]. The transcriptomic analysis showing enrichment of numerous oncologically relevant pathways, points to additional new directions for therapies targeting pathways downstream of the drivers of the tumor [7]. In addition, the diagnosis of FLC remains problematic. Malouf and colleagues showed that inter-observer diagnostic reproducibility for the diagnosis of FLC, conventional HCC and cholangiocarcinoma between 12 pathologists was relatively poor [31]. This begs the question of developing molecular assays to aid FLC diagnosis as well as developing non-invasive screening and surveillance tests.
We have previously demonstrated that in primary FLC tumor tissue there are consistent changes in various oncologically relevant pathways such as EGF/ErbB2, Aurora Kinase A and wnt signaling pathways [7]. After examining the differentially expressed miRNA in FLC that meet statistical significance, we turned our attention to these same pathways that are enriched in the tumor to further explore the role miRNA may have in the pathogenesis of FLC. As seen in our KEGG pathway analysis (Tables 4, 5), many oncologically relevant pathways are highlighted within the top 10 results including: Hippo pathway, TGF-beta signaling, EGFR/ErbB signaling.
Investigations of the Hippo pathway have demonstrated activation of Yes-associated protein (YAP) yields increased hepatocyte proliferation. Alterations of the pathway are found during the process of liver regeneration, suggesting this pathway plays a role in modulating cell proliferation and liver size [32–34]. The Hippo signaling pathway has been implicated as a tumor suppressor pathway [33, 35] with inactivation leading to activity of the nuclear effector YAP. One group evaluated YAP activity in lung adenocarcinoma, colon adenocarcinoma and ovarian serous carcinoma, and found it to be commonly altered in the process of carcinogenesis [36]. A separate group further investigated YAP nuclear localization and staining pattern in pediatric hepatocellular carcinoma samples with a subset analysis of FLC vs non-FLC tumors. This study showed YAP nuclear localization in both HCC and FLC samples suggesting YAP activity, however YAP nuclear localization was found to a lesser degree in the FLC samples [37]. PKA, which is activated in FLC, phosphorylates YAP, which is an important downstream effector of the Hippo pathway [38]. In analyzing our data of under-expressed miRNA, 117 genes involved with Hippo signaling pathway are implicated as targets for 74 miRNA (p = 2.05 × 10⁻⁷). Similarly, for miRNA that are overexpressed, 113 genes involved with the pathway are implicated as targets for 68 miRNA (p = 1.78 × 10⁻⁶) suggesting its potential role in FLC.
Differentially expressed miRNA in FLC are also implicated to target wnt signaling. A role for wnt signaling in cancer was first described in the 1980s in the context of murine mammary cancer, but various gene mutations in this pathway have been identified in several cancers including: colorectal, breast, HCC and lung cancers among others [39–42]. In our previous analysis of the FLC transcriptome, we found a number of members of the wnt pathway demonstrated to be consistently overexpressed in FLC including: DKK4 (Δlog2 = 6.52, padj = 3.99 × 10⁻¹⁹), FZD10 (Δlog2 = 6.1, padj = 3.08x10⁻²⁰), wnt16 (Δlog2 = 4.40, padj = 3x10–03) wnt1 (Δlog2 = 3.94, padj = 1.44 × 10⁻¹), SFRP2 (Δlog2 = 3.25, padj = 3.84 × 10-03), LEF1 (Δlog2 = 2.55, padj = 7.57 × 10⁻¹²) [7]. With this knowledge, we directed our attention to transcripts in the wnt signaling pathway found to be highly over expressed, including FZD10, which has been implicated to have a role in colorectal cancer through activation of the β-catenin-TCF signaling pathway [43]. When looking at miRNA that were down-regulated in FLC, our DIANA miRPath v.3 analysis yielded enrichment of wnt signaling pathway, and more specifically, miRNA that were proposed to specifically target FZD10. The relationship between the decreased miR-548p and transcription of FZD10 in FLC is a correlation, which does not demonstrate causality. Further, for many mRNA there are numerous miRNA that limit their expression and eliminating one miRNA may not be sufficient to alter the level of transcription. To further investigate this relationship between miR-548p and FZD10 transcription level, we reduced the expression of miR-548p in Huh7 cells, which both increased the transcription of FZD10 and increase the protein level. Increasing the expression of miR-548p through viral transduction decreased the expression of FZD10 transcription. Given this observed relationship, miR-548p or FZD10 may guide future investigations looking into these as diagnostic or therapeutic targets for patients. This may indeed be a correlation seen in vitro as multiple miRNA may regulate one pathway; thus just because one miRNA is decreased does not necessitate that its target mRNA is increased, and further investigation is warranted.
MicroRNAs have been studied extensively and have proven to regulate multiple biological functions and disease states, including cancer [16, 44–46]. Overexpression, or silencing of miRNAs have been shown to play a particular role in disease progression and resistance or sensitivity to treatment [17, 46–55]. With our framework of identifying the most aberrantly expressed miRNA in FLC, we provide a scaffold for future studies using miRNA in FLC.
When viewing these miRNA that are differentially expressed with statistical significance in conventional HCC and comparing them to those found in FLC, we see that many of them are not represented in our dataset, such as miR-210, miR-373, and miR136, among others [56]. Wang et al. previously investigated miRNA expression in conventional HCC and found miR-224 to be one of the most highly over expressed miRNA in HCC tissue in comparison to normal liver [57]. While miR-224 was found to be over expressed in our dataset, it was not the most highly over expressed miRNA and it did not appear to be as highly over expressed as in HCC as reported by Wang. Among other previously described down regulated miRNAs in conventional HCC is miR-122, accounting for near 70% of the miRNA population in the adult liver acting as a key regulator of cholesterol and fatty-acid metabolism [56, 58–60]. While the down-regulation of miR-122 has been detected in more than 70% of HCC, it was not among the most highly down regulated observed in our dataset.
Several investigations have examined the noncoding lncRNA and miRNA landscape of conventional HCC in the context of the native tumor tissues and as circulating biomarkers of disease. The profile of lncRNA in FLC was very different from HCC. Some lncRNA that increased significantly in conventional HCC, were only slightly increased in FLC. We expected the highly upregulated in liver cancer (HULC) to be upregulated in FLC. HULC, first shown to be very upregulated in HCC over ten years ago [20] upregulated in cholangiocarcinoma [61], and is upregulated by PKA phosphorylation of CREB [62], as well as in many cancers leading to the proposal that it is a prognostic biomarkers for human cancers [63]. Surprisingly, in FLC, HULC is only increased slightly (Δlog2 = 1.45, padj = 1.5 × 10−03). Expression of the lncRNA HOTAIR, which has been shown to correlate with tumor recurrence in HCC [64–66], and supports tumor invasion HCC [67] was not found to be increased in FLC (HOTAIR Δlog2 = 0.47, padj = not significant). Others that are increased in HCC and cholangiocarcinoma, such as H19 which drives cell growth and invasion [68], was found to be decreased in FLC (Δlog2 = −3.66 padj = 1.39 × 10⁻⁹).
There were near 300 lncRNA that were increased, and over 300 that were decreased significantly in expression in FLC (|Δlog2|>1, padj < 0.01) (Table 6). Even as this manuscript was in progress, the annotation of lncRNA was constantly changing making it difficult to assign a precise number of “significantly altered” transcripts [69, 70]. Notably, a few of these lncRNAs significantly altered have been previously implicated in cancers. One example is the long intergenic non-coding RNA for kinase activation, Link-A (linc01139, (Δlog2 = 6.83, padj = 1.8 × 10⁻⁴), is highly expressed in breast cancer and has been shown to specifically interact with phosphatidylinositol 3,4,5-trisphosphate (PIP3) and Protein Kinase B (PKB/AKT) [71]. The interactions of Link-A are important for recruitment and activation of AKT as well as resistance to inhibitors of AKT. A second example, found to be highly overexpressed is linc00355 (Δlog2 = 8.45, padj = 2.4 × 10⁻¹⁰), which has previously been observed to be overexpressed in bladder cancer. However, in a study by Seitz and colleagues evaluating lncRNA candidate oncogenes, a reduction in expression of linc00355 had no effect on cell viability [72]. Many of the other lncRNA that are highly altered in expression have not been previously correlated with tumors. For most of these little is known of their normal physiology nor their interactions. A few have been implicated to interact with miRNA. RP11-622J8.1 has been implicated in interacting with the miRNA: hsa-miR-16-1-3p, hsa-miR-4698, hsa-miR-27a-3p, hsa-miR-27b-3p, hsa-miR-3662, hsa-miR-5571-5p, hsa-miR-570-3p, hsa-miR-3658, hsa-miR-519e-3p, hsa-miR-514b-5p and hsa-miR-515-3p [69, 70]. However, not enough is known of the physiological implications of these interactions to determine if they are only correlations with FLC or if there is a causal link. While this paper was in preparation it was reported that four of the lncRNA seen in Supplementary Table 2 were observed increased in FLC on a search of TCGA data, which might include our data set [73]: AF064858.6 (also known as lnc-ERG-9:5 Δlog2 = 4.92, padj = 1.02 x10⁻⁹); linc0313(Δlog2 = 3.27, padj = 3.3x10⁻⁵), linc00473(Δlog2 = 5.86, padj = 7.9x10⁻¹³) and RP11-157N3.1 (also known as linc01307, Δlog2 = 3.38, padj = 9.9x10⁻³). To evaluate which of these are causally related to tumorigenesis will require an analysis similar to the work presented here on miR-548p.
Prior investigations have shown circulating miRNA are relatively resistant to native RNase activity in the blood, making them potential non-invasive biomarkers of disease for various cancers [13, 74–76]. Yamamoto et al. previously reported serum elevations of miR-500 in HCC patients with levels that subsequently declined after surgical treatment in a small group of patients [75]. Similarly, Shigoka and colleagues found decreased miR-92a in serum samples of patients with HCC compared to healthy counterparts, with elevation after surgical treatment [77]. MicroRNA are clearly differentially expressed between FLC tumor and the normal liver. While the functional interactions of many of these miRNA are still unknown, the clear differential expression of these miRNA may still serve as a foundation for further research aimed at developing non-invasive biomarkers of FLC.
Our results suggest a unique expression profile for non-coding RNA (lncRNA and miRNA) in FLC. Our data bears little similarity to the non-coding RNA expression in conventional HCC or cholangiocarcinoma, which is again consistent with our previous characterization of the coding RNA. Furthermore, FLC behaves as a different disease from other liver pathologies as evidenced by the tumor biology and epidemiology. Due to its advanced stage at diagnosis and poor prognosis, this disease still desperately requires further investigation for novel treatments and diagnostic tools.
MATERIALS AND METHODS
Human tissue samples
With Institutional Review Board approval (Rockefeller IRB# SSI-0797, SSI-0798 and Memorial Sloan Kettering Cancer Center IRB Protocol #13-010), we obtained samples of OCT embedded tumor and adjacent normal liver tissue. Diagnosis of FLC was confirmed for all tumor samples by a single pathologist (UKB) specializing in hepatobiliary tumors. All tumor samples were confirmed to have >80% tumor cells with minimal necrosis, which was macro-dissected away with stromal components. Review of adjacent normal liver samples revealed no evidence of tumor infiltration.
RNA isolation, generation of cDNA and sequencing
Total RNA was extracted from cells in culture, or from optimal cutting temperature (OCT) embedded frozen FLC tumor and adjacent normal liver tissue samples using the miRNeasy Mini Kit (Qiagen). The miScript II RT Kit with was used to convert total RNA into cDNA as described by the manufacturer, with use of the HiSpec buffer when used for miRNA and HiFlex buffer when used for mRNA (Qiagen). RNA-Seq libraries were generated using the TruSeq small RNA sample preparation kit (Illumina, San Diego, CA) following the manufacturer’s protocol. Libraries were sequenced with 1 × 50 bp single-end reads on an Illumina HiSeq 2000 system. Small RNA reads were mapped and quantified with miraligner and quantified read counts were annotated with Gencode v19. Differential miRNA expression analysis was performed using R version 3.2.3 [78] with the Bioconductor package DESeq2 [79] incorporating variable factors for condition of tumor or normal and patient. For the lncRNA, RNA-Seq libraries were prepared using TruSeq Stranded Total RNA Sample Prep Kit with Ribo-Zero ribosomal RNA depletion (Illumina). The manufacturer’s protocols were used to sequence ribosomal RNA-depleted libraries at 2 × 50-bp paired-end reads on an Illumina HiSEq. 2500 in high-output mode, to an average depth of 86 × 106 paired-end reads per sample (range 43 × 106 to 139 × 106).
Verification of the DNAJB1-PRKACA chimeric transcript
cDNA of tumor tissues was prepared as described above. PCR amplification of the DNAJB1- PRKACA chimera was conducted using 45 μL Platinum PCR mix (Invitrogen), 2 μL each of 5 μM forward and reverse primers (Supplementary Table 3), and 1 μL cDNA template for total reaction volume of 50 μL. Primers for the chimera were designed with MacVector’s Primer Design (Primer3) (version 13.5.5) and purchased from Integrated DNA Technologies. Cycling conditions were initial activation of 95°C for 15 min followed by 40 cycles of 94°C for 15 seconds, 55°C for 30 seconds and 70°C for 30 seconds. PCR products were loaded into a 2% agarose gel, pre-stained with SYBR safe (Invitrogen) was run at 100V for 45 minutes and then imaged with a BioRad Gel Doc EZ imager.
Real time PCR
Real Time PCR was performed in triplicate on an Applied Biosystems QuantStudio 12K Flex instrument console using QuantiTect SYBR green based PCR master mix (Qiagen) according to the manufacturer’s instructions with the modification of total reaction volume being 25 μL. Cycling conditions were: initial activation step 95°C for 15 min followed by 40 cycles of 94°C for 15 sec, 55°C for 30 sec and 70°C for 30 sec. QuantiTect and miScript primers were purchased from Qiagen. Levels of RNA expression were determined using the QuantStudio 12K Flex Software version 1.2.2 (Applied Biosystems), and Microsoft Excel. Data were analyzed by the ΔΔCT method after normalization to human beta 2 microglobulin (B2M), or small nucleolar RNA (SNORD42b) where appropriate. 2-tailed t-tests were used to identify statistical significance with p < 0.05 as threshold for significant values.
miRNA pathway analysis
Mature miRNA targets from DESeq2 analysis were filtered for absolute log2 fold change ≥1 with a false discovery rate (FDR) ≤ 0.01. Selected miRNA were placed in DIANA-miRPath version 3 microT-CDS to analyze pathways enriched with gene targets of miRNA [24].
Cell culture
HEK293T and Huh7 cell lines were maintained in Dulbecco’s Modified Eagle’s medium (DMEM, Life Technologies) supplemented with 10% heat-inactivated fetal bovine serum (Sigma) and 1% non-essential amino acids (Gibco). Adherent cells were grown in an incubator at 37°C with 5% CO2 (Fisher Scientific).
Generation of Lentivirus and miRNA overexpression/knock down
HEK 293T cells were seeded in a 10 cm plate and allowed to reach 60% confluence in DMEM supplemented with 10%FBS and 1%NEAA. Prior to transfection, media was replaced with fresh DMEM media supplemented with 3% FBS and 1%NEAA. Cells were co-transfected with 5 μg of pCRV1-NL-gag/pol, 1 μg of VSV-G and 5 μg of appropriate miR-Zip or miRNA precursor overexpression plasmid (System Biosciences, Mountain View, CA) along with 44 μL of polyethylenimine (PEI) and OptiMem (Gibco). Cells were incubated at 37°C for 48 hr and virus was harvested and filtered through a 0.45 μm filter. Polybrene 4 μg/mL (Milipore) and HEPES 20 mM (Gibco) were added to viral stocks and was preserved at −80°C until used. Huh7 cells were transduced with 1 mL of the appropriate virus. After 48 hours, cells were imaged to detect GFP signal, and 2 μg/mL of puromycin was added to the cell media of miR-Zip transduced cells for lentiviral selection.
Imaging
Huh-7 cells transduced with lentiviral constructs in 6 well tissue culture dishes were imaged 48 hours after transduction using an Olympus IX70 microscope with a 10× UPlanFL N air objective (N.A. 0.3), and an Olympus xenon arc-lamp. GFP images were obtained using a Semrock excitation band pass filter (FF01-466/40-25-D) with a Di02-R488-26x38-EP beam splitter, and an emission band pass filter (FF01-525/30-25-D). The image acquisition and data analysis were done using MetaMorph software version 7.7.8.0 (Molecular Devices, LLC, Sunnyvale, CA). Images were captured with an ORCA-ER C4742-95-12ER Hamamatsu camera using an exposure time of 500 ms for bright field images and 50 ms for fluorescent images. H&E slides of FLC were imaged on an Olympus IX83 microscope using a 10× objective. H&E color images were captured using an Olympus DP26 camera.
Immunoblotting
Huh7 cells previously transduced with lentivirus were detached from culture dishes using ice-cold 50 mM EDTA/PBS and a cell scraper (Corning, Corning, NY). Cells were centrifuged at 2000 RPM for 5 minutes at 4°C, and the supernatant aspirated. Cell pellets were lysed in RIPA buffer (Sigma) containing protease and phosphatase inhibitors (Complete EDTA-free and Phosphostop, Roche, Indianapolis, IN) on ice. Protein concentrations were measured by a modified Lowry assay (DC protein assay, Bio-Rad, Berkeley, CA). 10μg of protein per sample were diluted with 4X Nupage LDS sample buffer (Life technologies) containing 10% β-mercaptoethanol. Samples were heated at 100°C for 5 minutes, and then loaded on 4–12% Bis-Tris gels (Nupage, Invitrogen, Carlsbad, CA) and run in MOPS buffer for 50 minutes at 200V. Transfer was performed using the iBlot (Life Technologies, Carlsbad, CA). Membranes were blocked for 1 hour in 5% milk in TBST, washed in TBST, and then probed with primary antibodies in 5% milk against either human FZD10 (Proteintech, 18175-1-AP, 1:500); or human β-Actin (Sigma, A5316, 1:1000); and incubated overnight shaking at 4°C. After washing in TBST, membranes were incubated with horseradish peroxidase-conjugated appropriate secondary antibodies (Sigma, A0545 goat anti rabbit, A9917, goat anti mouse, 1:100,000) in 5% milk in TBST for 1 hour. Membranes were washed in TBST and then incubated with Amersham ECL prime western blotting detection reagent (GE Healthcare).
Author contributions
BAF, GL, EPS, MPLQ, SMS designed research; BAF, GL, EPS, UKB performed research; BAF, GL, EPS, DR, SMS analyzed data, and BAF, GL, WJH, MPLQ and SMS wrote the manuscript.
ACKNOWLEDGMENTS
We especially would like to thank the fibrolamellar patient and family community for their continued support and participation in our research studies, in addition to Marina Bleck, Arlene Hurley, Rachel Belote, Michelle Itano, Jia Min Loo, Brad Rosenberg, Rachel Chiaroni-Clarke, Constantin Takacs, Wenxiang Zhang and Connie Zhao for their assistance with this project.
CONFLICTS OF INTEREST
None.
FUNDING
This work was supported in part by NIH grants 1R56CA207929-01 and 3 P30 CA015083-43S3 (SMS), by a Cancer Center Support Grant from the National Institutes of Health/National Cancer Institute to Memorial Sloan Kettering Cancer Center (# P30 CA008748), from the Rockefeller University Center for Clinical and Translational Science (RUCCTS) grant (#8 UL1 TR000043) from the National Center for Advancing Translational Sciences (NCATS), National Institutes of Health (NIH) Clinical and Translational Science Award (CTSA) program and the donations of fibrolamellar patients and their loved ones.
REFERENCES
1. Edmondson HA. Differential diagnosis of tumors and tumor-like lesions of liver in infancy and childhood. AMA J Dis Child. 1956; 91:168–86.
2. Torbenson M. Fibrolamellar carcinoma: 2012 update. Scientifica (Cairo). 2012; 2012:743790. https://doi.org/10.6064/2012/743790.
3. Lim II, Farber BA, LaQuaglia MP. Advances in Fibrolamellar Hepatocellular Carcinoma: A Review. Eur J Pediatr Surg. 2014. https://doi.org/10.1055/s-0034-1396420.
4. Fonseca GM, Varella AD, Coelho FF, Abe ES, Dumarco RB, Herman P. Downstaging and resection after neoadjuvant therapy for fibrolamellar hepatocellular carcinoma. World J Gastrointest Surg. 2014; 6:107–11. https://doi.org/10.4240/wjgs.v6.i6.107.
5. Ang CS, Kelley RK, Choti MA, Cosgrove DP, Chou JF, Klimstra D, Torbenson MS, Ferrell L, Pawlik TM, Fong Y, O’Reilly EM, Ma J, McGuire J, et al. Clinicopathologic characteristics and survival outcomes of patients with fibrolamellar carcinoma: data from the fibrolamellar carcinoma consortium. Gastrointest Cancer Res. 2013; 6:3–9.
6. Maniaci V, Davidson BR, Rolles K, Dhillon AP, Hackshaw A, Begent RH, Meyer T. Fibrolamellar hepatocellular carcinoma: prolonged survival with multimodality therapy. Eur J Surg Oncol. 2009; 35:617–21. https://doi.org/10.1016/j.ejso.2008.12.009.
7. Simon EP, Freije CA, Farber BA, Lalazar G, Darcy DG, Honeyman JN, Chiaroni-Clarke R, Dill BD, Molina H, Bhanot UK, La Quaglia MP, Rosenberg BR, Simon SM. Transcriptomic characterization of fibrolamellar hepatocellular carcinoma. Proc Natl Acad Sci USA. 2015. https://doi.org/10.1073/pnas.1424894112.
8. Honeyman JN, Simon EP, Robine N, Chiaroni-Clarke R, Darcy DG, Lim II, Gleason CE, Murphy JM, Rosenberg BR, Teegan L, Takacs CN, Botero S, Belote R, et al. Detection of a recurrent DNAJB1-PRKACA chimeric transcript in fibrolamellar hepatocellular carcinoma. Science. 2014; 343:1010–4. https://doi.org/10.1126/science.1249484.
9. Darcy DG, Chiaroni-Clarke R, Murphy JM, Honeyman JN, Bhanot U, LaQuaglia MP, Simon SM. The genomic landscape of fibrolamellar hepatocellular carcinoma: whole genome sequencing of ten patients. Oncotarget. 2015; 6:755–70. https://doi.org/10.18632/oncotarget.2712.
10. Graham RP, Jin L, Knutson DL, Kloft-Nelson SM, Greipp PT, Waldburger N, Roessler S, Longerich T, Roberts LR, Oliveira AM, Halling KC, Schirmacher P, Torbenson MS. DNAJB1-PRKACA is specific for fibrolamellar carcinoma. Mod Pathol. 2015. https://doi.org/10.1038/modpathol.2015.4.
11. Oikawa T, Wauthier E, Dinh TA, Selitsky SR, Reyna-Neyra A, Carpino G, Levine R, Cardinale V, Klimstra D, Gaudio E, Alvaro D, Carrasco N, Sethupathy P, et al. Model of fibrolamellar hepatocellular carcinomas reveals striking enrichment in cancer stem cells. Nat Commun. 2015; 6:8070. https://doi.org/10.1038/ncomms9070.
12. Farazi TA, Spitzer JI, Morozov P, Tuschl T. miRNAs in human cancer. J Pathol. 2011; 223:102–15. https://doi.org/10.1002/path.2806.
13. Mitchell PS, Parkin RK, Kroh EM, Fritz BR, Wyman SK, Pogosova-Agadjanyan EL, Peterson A, Noteboom J, O’Briant KC, Allen A, Lin DW, Urban N, Drescher CW, et al. Circulating microRNAs as stable blood-based markers for cancer detection. Proc Natl Acad Sci U S A. 2008; 105:10513–8. https://doi.org/10.1073/pnas.0804549105.
14. Marin-Muller C, Yao Q, Chen C. MicroRNAs and Human Disease. eLS: John Wiley & Sons, Ltd). 2010.
15. Esquela-Kerscher A, Slack FJ. Oncomirs - microRNAs with a role in cancer. Nat Rev Cancer. 2006; 6:259–69. https://doi.org/10.1038/nrc1840.
16. Calin GA, Croce CM. MicroRNA signatures in human cancers. Nat Rev Cancer. 2006; 6:857–66. https://doi.org/10.1038/nrc1997.
17. Pencheva N, Tavazoie SF. Control of metastatic progression by microRNA regulatory networks. Nat Cell Biol. 2013; 15:546–54. https://doi.org/10.1038/ncb2769.
18. Lin R, Maeda S, Liu C, Karin M, Edgington TS. A large noncoding RNA is a marker for murine hepatocellular carcinomas and a spectrum of human carcinomas. Oncogene. 2007; 26:851–8. https://doi.org/10.1038/sj.onc.1209846.
19. Moh MC, Lee LH, Yang X, Shen S. Identification of a novel gene HEPT3 that is overexpressed in human hepatocellular carcinoma and may function through its noncoding RNA. Int J Oncol. 2007; 31:293–301.
20. Panzitt K, Tschernatsch MM, Guelly C, Moustafa T, Stradner M, Strohmaier HM, Buck CR, Denk H, Schroeder R, Trauner M, Zatloukal K. Characterization of HULC, a novel gene with striking up-regulation in hepatocellular carcinoma, as noncoding RNA. Gastroenterology. 2007; 132:330–42. https://doi.org/10.1053/j.gastro.2006.08.026.
21. Wang F, Xie C, Zhao W, Deng Z, Yang H, Fang Q. Long non-coding RNA CARLo-5 expression is associated with disease progression and predicts outcome in hepatocellular carcinoma patients. Clin Exp Med. 2017; 17:33–43. https://doi.org/10.1007/s10238-015-0395-9.
22. Chang S, Chen B, Wang X, Wu K, Sun Y. Long non-coding RNA XIST regulates PTEN expression by sponging miR-181a and promotes hepatocellular carcinoma progression. BMC Cancer. 2017; 17:248. https://doi.org/10.1186/s12885-017-3216-6.
23. Weidle UH, Birzele F, Kollmorgen G, Ruger R. Long Non-coding RNAs and their Role in Metastasis. Cancer Genomics Proteomics. 2017; 14:143–60.
24. Vlachos IS, Zagganas K, Paraskevopoulou MD, Georgakilas G, Karagkouni D, Vergoulis T, Dalamagas T, Hatzigeorgiou AG. DIANA-miRPath v3.0: deciphering microRNA function with experimental support. Nucleic Acids Res. 2015; 43:W460-6. https://doi.org/10.1093/nar/gkv403.
25. Ryerson AB, Eheman CR, Altekruse SF, Ward JW, Jemal A, Sherman RL, Henley SJ, Holtzman D, Lake A, Noone AM, Anderson RN, Ma J, Ly KN, et al. Annual Report to the Nation on the Status of Cancer, 1975-2012, featuring the increasing incidence of liver cancer. Cancer. 2016; 122:1312–37. https://doi.org/10.1002/cncr.29936.
26. Llovet JM, Ricci S, Mazzaferro V, Hilgard P, Gane E, Blanc JF, de Oliveira AC, Santoro A, Raoul JL, Forner A, Schwartz M, Porta C, Zeuzem S, et al. Sorafenib in advanced hepatocellular carcinoma. N Engl J Med. 2008; 359:378–90. https://doi.org/10.1056/NEJMoa0708857.
27. Kaseb AO, Shama M, Sahin IH, Nooka A, Hassabo HM, Vauthey JN, Aloia T, Abbruzzese JL, Subbiah IM, Janku F, Curley S, Hassan MM. Prognostic indicators and treatment outcome in 94 cases of fibrolamellar hepatocellular carcinoma. Oncology. 2013; 85:197–203. https://doi.org/10.1159/000354698.
28. Eggert T, McGlynn KA, Duffy A, Manns MP, Greten TF, Altekruse SF. Fibrolamellar hepatocellular carcinoma in the USA, 2000-2010: A detailed report on frequency, treatment and outcome based on the Surveillance, Epidemiology, and End Results database. United European Gastroenterol J. 2013; 1:351–7. https://doi.org/10.1177/2050640613501507.
29. El-Serag HB, Davila JA. Is fibrolamellar carcinoma different from hepatocellular carcinoma? A US population-based study. Hepatology. 2004; 39:798–803. https://doi.org/10.1002/hep.20096.
30. Mavros MN, Mayo SC, Hyder O, Pawlik TM. A systematic review: treatment and prognosis of patients with fibrolamellar hepatocellular carcinoma. J Am Coll Surg. 2012; 215:820–30. https://doi.org/10.1016/j.jamcollsurg.2012.08.001.
31. Malouf G, Falissard B, Azoulay D, Callea F, Ferrell LD, Goodman ZD, Hayashi Y, Hsu HC, Hubscher SG, Kojiro M, Ng IO, Paterson AC, Reynes M, et al. Is histological diagnosis of primary liver carcinomas with fibrous stroma reproducible among experts? J Clin Pathol. 2009; 62:519–24. https://doi.org/10.1136/jcp.2008.062620.
32. Grijalva JL, Huizenga M, Mueller K, Rodriguez S, Brazzo J, Camargo F, Sadri-Vakili G, Vakili K. Dynamic alterations in Hippo signaling pathway and YAP activation during liver regeneration. Am J Physiol Gastrointest Liver Physiol. 2014; 307:G196-204. https://doi.org/10.1152/ajpgi.00077.2014.
33. Lu L, Li Y, Kim SM, Bossuyt W, Liu P, Qiu Q, Wang Y, Halder G, Finegold MJ, Lee JS, Johnson RL. Hippo signaling is a potent in vivo growth and tumor suppressor pathway in the mammalian liver. Proc Natl Acad Sci USA. 2010; 107:1437–42. https://doi.org/10.1073/pnas.0911427107.
34. Camargo FD, Gokhale S, Johnnidis JB, Fu D, Bell GW, Jaenisch R, Brummelkamp TR. YAP1 increases organ size and expands undifferentiated progenitor cells. Curr Biol. 2007; 17:2054–60. https://doi.org/10.1016/j.cub.2007.10.039.
35. Olson MF. Modeling human cancer: report on the Eighth Beatson International Cancer Conference. Cancer Res. 2005; 65:11247–50. https://doi.org/10.1158/0008-5472.CAN-05-2713.
36. Steinhardt AA, Gayyed MF, Klein AP, Dong J, Maitra A, Pan D, Montgomery EA, Anders RA. Expression of Yes-associated protein in common solid tumors. Hum Pathol. 2008; 39:1582–9. https://doi.org/10.1016/j.humpath.2008.04.012.
37. LaQuaglia MJ, Grijalva JL, Mueller KA, Perez-Atayde AR, Kim HB, Sadri-Vakili G, Vakili K. YAP Subcellular Localization and Hippo Pathway Transcriptome Analysis in Pediatric Hepatocellular Carcinoma. Sci Rep. 2016; 6:30238. https://doi.org/10.1038/srep30238.
38. Yu FX, Zhang Y, Park HW, Jewell JL, Chen Q, Deng Y, Pan D, Taylor SS, Lai ZC, Guan KL. Protein kinase A activates the Hippo pathway to modulate cell proliferation and differentiation. Genes Dev. 2013; 27:1223–32. https://doi.org/10.1101/gad.219402.113.
39. Nusse R, Varmus HE. Many tumors induced by the mouse mammary tumor virus contain a provirus integrated in the same region of the host genome. Cell. 1982; 31:99–109.
40. Morin PJ, Sparks AB, Korinek V, Barker N, Clevers H, Vogelstein B, Kinzler KW. Activation of beta-catenin-Tcf signaling in colon cancer by mutations in beta-catenin or APC. Science. 1997; 275:1787–90.
41. Korinek V, Barker N, Morin PJ, van Wichen D, de Weger R, Kinzler KW, Vogelstein B, Clevers H. Constitutive transcriptional activation by a beta-catenin-Tcf complex in APC-/- colon carcinoma. Science. 1997; 275:1784–7.
42. Anastas JN, Moon RT. WNT signalling pathways as therapeutic targets in cancer. Nat Rev Cancer. 2013; 13:11–26. https://doi.org/10.1038/nrc3419.
43. Terasaki H, Saitoh T, Shiokawa K, Katoh M. Frizzled-10, up-regulated in primary colorectal cancer, is a positive regulator of the WNT - beta-catenin - TCF signaling pathway. Int J Mol Med. 2002; 9:107–12.
44. Croce CM. Oncogenes and cancer. N Engl J Med. 2008; 358:502–11. https://doi.org/10.1056/NEJMra072367.
45. Wiemer EA. The role of microRNAs in cancer: no small matter. Eur J Cancer. 2007; 43:1529–44. https://doi.org/10.1016/j.ejca.2007.04.002.
46. Inns J, James V. Circulating microRNAs for the prediction of metastasis in breast cancer patients diagnosed with early stage disease. Breast. 2015; 24:364–9. https://doi.org/10.1016/j.breast.2015.04.001.
47. Loo JM, Scherl A, Nguyen A, Man FY, Weinberg E, Zeng Z, Saltz L, Paty PB, Tavazoie SF. Extracellular metabolic energetics can promote cancer progression. Cell. 2015; 160:393–406. https://doi.org/10.1016/j.cell.2014.12.018.
48. Lujambio A, Lowe SW. The microcosmos of cancer. Nature. 2012; 482:347–55. https://doi.org/10.1038/nature10888.
49. Ma L, Teruya-Feldstein J, Weinberg RA. Tumour invasion and metastasis initiated by microRNA-10b in breast cancer. Nature. 2007; 449:682–8. https://doi.org/10.1038/nature06174.
50. Pencheva N, Tran H, Buss C, Huh D, Drobnjak M, Busam K, Tavazoie SF. Convergent multi-miRNA targeting of ApoE drives LRP1/LRP8-dependent melanoma metastasis and angiogenesis. Cell. 2012; 151:1068–82. https://doi.org/10.1016/j.cell.2012.10.028.
51. Tavazoie SF, Alarcon C, Oskarsson T, Padua D, Wang Q, Bos PD, Gerald WL, Massague J. Endogenous human microRNAs that suppress breast cancer metastasis. Nature. 2008; 451:147–52. https://doi.org/10.1038/nature06487.
52. Gulla A, Di Martino MT, Gallo Cantafio ME, Morelli E, Amodio N, Botta C, Pitari MR, Lio SG, Britti D, Stamato MA, Hideshima T, Munshi NC, Anderson KC, et al. A 13 mer LNA-i-miR-221 Inhibitor Restores Drug Sensitivity in Melphalan-Refractory Multiple Myeloma Cells. Clin Cancer Res. 2016; 22:1222–33. https://doi.org/10.1158/1078-0432.CCR-15-0489.
53. Miller TE, Ghoshal K, Ramaswamy B, Roy S, Datta J, Shapiro CL, Jacob S, Majumder S. MicroRNA-221/222 confers tamoxifen resistance in breast cancer by targeting p27Kip1. J Biol Chem. 2008; 283:29897–903. https://doi.org/10.1074/jbc.M804612200.
54. Muluhngwi P, Klinge CM. Roles for miRNAs in endocrine resistance in breast cancer. Endocr Relat Cancer. 2015; 22:R279-300. https://doi.org/10.1530/ERC-15-0355.
55. Calin GA, Ferracin M, Cimmino A, Di Leva G, Shimizu M, Wojcik SE, Iorio MV, Visone R, Sever NI, Fabbri M, Iuliano R, Palumbo T, Pichiorri F, et al. A MicroRNA signature associated with prognosis and progression in chronic lymphocytic leukemia. N Engl J Med. 2005; 353:1793–801. https://doi.org/10.1056/NEJMoa050995.
56. Gramantieri L, Fornari F, Callegari E, Sabbioni S, Lanza G, Croce CM, Bolondi L, Negrini M. MicroRNA involvement in hepatocellular carcinoma. J Cell Mol Med. 2008; 12:2189–204. https://doi.org/10.1111/j.1582-4934.2008.00533.x.
57. Wang Y, Lee AT, Ma JZ, Wang J, Ren J, Yang Y, Tantoso E, Li KB, Ooi LL, Tan P, Lee CG. Profiling microRNA expression in hepatocellular carcinoma reveals microRNA-224 up-regulation and apoptosis inhibitor-5 as a microRNA-224-specific target. J Biol Chem. 2008; 283:13205–15. https://doi.org/10.1074/jbc.M707629200.
58. Gramantieri L, Ferracin M, Fornari F, Veronese A, Sabbioni S, Liu CG, Calin GA, Giovannini C, Ferrazzi E, Grazi GL, Croce CM, Bolondi L, Negrini M. Cyclin G1 is a target of miR-122a, a microRNA frequently down-regulated in human hepatocellular carcinoma. Cancer Res. 2007; 67:6092–9. https://doi.org/10.1158/0008-5472.CAN-06-4607.
59. Jopling CL, Yi M, Lancaster AM, Lemon SM, Sarnow P. Modulation of hepatitis C virus RNA abundance by a liver-specific MicroRNA. Science. 2005; 309:1577–81. https://doi.org/10.1126/science.1113329.
60. Krutzfeldt J, Rajewsky N, Braich R, Rajeev KG, Tuschl T, Manoharan M, Stoffel M. Silencing of microRNAs in vivo with ‘antagomirs’. Nature. 2005; 438:685–9. https://doi.org/10.1038/nature04303.
61. Wang WT, Ye H, Wei PP, Han BW, He B, Chen ZH, Chen YQ. LncRNAs H19 and HULC, activated by oxidative stress, promote cell migration and invasion in cholangiocarcinoma through a ceRNA manner. J Hematol Oncol. 2016; 9:117. https://doi.org/10.1186/s13045-016-0348-0.
62. Wang J, Liu X, Wu H, Ni P, Gu Z, Qiao Y, Chen N, Sun F, Fan Q. CREB up-regulates long non-coding RNA, HULC expression through interaction with microRNA-372 in liver cancer. Nucleic Acids Res. 2010; 38:5366–83. https://doi.org/10.1093/nar/gkq285.
63. Fan YH, Wu MJ, Jiang Y, Ye M, Lu SG, Wu L, Zhu XG. Long non-coding RNA HULC as a potential prognostic biomarker in human cancers: a meta-analysis. Oncotarget. 2017; 8:21410–7. https://doi.org/10.18632/oncotarget.15247.
64. Yang Z, Zhou L, Wu LM, Lai MC, Xie HY, Zhang F, Zheng SS. Overexpression of long non-coding RNA HOTAIR predicts tumor recurrence in hepatocellular carcinoma patients following liver transplantation. Ann Surg Oncol. 2011; 18:1243–50. https://doi.org/10.1245/s10434-011-1581-y.
65. Ishibashi M, Kogo R, Shibata K, Sawada G, Takahashi Y, Kurashige J, Akiyoshi S, Sasaki S, Iwaya T, Sudo T, Sugimachi K, Mimori K, Wakabayashi G, et al. Clinical significance of the expression of long non-coding RNA HOTAIR in primary hepatocellular carcinoma. Oncol Rep. 2013; 29:946–50. https://doi.org/10.3892/or.2012.2219.
66. Gao JZ, Li J, Du JL, Li XL. Long non-coding RNA HOTAIR is a marker for hepatocellular carcinoma progression and tumor recurrence. Oncol Lett. 2016; 11:1791–8. https://doi.org/10.3892/ol.2016.4130.
67. Ding C, Cheng S, Yang Z, Lv Z, Xiao H, Du C, Peng C, Xie H, Zhou L, Wu J, Zheng S. Long non-coding RNA HOTAIR promotes cell migration and invasion via down-regulation of RNA binding motif protein 38 in hepatocellular carcinoma cells. Int J Mol Sci. 2014; 15:4060–76. https://doi.org/10.3390/ijms15034060.
68. Lv J, Yu YQ, Li SQ, Luo L, Wang Q. Aflatoxin B1 promotes cell growth and invasion in hepatocellular carcinoma HepG2 cells through H19 and E2F1. Asian Pac J Cancer Prev. 2014; 15:2565–70.
69. Volders PJ, Helsens K, Wang X, Menten B, Martens L, Gevaert K, Vandesompele J, Mestdagh P. LNCipedia: a database for annotated human lncRNA transcript sequences and structures. Nucleic Acids Res. 2013; 41:D246-51. https://doi.org/10.1093/nar/gks915.
70. Volders PJ, Verheggen K, Menschaert G, Vandepoele K, Martens L, Vandesompele J, Mestdagh P. An update on LNCipedia: a database for annotated human lncRNA sequences. Nucleic Acids Res. 2015; 43:4363–4. https://doi.org/10.1093/nar/gkv295.
71. Lin A, Hu Q, Li C, Xing Z, Ma G, Wang C, Li J, Ye Y, Yao J, Liang K, Wang S, Park PK, Marks JR, et al. The LINK-A lncRNA interacts with PtdIns(3,4,5)P3 to hyperactivate AKT and confer resistance to AKT inhibitors. Nat Cell Biol. 2017; 19:238–51. https://doi.org/10.1038/ncb3473.
72. Seitz AK, Christensen LL, Christensen E, Faarkrog K, Ostenfeld MS, Hedegaard J, Nordentoft I, Nielsen MM, Palmfeldt J, Thomson M, Jensen MT, Nawroth R, Maurer T, et al. Profiling of long non-coding RNAs identifies LINC00958 and LINC01296 as candidate oncogenes in bladder cancer. Sci Rep. 2017; 7:395. https://doi.org/10.1038/s41598-017-00327-0.
73. Dinh TA, Vitucci EC, Wauthier E, Graham RP, Pitman WA, Oikawa T, Chen M, Silva GO, Greene KG, Torbenson MS, Reid LM, Sethupathy P. Comprehensive analysis of The Cancer Genome Atlas reveals a unique gene and non-coding RNA signature of fibrolamellar carcinoma. Sci Rep. 2017; 7:44653. https://doi.org/10.1038/srep44653.
74. Arroyo JD, Chevillet JR, Kroh EM, Ruf IK, Pritchard CC, Gibson DF, Mitchell PS, Bennett CF, Pogosova-Agadjanyan EL, Stirewalt DL, Tait JF, Tewari M. Argonaute2 complexes carry a population of circulating microRNAs independent of vesicles in human plasma. Proc Natl Acad Sci USA. 2011; 108:5003–8. https://doi.org/10.1073/pnas.1019055108.
75. Yamamoto Y, Kosaka N, Tanaka M, Koizumi F, Kanai Y, Mizutani T, Murakami Y, Kuroda M, Miyajima A, Kato T, Ochiya T. MicroRNA-500 as a potential diagnostic marker for hepatocellular carcinoma. Biomarkers. 2009; 14:529–38. https://doi.org/10.3109/13547500903150771.
76. Fleming NH, Zhong J, da Silva IP, Vega-Saenz de Miera E, Brady B, Han SW, Hanniford D, Wang J, Shapiro RL, Hernando E, Osman I. Serum-based miRNAs in the prediction and detection of recurrence in melanoma patients. Cancer. 2015; 121:51–9. https://doi.org/10.1002/cncr.28981.
77. Shigoka M, Tsuchida A, Matsudo T, Nagakawa Y, Saito H, Suzuki Y, Aoki T, Murakami Y, Toyoda H, Kumada T, Bartenschlager R, Kato N, Ikeda M, et al. Deregulation of miR-92a expression is implicated in hepatocellular carcinoma development. Pathol Int. 2010; 60:351–7. https://doi.org/10.1111/j.1440-1827.2010.02526.x.
78. R_Core_Team. R: A Language and Environment for Statistical Computing. (Vienna, Austria. 2015.
79. Love MI, Huber W, Anders S. Moderated estimation of fold change and dispersion for RNA-seq data with DESeq2. Genome Biol. 2014; 15:550. https://doi.org/10.1186/s13059-014-0550-8.