
INTRODUCTION
Rarity, complex pathogenesis and limited therapeutic options are the main features to deal with when addressing adrenocortical cancer (ACC). Mitotane is the drug that is currently used for the treatment of advanced and metastatic ACC [1]. However, toxicity, narrow therapeutic window and unwanted side effects represent major limitations to its use as well as therapeutic success [2, 3]. Thus, more effective and specific treatment options are needed.
The majority of currently published studies that investigate the cause of ACC, has analyzed only single pathways of signal transduction, but it is becoming clear that ACC pathogenesis involves integration of signals and the interplay of downstream pathways [2]. Among these, the IGF system and estrogen-dependent pathways appear to be of particular interest. In fact, IGFII is overexpressed in 90% of ACC and its effects are mediated through its receptor, IGF1R, resulting in the activation of kinase-dependent pathways [2]. Recently, we demonstrated a pivotal role of estrogen receptor alpha (ERα) in the activation of these same IGF pathways in response to estrogens [4]. Accordingly, in ACCs we found that ERα expression is up-regulated and estradiol enhances proliferation of the H295R adrenocortical cancer cells [5, 6]. Moreover, tamoxifen, a selective estrogen receptor modulator (SERM), inhibits estrogen- and IGF-II-stimulated H295R adrenocortical cancer cell proliferation in vitro and reduces H295R xenografts growth [4]. However, in addition to ERα modulation, it has been demonstrated that tamoxifen can act as full agonist on the G protein-coupled estrogen receptor (GPER) [7].
G-1 (1-[4-(6-bromobenzo [1, 3]dioxol-5yl)-3a,4,5,9b-tetrahydro-3H-cyclopenta-[c]quinolin-8-yl]-ethanone), a non-steroidal GPER agonist, has been developed to dissect GPER-mediated estrogen responses from those mediated by classic estrogen receptors, ERα and β [8]. Since its discovery, G-1 has been used in a large number of studies to investigate the role of GPER in numerous systems including the nervous, immune, reproductive and vascular systems as well as cancer [9–11]. It is worth mentioning that the biological activities triggered by G-1-mediated GPER activation, such as cell proliferation [7, 12] and/or cell death [10, 13], appear to be cell type specific and dependent on the ERs expression pattern [14]. The picture becomes even more complex considering the effects elicited by G-1 in a GPER-independent manner [15]. According to our previous study, G-1 is able to inhibit ACC cell growth both in vitro and in vivo [16]. In particular, cell cycle arrest and activation of the intrinsic apoptotic pathway were triggered by G-1 via long-term sustained ERK phosphorylation in a GPER-independent fashion. The aim of this study was to define in detail the G-1-activated pathways in adrenocortical cancer and associated with cell death in response to G-1 treatment. Transcription analysis defined the gene expression alternations in H295R cells exposed to G-1, that were further investigated.
RESULTS
G-1-inducible genes in H295R cells defined by microarray analysis
To identify genes that were induced by G-1 in H295R cells, we cultured cells with or without G-1 (1μM) for 24h. This exposure time point was selected from previous results demonstrating 24h as the first visible signs of G-1-induced apoptosis. Total RNA was extracted and subjected to microarray analysis using Affymetrix human U133 plus 2.0 GeneChips. By using the GeneChips analysis suite, we sorted genes that were either up- or down-regulated by greater than two-fold following G-1 treatment in three independent experiments (Figure 1A). Several genes were modulated by G-1 in all three experiments but we focused our attention on Egr-1, a gene with a role in both cell growth and apoptosis [17]. Egr-1 was up-regulated by 2.9-fold, a result that was further confirmed in H295R cells at both transcriptional and post-transcriptional level (Figure 1B) by real-time reverse transcription PCR (qRT-PCR) and Western blot analyses, respectively.
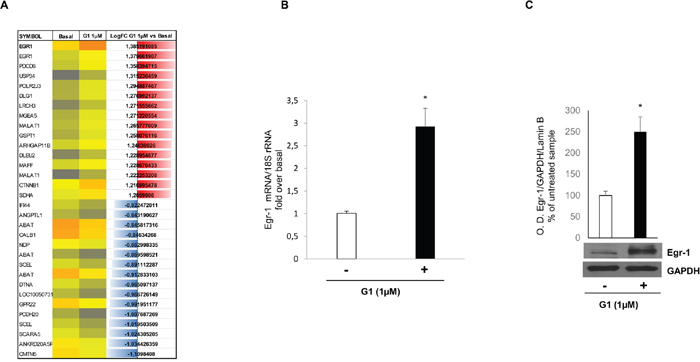
Figure 1: G-1 stimulation induces Egr-1 expression in H295R cells. (A) representative microarray analysis with the most highly up-regulated (blu) and down-regulated (red) genes. (B) Egr-1 mRNA expression in H295R cells treated for 24 h with vehicle (−) or G-1 (1μM) was analyzed by real time RT-PCR. Each sample was normalized to 18S rRNA content. Final results are expressed as n-fold differences of gene expression relative to calibrator. Data represent the mean ± SD of values from at least three separate RNA samples (*p < 0.001, versus calibrator). (C) Total extracts from H295R cells left untreated (–) or treated with G-1 (1μM) for 24 h were resolved by SDS-PAGE and subjected to immunoblot analysis using specific antibodies against human Egr-1. Blots are representative of three independent experiments with similar results. GAPDH served as loading controls. The upper graph are optical densities (O. D.) ±SD, **p < 0.01.
G-1 induces Egr-1 nuclear translocation in H295R cells
Egr-1 is a nuclear transcription factor that represents a point of convergence of many intracellular signaling pathways [18]. To verify its nuclear translocation upon G-1 treatment we used different experimental approaches. First, we performed immunofluorescence assay where untreated or G-1-treated cells were fixed and incubated with anti-Egr-1 antibody followed by an incubation with a secondary FITC-conjugated antibody. In Figure 2A (upper panel) positive nuclear staining for Egr-1 is clearly visible after 24h treatment with G-1 while in untreated control cells Egr-1 appears as dotted areas within the cytoplasm and around the nucleus. Moreover, immunohistochemistry using tissue slides of H295R xenograft tumors derived from mice treated with vehicle and G-1 showed an increased cytoplasmic and nuclear staining for Egr-1 after G-1 exposure (Figure 2A, lower panel), as demonstrated by Allred immunostaining score (Table 1) [16]. In addition, Western blot analysis of cytoplasmic and nuclear protein clearly showed that Egr-1 accumulates within the nuclei after 24h treatment with G-1 1μM (Figure 2B). These results clearly showed that G-1 causes Egr-1 activation in H295R cells.
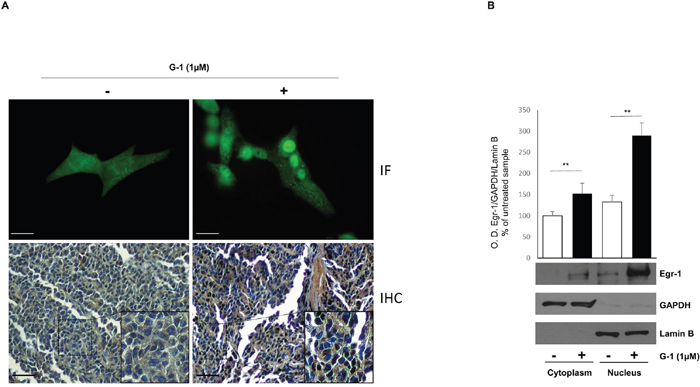
Figure 2: G-1 induces nuclear translocation of Egr-1 in H295R cells. (A) (Upper panel) positive nuclear fluorescent staining for Egr-1 expression in H295R cells treated for 24 with vehicle (−) or G-1 (1μM). (A) (Lower panel) immunohistochemical staining for Egr-1 in untreated and G-1 treated H295R xenograft tumors. Insets are an higher magnification (400x) of the marked area. (B) Cytoplasmic and nuclear extracts from H295R cells left untreated (–) or treated with G-1 (1μM) for 24 h were resolved by SDS-PAGE and subjected to immunoblot analysis using specific antibodies against human Egr-1. Blots are representative of three independent experiments with similar results. GAPDH and Lamin B served as loading controls. The upper graph are optical densities obtained from three independent experiments ±SD, **p < 0.001.
Table 1: Egr-1 immunoreactivity (Allred score) in xenografted H295R cells
Untreated control cells |
G-1 1μM |
|
|---|---|---|
Cytoplasm |
1 |
3* |
Nucleus |
3 |
7* |
Total immunostaining score (n: 6-7 serial section for each treatment): Proportion score + Intensity score (range 0–8). Significant difference: *p < 0.05 compared to untreated control cells.
G-1 induces ROS-dependent Egr-1 upregulation
Several studies indicate that Egr-1 is induced by a number of extracellular stimuli, including growth factors, mitogens, cytokines and injury-related stimuli as well as many inducers of ROS-mediated signaling and inflammation leading to cell death [18]. In our previous work we demonstrated that G-1 inhibits H295R cell growth by activating the mitochondrial apoptotic pathway [16] and one of the mechanisms able to induce mitochondria-dependent apoptosis is through the generation of ROS. Therefore, we investigated the ability of G-1 to generate intracellular ROS. To this aim, H295R cells were treated for different times with G-1 and then incubated with CM-H2DCFDA. H2DCFDA is rapidly taken up by the cells where, is converted into non-fluorescent CM-H2DCF by esterase action and subsequently oxidized by intracellular oxidants, such as ROS, into highly fluorescent CM-DCF. The fluorescence intensity was monitored using a microplate reader (Ex/Em: ~492–495/517–527 nm). Results illustrated in Figure 3A show how G-1 is able to increase ROS production up to 24h, an event that was promptly reversed when cells were pre-treated for 1h with 5mM NAC, a commonly used reactive oxygen intermediate scavenger. Because G-1 generated ROS and Egr-1 expression were maximal between 12 and 24h, (data not shown), potential ROS-induced regulation of Egr-1 expression was investigated. Immunoblotting data indicated that blocking the generation of ROS by pre-treating cells with NAC markedly prevented G-1-induced Egr-1 protein expression (Figure 3B). In addition, we already demonstrated that G-1 treatment caused sustained ERK1/2 phosphorylation leading to cell death by apoptosis [16]. Here we also showed that pre-treatment of H295R cells with NAC prevented G-1-induced ERK1/2 phosphorylation (Figure 3C). These results clearly show the requirement of ROS formation in ERK1/2 activation by G-1.
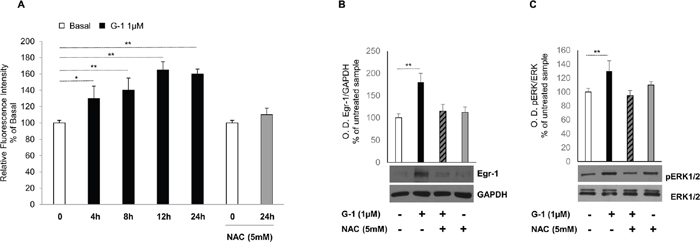
Figure 3: G-1-induced Egr-1 expression is associated with ROS generation in H295R cells. (A) H295R cells were treated for different times with G-1 (1μM) and then incubated with 5-(and-6)-chloromethyl-2′,7′-dichlorodihydrofluorescein diacetate (CM-H2DCFDA). Where indicated cells were pre-treated for 1 h with NAC (5mM), and then treated with G-1 (1μM) for 24 h and finally incubated with 5-(and-6)-chloromethyl-2′,7′-dichlorodihydrofluorescein diacetate (CM-H2DCFDA). Relative fluorescence intensity was monitored using a microplate reader (Ex/Em: ~492–495/517–527 nm). ROS generation was expressed as relative fluorescence intensity of treated cells versus untreated control cells. Each column represents the mean ± SD of three independent experiments. (B and C) H295R cells were pre-treated with NAC (5 mM) for 1h and then treated for 24h with vehicle (−) or G-1 (1μM). Western blot analysis of Egr-1 and GAPDH, used as a loading control (B), or pERK1/2 and total ERK1/2 (C) was performed on equal amounts of total proteins. Blots are representative of three independent experiments with similar results, (*p < 0.05, **p < 0.001) compared to untreated control sample.
G-1 activates Egr-1/BAX signaling in H295R cells through ERK signaling
The existence of a close association between ROS formation and the activation of MAPK signaling has long been known [19, 20]. Indeed, in mammalian cells there are three well-defined subgroups of MAPKs: the extracellular signal regulated kinases (ERKs), the c-Jun N-terminal kinases (JNK), and the p38-MAPK. The three subgroups of MAPKs are involved in both cell growth and cell death, and the tight regulation of these pathways is paramount in determining cell fate [21]. To determine whether the activation of ERK, JNK and p38-MAPK participated in G-1-mediated upregulation of Egr-1 expression, the effects of specific inhibitors for ERK (PD98059), JNK (SP600125), and P38 (SB203580) were tested on G-1-treated cells (Figure 4A). The results showed that pretreatment with PD98059 did abrogate G-1-induced Egr-1 expression. By contrast, pharmacological inhibition of p38-MAPK or JNK activity failed to suppress G-1-induced Egr-1 expression. Moreover, upregulation of Egr-1 expression was concomitant with an increased expression, at both transcriptional (data not shown) and post-transcriptional (Figure 4B and 4C) levels, of two known Egr-1 target genes, specifically p21Waf1/Cip1 and BAX. Both proteins have been shown to play a role in G-1-mediated H295R cell cycle arrest and apoptosis [16].
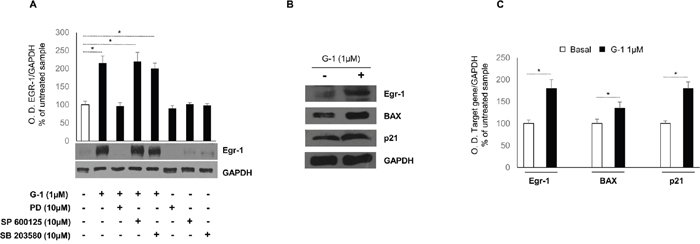
Figure 4: Role of MAPKs and Egr-1/BAX signaling in G-1-treated H295R cells. (A) H295R cells were treated for 24 h with vehicle (−) or G-1 (1μM) alone or combined with PD98059 (10μM ), SP600125 (10μM), SB203580 (10μM). Western blot analysis of Egr-1was performed on equal amounts of total proteins. GAPDH was used as a loading control. Blots are representative of three independent experiments with similar results. Graph represents mean of Egr-1 optical density (O.D.) from three independent experiments with similar results normalized to GAPDH content (*p < 0.01 compared to untreated control sample assumed as 100). (B) Total proteins from H295R cells left untreated (–) or treated with G-1 (1μM) for 24 h were resolved by SDS-PAGE and subjected to immunoblot analysis using specific antibodies against human Egr-1, BAX, p21Waf1/Cip1. Blots are representative of three independent experiments with similar results. GAPDH served as loading control. (C) Histograms represent the mean ± SD of band intensities evaluated as optical density (O.D.) arbitrary units and expressed as the percentage of the control assumed as 100%, *p < 0.01 compared with untreated cells.
Egr-1 gene silencing abolishes G-1-mediated effects on H295R cells
To further define the prominent role of Egr-1 in G-1-mediated effects, we decided to silence Egr-1 gene expression. In this experimental condition, we first examined the effect of gene silencing on the ability of G-1 to upregulate Egr-1 target genes such as p21Waf1/Cip1 and BAX. As show in Figure 5, silencing of Egr-1 gene expression (Figure 5A) abrogated the transcription of both p21Waf1/Cip1 (Figure 5B) and BAX (Figure 5C) genes following G-1 treatment. Considering that these two genes are responsible for the inhibitory effects exerted by G-1 on H295R cell growth [16], we also investigated the impact of Egr-1 gene silencing on G-1-mediated inhibition of cell viability. Results showed in Figure 5D clearly demonstrated that G-1 was unable to reduce the viability in cells with an impaired expression of Egr-1 (Figure 5E and 5F).
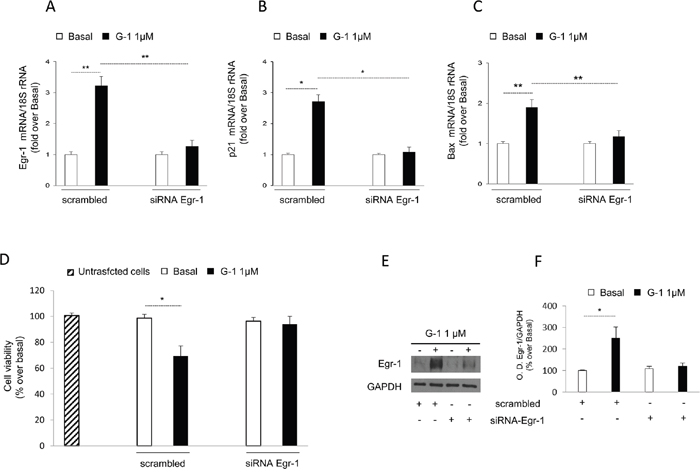
Figure 5: Egr-1 gene silencing reversed G-1-induced effects on H295R. (A-C) Q-PCR analysis was performed in H295R cells to evaluate the expression of Egr-1 or p21Waf1/Cip1 or BAX mRNA in the absence (-) or presence of control siRNA (scramble) or siRNA specific for Egr-1. Ribosomal 18S subunit mRNA was used as internal control. (D) MTT assay was performed on H295R cells untransfected, transfected with specific siRNA for Egr-1 or scrambled siRNA for 24h, as indicated in Materials and Methods, and then left untreated (-) or treated with G-1 for additional 24h. (E) To assess reduced Egr-1 protein expression in cells used for viability assay, random wells from untreated or G-1 treated cells were used for protein extraction and Western blotting analysis. GAPDH protein expression was used as loading control. (F) Histograms represent the mean ± SD of band intensities evaluated as optical density (O.D.) arbitrary units and expressed as the percentage of the control assumed as 100%. Data represent the mean ± SD of three separate experiments each in triplicate. *p < 0.05, **p < 0.001, compared with untreated cells.
DISCUSSION
In a previous study we showed that micromolar concentrations of G-1 significantly suppressed H295R cell proliferation both in vitro and in vivo by the activation of the intrinsic mitochondria-mediated apoptotic pathway and the associated molecular mechanism involving the long and sustained phosphorylation of ERK1/2 [16].
Since G-1 has been reported to be a selective GPER agonist, we expected that knockdown of GPER in H295R cells, might completely abrogate H295R cell growth inhibition. Surprisingly, when we effectively knocked down GPER expression by siRNA, we found that the inhibitory effects of G-1 were only partially reversed. This finding suggested that G-1 might also suppress H295R cell proliferation in a GPER-independent manner. This hypothesis was supported by others describing the inhibitory role of G-1 regardless of GPER expression in both breast and ovarian cancer cell lines [15], as well as in human ovarian endometriosis stromal [22] and vascular smooth muscle cells [23].
The aim of the this study was to clarify the potential intracellular targets and the mechanisms activated by G-1 to inhibit ACC cell proliferation and induce apoptosis. For these reasons, we started our study with a microarray analysis of H295R cells treated with G-1. Of several genes that were either up-regulated or down-regulated by G-1 treatment, we focused our attention on upregulated Egr-1 gene for two main reasons. First, Egr-1 is involved in G-1 induced signaling in different tumor cells [24]; second, Egr-1 has a dichotomic function since it can work as oncogene but also as tumor suppressor [18].
Egr-1, also known as NGFI-A, Zif268, T1S8 and krox-24, is a Cys2-His2-type zinc-finger transcription factor, is a member of the immediate-early gene family mapping to chromosome 5 [25]. Its modular structure ensures a rapid response to different stimuli which results in the transcription of several target genes involved not only in the regulation of cell growth and differentiation, but also in determining apoptosis [18, 26].
Our results clearly showed that G-1 significantly upregulated Egr-1 expression at both the transcript and protein level. Moreover, its nuclear translocation, as evidenced by immunofluorescence and immunohistochemistry assays, highlighted G-1 ability to increase and activate Egr-1.
In addition to its regulation by multiple extracellular stimuli [18], Egr-1 can be considered a redox-regulated gene because it is activated by all inducers of ROS-mediated signaling and inflammation [27–31]. This feature is due to the presence of oxidative stress-responsive DNA sequence within its promoter region [32], and most inducers of ROS-mediated signaling pathways increase the levels of Egr-1 [27–31]. Here we determined that G-1 induces ROS production in a GPER-independent manner. It is worth noting that other tumor types respond to G-1 treatment activating ROS production [33–35]. However, in contrast to our observation on a GPER-independent mechanism, those studies claim the involvement of G-protein receptor. Indeed, we previously demonstrated that doses of G-1 1μM and onward elicit GPER-independent effects as supported by RNA interference experiments [16]. In agreement with previous observations on the biological effects exerted by G-1, we proved that G-1 activated the intrinsic apoptotic pathway where mitochondria play a key role as target of different stress stimuli including, above all, ROS [36]. Therefore, we demonstrated that treatment of ACC cells with G-1 results in a significant increase in ROS production that was no longer detectable in the presence of the antioxidant NAC. The same observation was recently reported for colon cancer [37]. Taking into account the critical role of Egr-1 in coordinating cellular events following oxidative stress [38–40], we showed that the presence of NAC was also able to reverse G-1-mediated up-regulation of Egr-1 expression. The scavenger effect of NAC on the G-1-dependent ROS increase has also been shown with regard to the activation of ERK1/2, one of the major ROS targets that is responsible for the up-regulation of the pro-apoptotic factor BAX in ACC cells [16]. Other important targets of ROS are represented by JNK and p38MAPK. Therefore, using specific inhibitors of these pathways, the results clearly demonstrated a selective involvement of ERK pathway in mediating the G-1 induced Egr-1 expression. By contrast, no role was observed for both JNK and p38. These findings are in agreement with those of others revealing that MAPKs regulate the expression of Egr-1 under stress conditions and elevated ROS levels [41, 42].
Finally, after silencing Egr-1 we confirmed its involvement in cell cycle arrest and mitochondrial apoptotic process. In fact, the upregulation of p21Waf1/Cip1 and BAX expression seen under G-1 treatment, and consequently, the inhibitory effect on cell viability, were promptly reversed by silencing Egr-1 gene expression. These last results underlie the prominent role of Egr-1 in the inhibitory effects exerted by G-1 on ACC cells.
In conclusion, despite several reports indicate G-1 ability to increase ROS production and then cell apoptosis, a clear mechanism has not been defined. We can only confirm what we have already reported [16] that mitochondrial dysfunctions and mitochondrial-mediated apoptotic pathways are involved in the inhibitory effects of G-1.
Extending the findings of our previous study [16] we demonstrate that 1) G-1 increases intracellular ROS production in ACC cells, 2) ROS increases Egr-1 mRNA and protein expression most probably trough the activation of ERK1/2 signaling, 3) the increased expression and activation of Egr-1 causes a marked up-regulation of its target genes such as the pro-apoptotic factor BAX and the cell cycle inhibitor p21Waf1/Cip1 responsible for the inhibitory effect exerted by G-1 on ACC cells. The identification of ROS/MAPK/Egr-1/BAX pathway as specific target activated by micromolar concentration of G-1 gives indication for new pharmacological approaches addressed to ACC therapy.
MATERIALS AND METHODS
Cell culture and MTT assay
H295R cells were cultured as previously described [16]. Cell monolayers were subcultured onto 60 mm dishes for protein and RNA extraction (4 x 10⁶ cells/plate) and 12 well/plate (1 × 10⁵ cells per well) for the MTT assay. Prior to experiments, cells were starved overnight in DMEM/F-12 medium without phenol red. Cells were treated with (G-1, 1μM) (Tocris Bioscience, Bristol, UK) in DMEM/F-12 containing 2, 5% FBS-DCC (fetal bovine serum dextran-coated charcoal-treated). Inhibitors such as PD98059 (10μM), SB203580 (10μM), SP600125 (10 μM) (Calbiochem, Merck KGaA, Darmstadt, Germany) and ROS scavenge molecule NAC (N-acetyl cysteine, Sigma) (5mM) were used 1h prior to G-1. Cell viability was measured using MTT assay (Sigma-Aldrich) as already reported [43]. Each experiment was performed in triplicate and the optical density was measured at 570 nm in a spectrophotometer. Experiments were repeated three times.
Microarray
RNA from H295R cells untreated (basal) or treated for 24 hour with G-1 (1μM) were hybridized to an Affymetrix human HG-U133plus oligonucleotide two-microarray set containing more than 54,000 probe sets representing over 38,500 independent human genes (Affymetrix, Santa Clara, CA). The arrays were scanned at high resolution using an Affymetrix GeneChip Scanner 3000. Results were analyzed using GeneSpring version 6.1 software (Silicon Genetics, Redwood City, CA). Pure signal values were normalized using a list of 100 normalization control probe sets published by Affymetrix and used to identify genotypic differences between untreated and treated cells. Probe ID for Egr-1: 227404 PM.
RNA extraction, reverse transcription and real time PCR
TRizol RNA isolation system (Invitrogen, Carlsbad, CA, USA) was used to extract total RNA from H295R. Each RNA sample was treated with DNase I (Invitrogen), and purity and integrity of the RNA were confirmed spectroscopically and by gel electrophoresis before use. One microgram of total RNA was reverse transcribed in a final volume of 30 μl using the ImProm-II Reverse transcription system kit (Promega Italia S.r.l., Milano, Italy); cDNA was diluted 1:2 in nuclease-free water, aliquoted, and stored at −20°C. The nucleotide sequences for Egr-1, p21Waf1/Cip1 and BAX amplification were: Egr-1, forward, 5′-CTCTCCAGCCTGCTCGTC-3′, and reverse, 5′-AGCAGCATCATCTCCTCCAG-3′; p21Waf1/Cip1, forward, 5‘-CATGACAGATTTCTACCACTCC-3’ and reverse, 5‘-AAGATGTAGAGCGGGCCTTT-3’; BAX, forward 5‘-GCTCTGAGCAGATCATGAAGACA-3’ and reverse 5‘-TCGCCCTGCTCGATCCT-3’. The nucleotide sequences for 18S amplification were forward, 5’-CGGCGACGACCCATTCGAAC-3’, and reverse, 5’-GAATCGAACCCTGATTCCCCGTC-3’. PCR reactions were performed in the iCycler iQ Detection System (Bio-Rad Laboratories S.r.l., Milano, Italia) using 0.1 μmol/L of each primer, in a total volume of 30 μl reaction mixture following the manufacturer’s recommendations. SYBR Green Universal PCR Master Mix (Bio-Rad) with the dissociation protocol was used for gene amplification; negative controls contained water instead of first-strand cDNA. Each sample was normalized to its GAPDH content. The relative gene expression levels were normalized to a calibrator (Basal, untreated H295R cells). Final results were expressed as n-fold differences in gene expression relative to GAPDH and calibrator, calculated using the ΔΔCt method as previously published [16].
Egr-1 gene silencing
Cells were plated with regular growth medium two days before transfection to 50–60% confluence.
The day of transfection the medium was changed with SFM without P/S, and cells were transfected with selected validated siRNA for Egr1 (ID: s4538) or control siRNA (scrambled) (AMBION), to a final concentration of 30 pmol/well (6 well/plate) or 15 pmol/well (12 well/plate) using Lipofectamine RNAiMAX Reagent (Invitrogen) as recommended by the manufacturer. After 6 h, the transfection medium was changed with DMEM/F-12 containing 2,5% FBS-DCC in order to avoid Lipofectamine toxicity. 24h post-transfection cells were exposed to vehicle or G-1 for further 24h and then harvested (RT-PCR and Western blotting) or processed for the viability assay.
ROS detection
ROS formation inside the cells were quantified using 2,7-dichlorodihydrofluorescein diacetate (H2-DCFDA). The acetate group of H2-DCFDA is removed by the intracellular esterase forming 2′,7′-dichlorofluorescin (DCF). In presence of ROS, non-fluorescent DCF formed is converted into a fluorescent product. The increase in fluorescence intensity is proportional to the oxidation of the fluorescent probe. Cells were seeded at a density of 50 000 cells/well in 24 well/plate and cultured for 48h and then treated with G-1 (1μM) for different times. Moreover, to determine the effects of NAC (5mM) on G-1-induced ROS generation, cells were pretreated 1h before adding G-1 for 24h. After incubation, the cells were loaded with H2-DCFDA (5μM/well) and incubated for 30 min in the dark. The wells were washed with PBS to remove excess of probe. The fluorescence was measured using fluorescent microplate reader (Monochromator based multimode microplate reader, BioTeck Sinergy H1 Instrument) with excitation at 495 nm and emission at 530 nm.
Protein extraction and Western-blotting
To obtain cytoplasmic and nuclear proteins cells were lifted in ice-cold PBS, transfered to 15 ml tubes, centrifuged for 5 min at 3000 rpm and resuspended in 200 μl of buffer A (10 mM N-2-hydroxyethylpiperazine N′-2-ethanesulfonic acid (HEPES), PH 7.9, 0.1 mM EDTA, 0.1 mM EGTA, 10 mM KCl, 1 mM dithiothreitol and 0.5 mM phenylmethylsulfonyl fluoride). After swelling on ice for 10 min, plasma membranes were disrupted by adding 0.1% Nonidet P-40 and vortexing for 10 sec. Lysates were transferred to 1.5 ml tubes. After centrifugation for 10 min at 10000 rpm at 4°C, supernatant contained cytoplasmic proteins while pellet contained nuclei.
Nuclei were washed twice with ice cold PBS. Nuclei were incubated for 20 min on ice in buffer C (20 mM HEPES PH 7.9, 1 mM EDTA, 1 mMEGTA, 400 mM NaCl, 1 mM dithiothreitol and 1 mM phenylmethylsulfonyl fluoride vortexing every 5 min. Samples were centrifuged at 12,000 rpm for 15 min at 4°C to recover nuclear fraction (supernatant).
Total protein were prepared using RIPA buffer: 50 mM Tris, pH 8.0, 150 mM sodium chloride; 1.0% NP-40, 0.5% sodium deoxycholate, 0.1% SDS (sodium dodecyl sulfate).
Fifty μg of protein were subjected to Western blot analysis. Blots were incubated overnight at 4°C with antibodies against Egr-1, p21Waf1/Cip1 and BAX (all from Santa Cruz Biotechnology, Santa Cruz CA, USA). Membranes were incubated with horseradish peroxidase (HRP)-conjugated secondary antibodies (Amersham Pharmacia Biotech, Piscataway, NJ) and immunoreactive bands were visualized with the ECL Western blotting detection system (Amersham). To assure equal loading of proteins, membranes were stripped and incubated overnight with anti-Glyceraldehyde 3-Phosphate DeHydrogenase (GAPDH) or anti-Lamin B (nuclear fraction in Figure 2B) antibodies, (Santa Cruz Biotechnology, Santa Cruz, CA, USA).
Immunofluorescence and immunohistochemistry
For immunofluorescent analysis (IF), H295R cells were plated on glass coverslips, washed with PBS and fixed with 3.7% formaldehyde in PBS for 20 min at room temperature (RT), followed by permeabilization with 0.2% Triton X-100 in PBS for 3 min at RT. Coverslips were washed with PBS, and nonspecific binding of IgG was blocked with 3% BSA (Sigma) in PBS for 20 min at room temperature. Cells were then incubated overnight in a cold room with an anti-Egr-1 antibody (Santa Cruz Biotechnology,). The following day coverslips were washed three times with PBS, and incubated with fluorescein isothiocyanate-conjugated secondary antibodies (Santa Cruz) for 1h at room temperature. Finally, coverslips were washed three times with PBS and mounted on glass slides with Vectashield mounting medium (Vector Laboratories Inc., CA, USA). Fluorescent images were collected on Olympus fluorescent microscope.
From our previous work we had access to 5 mm thick paraffin-embedded sections of H295R xenograft tumors from mice treated with vehicle and G-1 [16]. Slides were deparaffinized and dehydrated (seven to eight serial sections). Immunohistochemical (IHC) experiments were performed as previously described [16], using Egr-1 primary antibody at 4°C over-night. Then, a biotinylated goat-anti-mouse IgG was applied for 1h at room temperature, to form the avidin biotin-horseradish peroxidase complex (Vector Laboratories, CA, USA). Immunoreactivity was visualized by using diaminobenzidine chromogen (Vector Laboratories). The primary antibody was replaced by normal rabbit serum in negative control sections for both IF and IHC experiments.
Scoring system
The immunostained slides of tumor samples were evaluated as previously described [43] by using the Allred Score. Briefly, a proportion score was assigned representing the estimated proportion of positively stained tumor cells (0 = none; 1 = 1/100; 2 = 1/100 to <1/10; 3 = 1/10 to <1/3; 4 = 1/3 to 2/3; 5 = >2/3). An intensity score was assigned by the average estimated intensity of staining in positive cells (0 = none; 1 = weak; 2 = moderate; 3 = strong). Proportion score and intensity score were added to obtain a total score that ranged from 0 to 8. A minimum of 100 cells were evaluated in each slide. Six to seven serial sections were scored in a blinded manner for each sample.
Statistics
All experiments were performed at least three times. Data were expressed as mean values ± standard deviation (SD), statistical significance between control and treated samples was analyzed using GraphPad Prism 5.0 (GraphPad Software, Inc.; La Jolla, CA) software. Control and treated groups were compared using the analysis of variance (ANOVA). A comparison of individual treatments was also performed, using Student’s t test. Significance was defined as p < 0.05.
Author contributions
Conceived and designed the experiments: IC, VP. Performed the experiments: IC, ADL, VR, AC, CC, FT. Analyzed the data: IC, ADL, WR, VP. Wrote the paper: IC, PA, RS.
CONFLICTS OF INTEREST
The authors declare that no competing interests exist.
FUNDING
This work was supported by Associazione Italiana per la Ricerca sul Cancro (AIRC) projects n. IG-14433 to Vincenzo Pezzi, IG-15230 to Sirianni Rosa. ex-60%, fondi MIUR Ivan Casaburi; ex-60%, fondi MIUR, Vincenzo Pezzi.
REFERENCES
1. Glover AR, Ip JC, Zhao JT, Soon PS, Robinson BG, Sidhu SB. Current management options for recurrent adrenocortical carcinoma. Onco Targets Ther. 2013; 6: 635-43. https://doi.org/10.2147/OTT.S34956.
2. Else T, Kim AC, Sabolch A, Raymond VM, Kandathil A, Caoili EM, Jolly S, Miller BS, Giordano TJ, Hammer GD. Adrenocortical carcinoma. Endocr Rev. 2014; 35: 282-326. https://doi.org/10.1210/er.2013-1029.
3. Ronchi CL, Kroiss M, Sbiera S, Deutschbein T, Fassnacht M. EJE prize 2014: current and evolving treatment options in adrenocortical carcinoma: where do we stand and where do we want to go? Eur J Endocrinol. 2014; 171: R1-R11. https://doi.org/10.1530/EJE-14-0273.
4. Sirianni R, Zolea F, Chimento A, Ruggiero C, Cerquetti L, Fallo F, Pilon C, Arnaldi G, Carpinelli G, Stigliano A, Pezzi V. Targeting estrogen receptor-alpha reduces adrenocortical cancer (ACC) cell growth in vitro and in vivo: potential therapeutic role of selective estrogen receptor modulators (SERMs) for ACC treatment. J Clin Endocrinol Metab. 2012; 97: E2238-50. https://doi.org/10.1210/jc.2012-2374.
5. Barzon L, Masi G, Pacenti M, Trevisan M, Fallo F, Remo A, Martignoni G, Montanaro D, Pezzi V, Palu G. Expression of aromatase and estrogen receptors in human adrenocortical tumors. Virchows Arch. 2008; 452: 181-91. https://doi.org/10.1007/s00428-007-0542-0.
6. Montanaro D, Maggiolini M, Recchia AG, Sirianni R, Aquila S, Barzon L, Fallo F, Ando S, Pezzi V. Antiestrogens upregulate estrogen receptor beta expression and inhibit adrenocortical H295R cell proliferation. J Mol Endocrinol. 2005; 35: 245-56. https://doi.org/10.1677/jme.1.01806.
7. Vivacqua A, Bonofiglio D, Recchia AG, Musti AM, Picard D, Ando S, Maggiolini M. The G protein-coupled receptor GPR30 mediates the proliferative effects induced by 17beta-estradiol and hydroxytamoxifen in endometrial cancer cells. Mol Endocrinol. 2006; 20: 631-46. https://doi.org/10.1210/me.2005-0280.
8. Bologa CG, Revankar CM, Young SM, Edwards BS, Arterburn JB, Kiselyov AS, Parker MA, Tkachenko SE, Savchuck NP, Sklar LA, Oprea TI, Prossnitz ER. Virtual and biomolecular screening converge on a selective agonist for GPR30. Nat Chem Biol. 2006; 2: 207-12. https://doi.org/10.1038/nchembio775.
9. Prossnitz ER, Barton M. Estrogen biology: new insights into GPER function and clinical opportunities. Mol Cell Endocrinol. 2014; 389: 71-83. https://doi.org/10.1016/j.mce.2014.02.002.
10. Chimento A, Casaburi I, Bartucci M, Patrizii M, Dattilo R, Avena P, Ando S, Pezzi V, Sirianni R. Selective GPER activation decreases proliferation and activates apoptosis in tumor Leydig cells. Cell Death Dis. 2013; 4: e747. https://doi.org/10.1038/cddis.2013.275.
11. Chimento A, Sirianni R, Casaburi I, Pezzi V. GPER signaling in spermatogenesis and testicular tumors. Front Endocrinol (Lausanne). 2014; 5: 30. https://doi.org/10.3389/fendo.2014.00030.
12. Albanito L, Lappano R, Madeo A, Chimento A, Prossnitz ER, Cappello AR, Dolce V, Abonante S, Pezzi V, Maggiolini M. Effects of atrazine on estrogen receptor alpha- and G protein-coupled receptor 30-mediated signaling and proliferation in cancer cells and cancer-associated fibroblasts. Environ Health Perspect. 2015; 123: 493-9. https://doi.org/10.1289/ehp.1408586.
13. Chen JR, Plotkin LI, Aguirre JI, Han L, Jilka RL, Kousteni S, Bellido T, Manolagas SC. Transient versus sustained phosphorylation and nuclear accumulation of ERKs underlie anti-versus pro-apoptotic effects of estrogens. J Biol Chem. 2005; 280: 4632-8. https://doi.org/10.1074/jbc.M411530200.
14. Ariazi EA, Brailoiu E, Yerrum S, Shupp HA, Slifker MJ, Cunliffe HE, Black MA, Donato AL, Arterburn JB, Oprea TI, Prossnitz ER, Dun NJ, Jordan VC. The G protein-coupled receptor GPR30 inhibits proliferation of estrogen receptor-positive breast cancer cells. Cancer Res. 2010; 70: 1184-94. https://doi.org/10.1158/0008-5472.CAN-09-3068.
15. Wang C, Lv X, Jiang C, Davis JS. The putative G-protein coupled estrogen receptor agonist G-1 suppresses proliferation of ovarian and breast cancer cells in a GPER-independent manner. Am J Transl Res. 2012; 4: 390-402.
16. Chimento A, Sirianni R, Casaburi I, Zolea F, Rizza P, Avena P, Malivindi R, De Luca A, Campana C, Martire E, Domanico F, Fallo F, Carpinelli G, et al. GPER agonist G-1 decreases adrenocortical carcinoma (ACC) cell growth in vitro and in vivo. Oncotarget. 2015; 6: 19190-203. https://doi.org/10.18632/oncotarget.4241.
17. Pagel JI, Deindl E. Early growth response 1—a transcription factor in the crossfire of signal transduction cascades. Indian J Biochem Biophys. 2011; 48: 226-35.
18. Thiel G, Cibelli G. Regulation of life and death by the zinc finger transcription factor Egr-1. J Cell Physiol. 2002; 193: 287-92. https://doi.org/10.1002/jcp.10178.
19. McCubrey JA, Lahair MM, Franklin RA. Reactive oxygen species-induced activation of the MAP kinase signaling pathways. Antioxid Redox Signal. 2006; 8: 1775-89. https://doi.org/10.1089/ars.2006.8.1775.
20. Ray PD, Huang BW, Tsuji Y. Reactive oxygen species (ROS) homeostasis and redox regulation in cellular signaling. Cell Signal. 2012; 24: 981-90. https://doi.org/10.1016/j.cellsig.2012.01.008.
21. Dhillon AS, Hagan S, Rath O, Kolch W. MAP kinase signalling pathways in cancer. Oncogene. 2007; 26: 3279-90. https://doi.org/10.1038/sj.onc.1210421.
22. Mori T, Ito F, Matsushima H, Takaoka O, Tanaka Y, Koshiba A, Kusuki I, Kitawaki J. G protein-coupled estrogen receptor 1 agonist G-1 induces cell cycle arrest in the mitotic phase, leading to apoptosis in endometriosis. Fertil Steril. 2015; 103: 1228-35 e1. https://doi.org/10.1016/j.fertnstert.2015.01.026.
23. Gui Y, Shi Z, Wang Z, Li JJ, Xu C, Tian R, Song X, Walsh MP, Li D, Gao J, Zheng XL. The GPER agonist G-1 induces mitotic arrest and apoptosis in human vascular smooth muscle cells independent of GPER. J Cell Physiol. 2015; 230: 885-95. https://doi.org/10.1002/jcp.24817.
24. Vivacqua A, Romeo E, De Marco P, De Francesco EM, Abonante S, Maggiolini M. GPER mediates the Egr-1 expression induced by 17beta-estradiol and 4-hydroxitamoxifen in breast and endometrial cancer cells. Breast Cancer Res Treat. 2012; 133: 1025-35. https://doi.org/10.1007/s10549-011-1901-8.
25. Gashler A, Sukhatme VP. Early growth response protein 1 (Egr-1): prototype of a zinc-finger family of transcription factors. Prog Nucleic Acid Res Mol Biol. 1995; 50: 191-224.
26. Liu C, Rangnekar VM, Adamson E, Mercola D. Suppression of growth and transformation and induction of apoptosis by EGR-1. Cancer Gene Ther. 1998; 5: 3-28.
27. Aggeli IK, Beis I, Gaitanaki C. ERKs and JNKs mediate hydrogen peroxide-induced Egr-1 expression and nuclear accumulation in H9c2 cells. Physiol Res. 2010; 59: 443-54.
28. Jones N, Agani FH. Hyperoxia induces Egr-1 expression through activation of extracellular signal-regulated kinase 1/2 pathway. J Cell Physiol. 2003; 196: 326-33. https://doi.org/10.1002/jcp.10308.
29. Shin DY, Kim GY, Li W, Choi BT, Kim ND, Kang HS, Choi YH. Implication of intracellular ROS formation, caspase-3 activation and Egr-1 induction in platycodon D-induced apoptosis of U937 human leukemia cells. Biomed Pharmacother. 2009; 63: 86-94. https://doi.org/10.1016/j.biopha.2008.08.001.
30. Shin SY, Lee JM, Lim Y, Lee YH. Transcriptional regulation of the growth-regulated oncogene alpha gene by early growth response protein-1 in response to tumor necrosis factor alpha stimulation. Biochim Biophys Acta. 2013; 1829: 1066-74. https://doi.org/10.1016/j.bbagrm.2013.07.005.
31. Yan SF, Lu J, Zou YS, Soh-Won J, Cohen DM, Buttrick PM, Cooper DR, Steinberg SF, Mackman N, Pinsky DJ, Stern DM. Hypoxia-associated induction of early growth response-1 gene expression. J Biol Chem. 1999; 274: 15030-40.
32. Datta R, Taneja N, Sukhatme VP, Qureshi SA, Weichselbaum R, Kufe DW. Reactive oxygen intermediates target CC(A/T)6GG sequences to mediate activation of the early growth response 1 transcription factor gene by ionizing radiation. Proc Natl Acad Sci U S A. 1993; 90: 2419-22.
33. Cabas I, Chaves-Pozo E, Garcia-Alcazar A, Meseguer J, Mulero V, Garcia-Ayala A. The effect of 17alpha-ethynylestradiol on steroidogenesis and gonadal cytokine gene expression is related to the reproductive stage in marine hermaphrodite fish. Mar Drugs. 2013; 11: 4973-92. https://doi.org/10.3390/md11124973.
34. De Giusti VC, Orlowski A, Ciancio MC, Espejo MS, Gonano LA, Caldiz CI, Vila Petroff MG, Villa-Abrille MC, Aiello EA. Aldosterone stimulates the cardiac sodium/bicarbonate cotransporter via activation of the g protein-coupled receptor gpr30. J Mol Cell Cardiol. 2015; 89: 260-7. https://doi.org/10.1016/j.yjmcc.2015.10.024.
35. Wei W, Chen ZJ, Zhang KS, Yang XL, Wu YM, Chen XH, Huang HB, Liu HL, Cai SH, Du J, Wang HS. The activation of G protein-coupled receptor 30 (GPR30) inhibits proliferation of estrogen receptor-negative breast cancer cells in vitro and in vivo. Cell Death Dis. 2014; 5: e1428. https://doi.org/10.1038/cddis.2014.398.
36. DeBerardinis RJ, Chandel NS. Fundamentals of cancer metabolism. Sci Adv. 2016; 2: e1600200. https://doi.org/10.1126/sciadv.1600200.
37. Liu Q, Chen Z, Jiang G, Zhou Y, Yang X, Huang H, Liu H, Du J, Wang H. Epigenetic down regulation of G protein-coupled estrogen receptor (GPER) functions as a tumor suppressor in colorectal cancer. Mol Cancer. 2017; 16: 87. https://doi.org/10.1186/s12943-017-0654-3.
38. Han MH, Park C, Jin CY, Kim GY, Chang YC, Moon SK, Kim WJ, Choi YH. Apoptosis induction of human bladder cancer cells by sanguinarine through reactive oxygen species-mediated up-regulation of early growth response gene-1. PLoS One. 2013; 8: e63425. https://doi.org/10.1371/journal.pone.0063425.
39. Pagel JI, Deindl E. Disease progression mediated by egr-1 associated signaling in response to oxidative stress. Int J Mol Sci. 2012; 13: 13104-17. https://doi.org/10.3390/ijms131013104.
40. Sakamoto K, Iwasaki K, Sugiyama H, Tsuji Y. Role of the tumor suppressor PTEN in antioxidant responsive element-mediated transcription and associated histone modifications. Mol Biol Cell. 2009; 20: 1606-17. https://doi.org/10.1091/mbc.E08-07-0762.
41. Hartney T, Birari R, Venkataraman S, Villegas L, Martinez M, Black SM, Stenmark KR, Nozik-Grayck E. Xanthine oxidase-derived ROS upregulate Egr-1 via ERK1/2 in PA smooth muscle cells; model to test impact of extracellular ROS in chronic hypoxia. PLoS One. 2011; 6: e27531. https://doi.org/10.1371/journal.pone.0027531.
42. Iyoda T, Zhang F, Sun L, Hao F, Schmitz-Peiffer C, Xu X, Cui MZ. Lysophosphatidic acid induces early growth response-1 (Egr-1) protein expression via protein kinase Cdelta-regulated extracellular signal-regulated kinase (ERK) and c-Jun N-terminal kinase (JNK) activation in vascular smooth muscle cells. J Biol Chem. 2012; 287: 22635-42. https://doi.org/10.1074/jbc.M111.335695.
43. Casaburi I, Avena P, De Luca A, Chimento A, Sirianni R, Malivindi R, Rago V, Fiorillo M, Domanico F, Campana C, Cappello AR, Sotgia F, Lisanti MP, et al. Estrogen related receptor alpha (ERRalpha) a promising target for the therapy of adrenocortical carcinoma (ACC). Oncotarget. 2015; 6: 25135-48. https://doi.org/10.18632/oncotarget.4722.